Smart Grid and Renewable Energy
Vol.5 No.5(2014), Article ID:45580,18 pages DOI:10.4236/sgre.2014.55009
Hybrid Power System Options for Off-Grid Rural Electrification in Northern Kenya
June M. Lukuyu, Judith B. Cardell
Picker Engineering Program, Smith College, Northampton, USA
Email: junelukuyu@gmail.com, jcardell@smith.edu
Copyright © 2014 by authors and Scientific Research Publishing Inc.
This work is licensed under the Creative Commons Attribution International License (CC BY).
http://creativecommons.org/licenses/by/4.0/


Received 6 March 2014; revised 6 April 2014; accepted 13 April 2014
ABSTRACT
For domestic consumers in the rural areas of northern Kenya, as in other developing countries, the typical source of electrical supply is diesel generators. However, diesel generators are associated with both CO2 emissions, which adversely affect the environment and increase diesel fuel prices, which inflate the prices of consumer goods. The Kenya government has taken steps towards addressing this issue by proposing The Hybrid Mini-Grid Project, which involves the installation of 3 MW of wind and solar energy systems in facilities with existing diesel generators. However, this project has not yet been implemented. As a contribution to this effort, this study proposes, simulates and analyzes five different configurations of hybrid energy systems incorporating wind energy, solar energy and battery storage to replace the stand-alone diesel power systems servicing six remote villages in northern Kenya. If implemented, the systems proposed here would reduce Kenya’s dependency on diesel fuel, leading to reductions in its carbon footprint. This analysis confirms the feasibility of these hybrid systems with many configurations being profitable. A Multi-Attribute Trade-Off Analysis is employed to determine the best hybrid system configuration option that would reduce diesel fuel consumption and jointly minimize CO2 emissions and net present cost. This analysis determined that a wind-diesel-battery configuration consisting of two 500 kW turbines, 1200 kW diesel capacity and 95,040 Ah battery capacity is the best option to replace a 3200 kW stand-alone diesel system providing electricity to a village with a peak demand of 839 kW. It has the potential to reduce diesel fuel consumption and CO2 emissions by up to 98.8%.
Keywords:Hybrid Power System, Off-Grid Power System, Wind Energy, Solar Energy, Battery Storage, Multi-Attribute Trade-Off Analysis

1. Introduction
Electricity is a major contributor of global socioeconomic development. It is the foundation for technological advancement, global communication and industrialization, which results in a higher standard of living. However, numerous remote areas in developing countries are not connected to a centralized power grid. The extension of the main grid to low population areas, especially those situated in difficult terrain is associated with high capital outlays and high transmission losses. A study carried out by the World Bank on rural electrification programs placed the average cost of grid extension at between $8000 and $10,000 per km, rising to around $22,000 per km in difficult terrain [1] . For domestic consumers in the rural areas that are not served by a central power grid, the typical method of electrical supply is diesel generators. In the case of Kenya, which provides the focus of this study, there are six diesel power stations providing electricity to remote villages in the Northern part of Kenya (Mandera, Moyale, El Wak, Marsabit, Wajir and Lodwar) as shown in Figure 1.
The price of diesel fuel in Kenya has been escalating over the past decade and has increased by 143% since 2002 [2] . Increasing fuel prices can slow the economic growth of a country and inflate the prices of consumer goods produced in the industries that rely on fuel. This means that despite the high poverty levels in rural areas, the residents will face higher prices not only for electricity in their homes but also for consumer goods and services that are dependent on electricity.
Dependency on fuel imports for the production of electricity also affects national security. Governments in the fuel exporting countries have leverage over policies in the fuel importing countries, through which they could potentially exploit for their benefit. In addition, servicing these villages purely on diesel generation is accompanied by significant greenhouse gas emissions, which contribute to climate change.
Although Kenya’s contribution to global climate change is relatively small, its greenhouse gas emissions are expected to increase rapidly as it becomes more industrialized. Since 2003, there has been a 1.7 million metric ton increase in CO2 emissions in Kenya from electricity and heat production [3] . In the bid to ensure environmental sustainability, United Nations Energy points out the need to use cleaner fuels, and introduces renewable energy in order to reduce environmental and health hazards caused by greenhouse gas emissions [4] . This study addresses the aforementioned problems caused by the sole use of diesel fuel for electricity production by designing functional and reliable off-grid hybrid power systems, which incorporate renewable energy into the existing diesel power systems in the bid to reduce northern Kenya’s dependency on diesel fuel and consequently reduce the carbon footprint. A hybrid power system is a small, often stand-alone system that uses more than one generating technology, usually consisting of one or more renewable energy sources to produce electricity. Figure 2 shows a possible configuration of a hybrid power system.
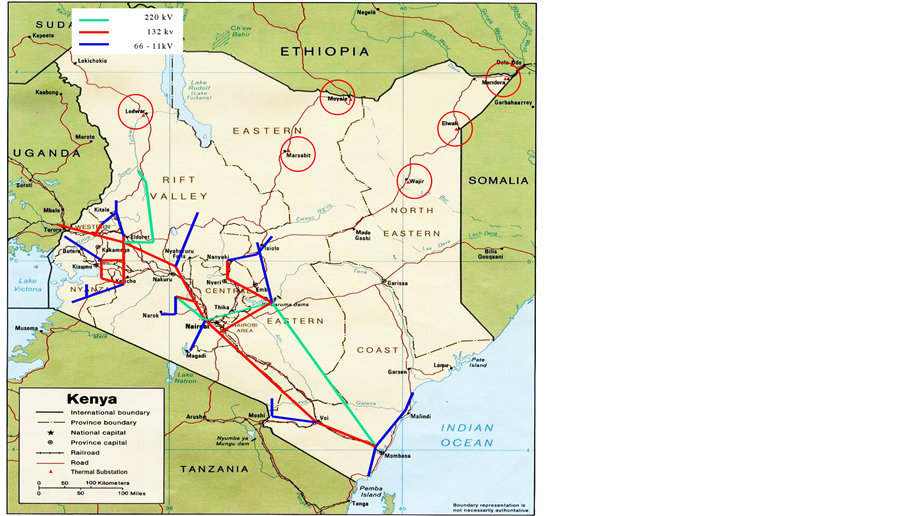
Figure 1. National electric grid system in Kenya showing the six diesel power stations in Northern Kenya [5] .
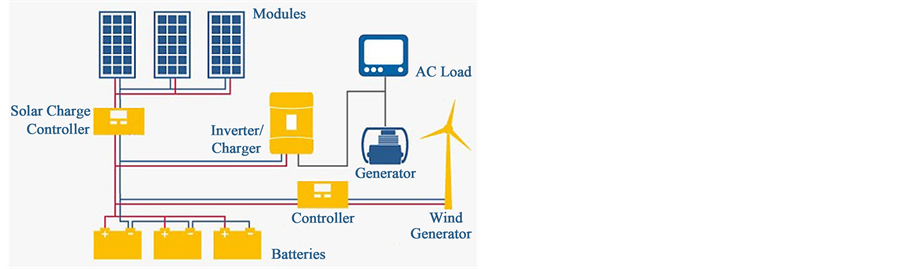
Figure 2. Typical hybrid power system incorporating wind turbines, PV panels and battery storage [6] .
Section 2 presents a background of energy policy in Kenya, Section 3 discusses other hybrid power system projects in developing regions and Section 4 introduces and defines Multi-Attribute Trade-Off Analysis. Section 5 presents input data assessments for Kenyan electrical demand and the wind and solar resources. Section 6 defines the technologies and hybrid systems that are modeled in this analysis, while the results and analyses of the hybrid system options, along with sensitivity analysis on the input data uncertainties are in Section 7. Section 8 concludes and presents directions for future work.
2. Energy Policy Background
In order to achieve the long-term development strategy of the country, Vision 2030, the Kenyan Government identified energy as one of the foundations and enablers of the socio-economic transformation envisioned in the country [7] . They also recognize that climate change could hamper the ambitious development goals articulated in Vision 2030 and developed the National Climate Change Response Strategy of 2010 that integrates the principles of sustainable development into national policies and programs. A Feed-in-Tariffs (FiT) Policy was formulated in 2008, and subsequently revised in 2010, to promote the use of green (low-carbon emissions) energy for electricity generation where feasible, along with improving efficiency in the supply and the end use of electricity. The Feed-in-Tariff policy makes it mandatory for energy companies or “utilities” responsible for operating the national grid to purchase electricity from renewable energy sources at a pre-determined price that is sufficiently attractive to stimulate new investment in the renewables sector. This, in turn, ensures that those who produce electricity from identified renewable energy sources such as solar, wind and other renewable sources have a guaranteed market and an attractive return on investment for the electricity they produce [7] .
In accordance with this policy, the government, in consultation with stakeholders, proposed The Hybrid Mini-grid Project, which involves the installation of 3 MW of wind and solar energy systems in facilities with existing diesel generators. It also proposes a replicable business model for installing 27 additional mini-grids, amounting to 13 MW, consequently reducing GHG emissions in rural electrification [8] . This is expected to make electricity more affordable for the poor and increase generation capacity that will enable more connections and increase access. It will also be instrumental in the advancement of environmental sustainability through the reduction of greenhouse gas emissions. One of the stakeholders and development partners, The African Development Bank, will support conversion of diesel generators into hybrid systems (wind, solar, biomass) and construction of new generators and associated mini-grids in rural areas as outlined in the SREP investment plan for Kenya [4] .
3. Literature Review
Successful results have previously been obtained with hybrid systems in developing countries. Rural communities not able to connect to a national grid and lacking resources to pay the increasing fuel prices have found hybrid systems the most suitable, environmentally friendly and cost competitive solution for power delivery. A photovoltaic/diesel hybrid system installed in rural Tanzania in 2006 provides electricity to several households, community services, small workshops and technical equipment [9] . A similar hybrid system configuration installed in Algeria in 1998 provides electricity to 12 households and community services [9] . A hydro/PV/diesel hybrid system was installed in Laos in 2007 and provides electricity to 98 households and community services [9] . In China, a photovoltaic/wind/diesel hybrid system installed in 2002 provides electricity to 3 villages composed of 500 households, community services (clinic, school, postal office, and TV transferring station) and a tourist facility [9] .
Studies have also been carried out to investigate the potential implementation of off-grid hybrid systems in remote villages. These studies analyzed the technical and economic feasibility of the proposed systems coupled with the resultant reduction of CO2 emissions. A wind/PV/diesel hybrid power system was designed for a village in Saudi Arabia, which is presently powered by a diesel power plant consisting of eight diesel generator sets of 1120 kW each. The study done by [10] found that the proposed system comprising 3 wind turbines each of 600 kW, 1000 kW of PV panels and four diesel generator sets of 1120 kW each was able to meet the energy requirements (AC primary load of 17043.4 MWh/year) of the village and avoid an addition of 4976.8 metric tons of CO2 into the local atmosphere and conserve 10,824 barrels of fossil fuel annually. A study done by [11] proposed a design of an off-grid wind-diesel hybrid system incorporating CHP technology in an island of Bangladesh to serve an energy demand of 168 MWh/day. A cost comparison based on the cost of electricity (COE) between the wind-diesel system and a PV-diesel system was done. It showed that the wind-diesel hybrid system incorporating CHP technology was the most cost effective off grid power system for the island and would result in a CO2 emissions reduction by 33,053 metric tons per year. Reference [12] presented the economic feasibility study of adding wind energy into an isolated off-grid diesel power plant servicing a remote village in Saudi Arabia with an energy demand of 15,943 MWh/yr. Different numbers of 600 kW wind turbines were added to 6 existing diesel units of 1120 kW each and simulated in order to determine the most economically feasible option based on net present cost (NPC) and cost of electricity (COE). The study showed that the hybrid system that incorporated 5 wind turbines to 3 existing diesel generators, was the most feasible option when the wind speed of the area was 7 m/s (51% wind penetration). The system also reduced the CO2 emissions by 3180 metric tons/yr.
Analogous to the aforementioned case studies, this study analyzes the potential implementation of off-grid hybrid power systems in northern Kenya [13] . Different hybrid system configurations consisting of the existing diesel generators plus wind turbines, PV panels and battery storage are modeled and analyzed. However, unlike the previous studies, this study employs a multi-attribute trade-off analysis to determine the best hybrid system configuration option that would reduce diesel fuel consumption, consequently minimizing the CO2 emissions at a minimal net present cost (NPC).
4. Multi-Attribute Trade-Off Analysis
Multi-attribute trade-off analysis enables the evaluation and comparison of system design alternatives for a given planning situation [14] . This approach is based on the premise that most, if not all, system planning problems do not have a single optimum solution but rather have several alternative dominant solutions. The perceived value of these dominant, alternative solutions differs for different stakeholder groups, depending upon their preferences for different attributes, such as the level of system reliability, and different policy and societal priorities [14] .
A visual representation of a trade-off analysis is shown in Figure 3. Each plotted point (the colored boxes and circles) represents one planning scenario and shows the performance of that scenario in terms of the attributes shown on the xand y-axes. For the study presented in this paper, planning scenarios differ according to the hybrid system configuration and the capacity of the system components (wind turbines, PV capacity and battery capacity).
Returning to Figure 3, the set of dominant scenarios are shown on the Pareto Frontier/Curve, the curve closest to the lower left (origin). In this example, the Pareto frontier represents the trade-off between environmental performance and cost.
Both inferior and superior planning options are easily identified from the trade-off plot, with the Pareto frontier identifying all potentially optimal scenarios. The system design alternatives that lie on the frontier curve are considered optimal, dominant or Pareto superior. The remaining system design alternatives are therefore inferior because there is always an alternative on the Pareto frontier that is either less costly or more environmentally friendly or both [15] . For the example in Figure 3, the star shape identifies the scenario with jointly minimized cost and CO2 emissions.
The results of the multi-attribute trade-off analysis performed for this study identify the best hybrid system
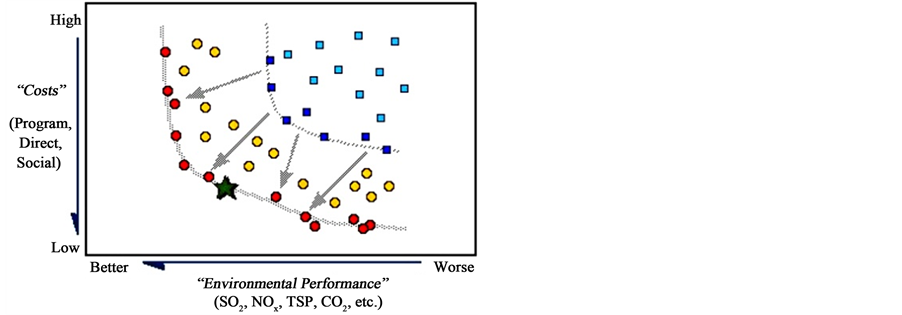
Figure 3. Typical pareto frontier [14] .
designs for northern Kenya, which achieve the optimal reduction in CO2 emissions at a reasonable cost. The results of the hybrid system design analyses for this project are presented in Section 7.
5. Energy Demand & Renewable Resources
Of the six towns in Northern Kenya identified for this study, only Marsabit had the required electrical demand (load), wind speed and solar insolation data readily available. Marsabit was therefore used as the case study area and a sensitivity analysis was carried out to determine the impact of average wind speed variations, average load variations and diesel fuel price variations on the hybrid system design for Marsabit. This analysis was then used to determine how the best hybrid system configuration option for Marsabit would change for the other five locations.
The town of Marsabit is located 170 km east of the center of the East African Rift in the Eastern Province of Kenya at 37˚58'E, 2˚19'N and is almost surrounded by the Marsabit National Park and Reserve. According to the 2009 Kenya population census carried out by the Kenya Bureau of Statistics, Marsabit has a population density of 5 people per square km [16] . The district has limited coverage of classified roads, 62.7 km gravel surface and 37 km earth surface roads, which are impassable during the rainy season [17] . A wind-diesel hybrid system is currently operational in Marsabit comprising of 3 diesel generators with a total capacity of 3.2 MW and a 275 kW wind turbine. Figure 4 shows an overhead satellite map of the study area to give an idea of the terrain of the region.
5.1. Load/Demand Assessment
In many cases, actual load data for rural populations is not readily available and this was the case with the remote regions in Northern Kenya. However, a 24-hour load profile for a typical month in Marsabit was obtained, see Figure 5 [18] , and was used to develop the electrical demand data required for this study. As of June 2010, maximum demand in Marsabit was reported to be 740 kW [19] . According to Kenya Power Company, formerly known as Kenya Power and Lighting Company, power demand in Kenya is projected to grow at an average rate of 6.5% per annum during 2003 to 2023 [20] with the hourly load profile assumed to remain the same. Based on this prediction, the peak load for the year 2012 was adjusted to 839 kW. Electrical consumption does not vary much from month to month since Kenya does not experience winter and summer except for the months of April, August and December when children are on school holidays. During these three months, demand is estimated to increase by 10% [21] . Therefore, the peak load during the other seven months of the year is 755 kW.
5.2. Wind Resource Assessment
In order to estimate the expected power output of the wind turbines in a hybrid system, data pertaining to the wind resource available at the location is required. The annual average wind speeds in northern Kenya collected at an anemometer height of 50 m typically range between 3 m/s and 9 m/s as shown in Figure 6 [22] . Marsabit typically records twice the annual average wind speed range (8.8 - 9.2 m/s) compared to the other five locations, which record an annual average wind speed range of 4.0 - 4.8 m/s. Kenya’s lack of sufficient wind data is a ma-

Figure 4. Satellite map of Marsabit.
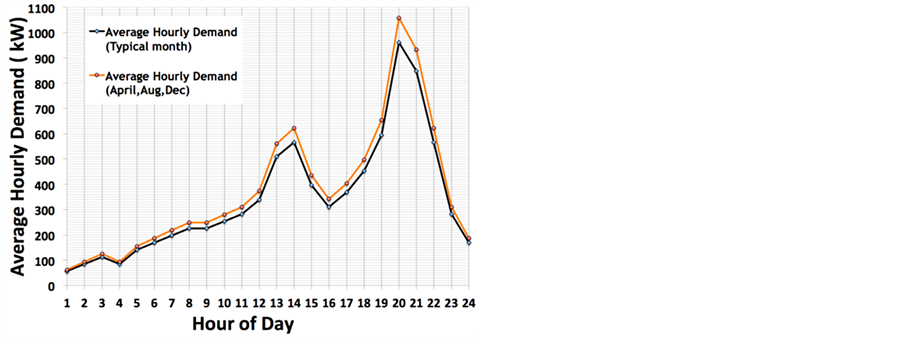
Figure 5. 24-Hour load profile, Marsabit.
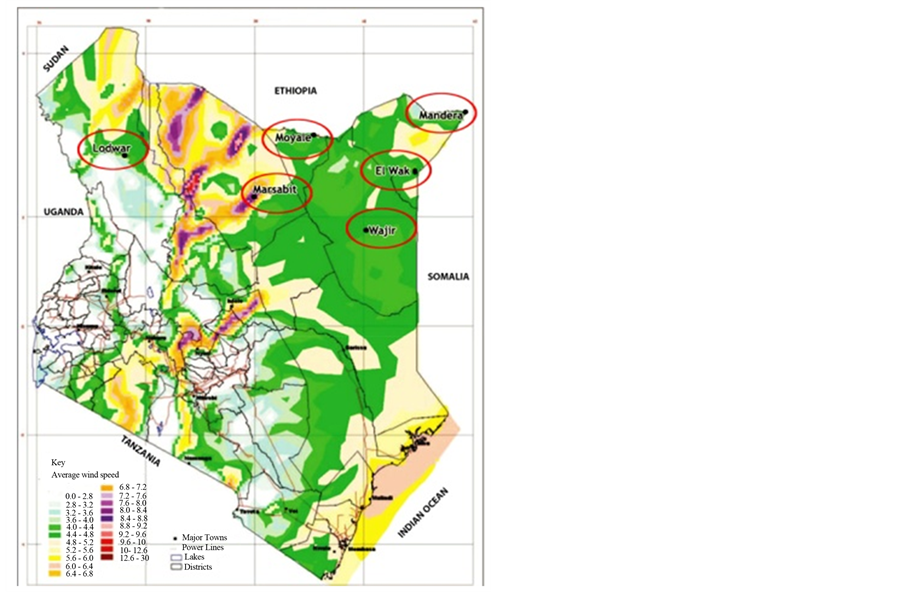
Figure 6. Annual average wind speeds (m/s) over Kenya at an anemometer height of 50 m.
jor barrier affecting the exploitation of wind energy. In particular, multi-year 10 minutes or hourly time series wind data, ideal for this type of analysis, is not available at these locations. Monthly and daily averaged wind speed data was however obtained for the Marsabit region [23] . It is therefore used for the subsequent wind resource analysis and hybrid system.
The monthly average wind speed data for Marsabit was collected and averaged over a 6-year period from 2001-2006 at an anemometer height of 10 m and is shown in Figure 7 [23] . The standard anemometer height is 10 m, however wind power output is determined using wind speeds at the hub height, which is the distance from the turbine platform to the rotor of an installed wind turbine. Therefore, the wind speed at the hub height is predicted in terms of the measured speed at the anemometer height using Equation (1) [23] .
 (1)
(1)
where v2 is the extrapolated wind speed at height z2 (hub height) and v1 is the measured speed at z1 (anemometer height). The exponent α is the wind shear exponent, which determines the shape of the vertical wind profile in the lower stratum of the atmospheric surface layer (ASL), and depends on surface roughness. With a common approximation, adopted for this analysis, the 1/7th power law assumes a constant factor of 0.143 for the shear exponent (which does not depend on geographical features of the monitoring station and ambient atmospheric condition) [24] .
The hourly average wind speed data for Marsabit collected in 2006 is shown in Figure 8 [18] . High wind speeds are prevalent during nighttime hours and they peak above 12 m/s during the early morning hours. The effect of the month-to-month averaged variation on the diurnal wind speed shape is not modeled owing to the unattainability of hourly time series wind speed data for a full year.
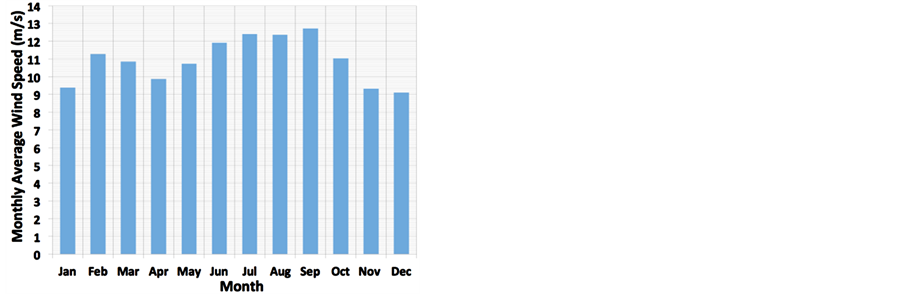
Figure 7. Monthly average wind speeds in Marsabit at an anemometer height of 10 m.
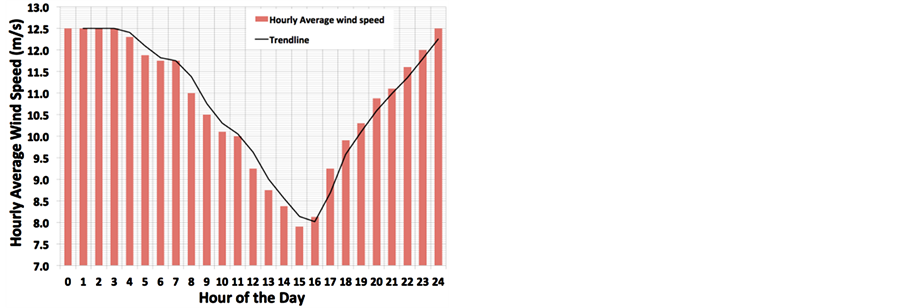
Figure 8. Hourly average wind speeds in Marsabit in 2006 at anemometer height of 10 m.
5.3. Solar Resource Assessment
Kenya is situated on the equator therefore it generally receives consistently high solar radiation. Solar insolation is a measure of solar radiation recorded during a given time, usually an hour on a unit surface area. It is measured in kWh/m2/day. Solar insolation data is used to assess the site-specific solar availability and these values are used to determine the amount of photovoltaic energy output. The system designer must specify the monthly average solar insolation data (kWh/m2/day) and the clearness index values for each month. The clearness index metric is used to approximate the effect of cloud cover on the amount of solar energy that can be harvested at a particular location. It is a measure of the fraction of extraterrestrial radiation, which reaches a given location [25] .
Terrestrial global horizontal solar insolation values in northern Kenya typically range between 5 and 6.5 kWh/m2/day [26] . The monthly average daily total solar insolation (𝐇) on the horizontal for Marsabit was obtained from the NASA Atmospheric Science Data Center for the latitude and longitude representative of the Marsabit site over a 22-year period from 1983-2005 for the months beginning in January and ending in December [27] . The data collected on the horizontal was then elevated to the plane of array at optimal tilt angle to assess the actual plane of array solar insolation available (𝐇T) and is shown in Figure 9. Average values for daily total solar insolation are commonly lower between May and August than between January and March.
Hourly averaged solar radiation data on a horizontal surface for Marsabit town at 3-hour intervals was obtained from the NASA Atmospheric Science Data Center over a 22-year period from 1983-2005 for the months beginning in January and ending in December [27] . These values, averaged for each of the four seasons are shown in Figure 10. Peak average solar radiation is reported at around solar noon.
6. Hybrid System Technologies
As discussed in the introduction, the goal of this research project is to design and evaluate a variety of off-grid hybrid electric power systems for use in rural, Northern Kenya. The hybrid system configurations proposed in this study incorporate wind energy and solar energy into the existing diesel power systems. These configurations are modeled and analyzed to determine the best configurations considering the net present cost (NPC) of the system over its lifetime, diesel fuel consumption and CO2 emissions.
The software package used for the analysis is HOMER, which simulates the operation of various hybrid power system configurations and ranks them on the basis of the net present cost, NPC (the total cost of installing and operating the system over its lifetime). Extensive documentation and examples for use can be found at [28] . HOMER assists the system designer in assessing the technical feasibility of each system design (whether the system can adequately serve the load and other constraints imposed by the user) and then estimates the net present cost (NPC) of the system [29] .
For the study presented here, five hybrid system configurations, in addition to existing stand-alone diesel system, are modeled, simulated and analyzed. These configurations include:
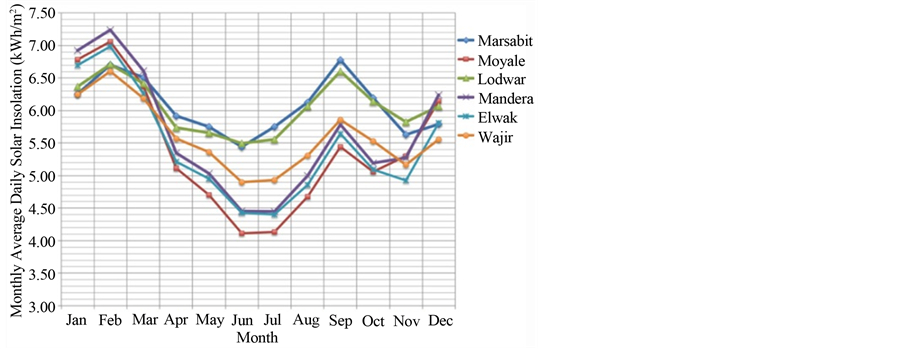
Figure 9. Monthly average daily total solar insolation elevated to plane of array at optimal tilt angle for the six locations in kWh/m2.
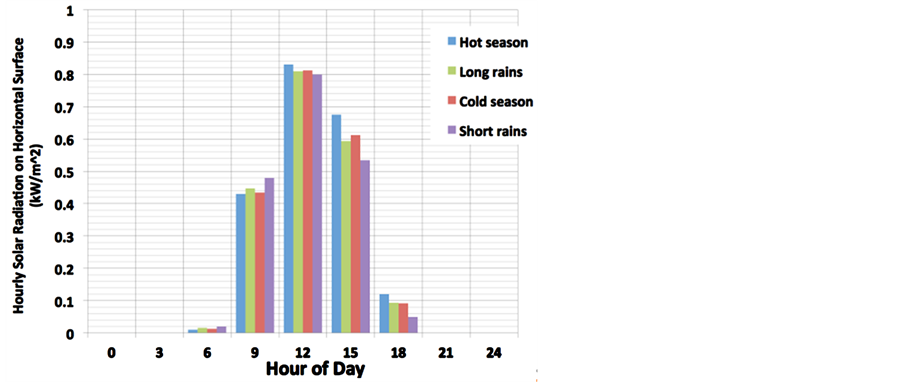
Figure 10. Hourly averaged solar insolation data on a horizontal surface for Marsabit town at 3-hour intervals.
1) Wind-diesel hybrid system
2) Wind-diesel-battery hybrid system
3) PV-diesel hybrid system
4) PV-diesel-battery hybrid system
5) Wind-PV-diesel-battery hybrid system Multi-attribute trade-off analysis is performed for each design option, with representative trade-off graphs included for design options 2 and 5, along with the final multi-attribute trade-off graph comparing all design options.
Sensitivity analyses are conducted to evaluate the economic and technical feasibility of a large number oftechnology options in order to account for variations in technology costs and energy resource availability.
Hybrid System Technology Selections
Table 1 identifies the technologies selected for the hybrid system designs. A detailed discussion and analysis justifying the selection of each technology option is provided in [13] .
Possible system configurations within each design option vary the number and capacity of each technology. The configurations investigated for the wind-diesel design option, for example, include the six possible permutations of the technology mix including one or both wind turbines and one, two or three diesel generators. The number and capacity of units considered is summarized in Table 2. These technology options are discussed in more detail below, within the analysis sections for each design option.
7. Results and Discussion
7.1. Existing System Design
For comparison to the existing electric power supply, the design option using only diesel generators is investigated first. In this stand-alone diesel system, the diesel generators are the only source of power and run throughout the year to meet the entire electrical demand. The stand-alone diesel system currently servicing Marsabit town is comprised of three diesel generators: one CAT® 1200 kW diesel generator and two CAT® 1056 kW diesel generators (see Table 1).
7.2. Option 1: Wind-Diesel System
In this first proposed hybrid system configuration, wind turbines are added to the stand-alone diesel system. The diesel generators operate only during hours when the wind turbines cannot meet the electrical demand. This system is designed to show significant fuel and emissions savings in accordance with the project statement of Vision 2030 [30] , and at the same time ensuring system stability. In order to adhere to this design criteria, a

Table 1. Technologies used in hybrid system designs.
Table 2. Component input values considered in HOMER simulations.
maximum of two 500 kW Vestas v47 wind turbines are added to the system. The capital cost of the wind turbines is $2438 per kW. In this hybrid design analysis, the system is varied to include one, or both, wind turbines, in addition to 1, 2 or all 3 diesel generators, in different combinations.
The system configuration that jointly minimizes NPC and CO2 emissions is found to consist of one 1056 kW diesel generator and both 500 kW turbines. It is associated with an NPC of $8,349,152 and 429.4 metric tons of CO2emissions per year.
The term renewable fraction defines the ratio of the total renewable energy generated to the amount used to serve primary load. This system option has a renewable fraction of 0.8 indicating that 80% of the wind energy produced serves the load. The amount of electricity produced by the wind turbines is 7,864,188 kWh/yr while the AC primary load being met is 2,417,384 kWh/yr. Therefore 71% of the electricity produced by wind is excess (5,924,869 kWh/yr). A battery system is therefore recommended to store the excess electricity produced.
7.3. Option 2: Wind-Diesel-Battery System
In this proposed system configuration, batteries are added to the wind-diesel hybrid system for improved stability of the system given the intermittent nature of the wind, and also to store the excess electricity produced by the wind turbines. If power output from the wind turbines exceeds the demand, the surplus power is stored in the batteries. If demand is higher than the wind power output, the batteries cover the energy deficit until the battery maximum depth of discharge, DOD, is reached. If this limit is reached, the diesel generators are turned on. An inverter is also added to the system to convert DC current from the battery to AC current.
In order to determine the size of the batteries needed, the autonomy hours of the system need to be specified. Thus the simulations for this hybrid design option vary the battery capacity to allow for 2, 4 and 6 autonomy hours (requiring 660, 1320 and 1976 batteries respectively), in addition to including one or both wind turbines and 1, 2 or all 3 diesel generators.
Marsabit has an average daily load of 6.6 MWh/day. Together with a DC system voltage of 48 VDC, inverter efficiency of 0.97 and a battery DOD of 0.5, the daily average capacity of the battery system was calculated to be 142,192.35 Ah/day. The cost of each VRLA AGM 12 Volt battery is $372.59. The typical life cycle of a VRLA battery is 2 years or less depending on the frequency of discharge. For this system, the batteries are assumed to be replaced every two years.
The use of the multi-attribute trade-off analysis for this design option is demonstrated in Figure 11. The relationship between the NPC and CO2 emissions of each alternative system configuration is shown in this figure, with the Pareto optimal frontier drawn in as the dashed curve in the left side of the figure. The system configurations not on the frontier curve are sub-optimal to those on this curve. The use of multi-attribute trade-off analysis
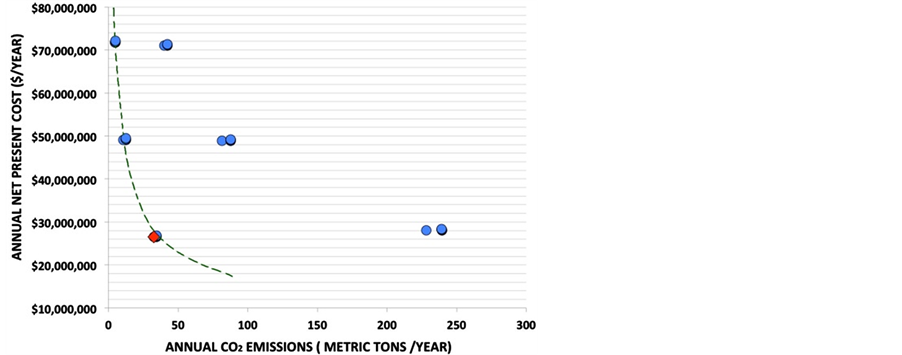
Figure 11. Pareto frontier for wind-diesel-battery hybrid system design configuration.
assists policy development and decision makers by effectively removing all system configurations from further consideration unless they are on the Pareto frontier curve.
For the analysis shown in Figure 11, the clusters of system configuration options along the curve vary in the number of battery autonomy hours, which determines the total capacity of the battery system. The NPC increases as autonomy hours increase (moving up the curve).
The red diamond shape toward the bottom of the curve represents the wind-diesel-battery hybrid system configuration that is associated with jointly minimal NPC and CO2 emissions. The system configuration consists of one 1200 kW generator, two 500 kW turbines and 66,012 V batteries. It is associated with an NPC of $26,548,492 and 32.5 metric tons of CO2 emissions per year. It has a renewable fraction of 0.98. The wind turbines produce 7,864,188 kWh/yr of electricity.
Even with the addition of a battery system, there is still an excess electricity production of 5,924,869 kWh/yr. However, based on these results the capacity factor of the wind turbines was calculated to be 89.8%, which is significantly higher than the typical range of wind capacity factor values (20% - 40%). This is likely due to the unavailability of time step series wind speed data. Instead, average wind speed values are being used to run the simulations. Based on a capacity factor of 40%, the wind turbines would actually produce 3,504,000 kWh of electricity per year, which would still be adequate to meet demand and the surplus electricity produced would be substantially less.
7.4. Option 3: PV-Diesel Hybrid System
In this proposed system, PV panels and an inverter are added to the original, stand-alone diesel system. This system design is varied for a PV capacity of 493 kW and 839 kW, representing the demand reported at the time of maximum solar insolation and the maximum system demand respectively. The design configurations analyzed are also varied by including 1, 2 or all 3 diesel generators.
The system configuration options that incorporate the lower PV capacity of 493 kW are intriguingly more costly than those with a higher PV capacity. This is likely due to the high diesel fuel prices. The higher fuel consumption (116,873 L/yr) in the low PV configuration outweighs the cost of adding 454 kW of PV capacity.
The dominant system configuration for this hybrid design option consists of one 1200 kW diesel generator, one 1056 kW diesel generator and 839 kW PV rated capacity. It is associated with an NPC of $37,568,924 and 2446.3 metric tons of CO2 emissions per year. The PV array produces 1,602,735 kWh/yr, which is 21.8% of its rated capacity. Photovoltaic array capacity factors are typically under 25% [31] . Less than 10% of this energy goes into meeting demand. The surplus energy produced from this system is 2,031,636 kWh/yr. A battery system is therefore recommended to store the surplus energy.
7.5. Option 4: PV-Diesel-Battery Hybrid System
In this proposed system, battery storage is added to the PV-diesel hybrid option to improve the stability of the system. Excess energy from the PV system (energy above the hourly demand) is stored in the battery until full capacity of the storage is reached. The diesel generators are operated only when the PV system cannot generate enough electricity to meet demand and when the battery storage is depleted.
The battery options are the same as those for the wind-diesel hybrid system. In addition to varying the system for 1, 2 or all 3 diesel generator, 493 kW and 839 kW PV capacity, this system is also varied for 2, 4 and 6 autonomy hours for the battery system. The relationship between NPC and CO2 emissions of each alternative system design is shown in Figure 12 with the Pareto optimal frontier curve drawn in on the left side of the figure.
The system configuration options along the curve vary in the number of autonomy hours, which subsequently determines the total capacity of the battery system. However, they all incorporate one 1200 kW diesel generator and 839 kW PV capacity. Of these three options, the red diamond shape represents the dominant system configuration as associated with a jointly minimal NPC and CO2 emissions for this design option. One of the remaining two options on the curve is associated with 123.7 metric tons/yr. increase in CO2 emissions at a $21,293,988/yr decrease in cost and the other option is associated with an 81.7 metric tons/yr decrease in CO2 emissions at a $21,903,896/yr increase in cost.
The optimal system identified here consists of one 1200 kW diesel generator, 132,012 V batteries and 839 kW PV capacity. It is associated with an NPC of $64,140,568 and 983.3 metric tons of CO2 emissions per year. The PV array produces 1,602,643 kWh/yr, which is 21.8% of its rated capacity. 48% of this energy goes into meeting demand. The surplus energy produced from this system reduced to 290,284 kWh/yr after adding the battery system.
7.6. Option 5: PV-Wind-Diesel-Battery System
In this proposed system configuration, a PV array is added to the wind-diesel-battery hybrid system. If demand is less than power output of the wind turbines, the energy surplus is stored in the batteries along with power output from the PV array. If the battery is fully charged, the residual energy is dumped. If demand is greater than the power output of the wind turbines but less than the sum of powers of the PV array and wind turbines, the extra demand is covered by the PV array power output. Any surplus power from the PV array is stored in the batteries. If the power demand is greater than the combined power output from the two renewable sources, the batteries cover the energy deficit. In the event that the batteries have reached the maximum DOD, the diesel generators are switched on. A sophisticated control system is required to operate this system configuration, the cost of which is included in the analysis.
The system is varied for 1, 2 or all 3 diesel generators, one or both wind turbines, a PV capacity of 493 kW and 839 kW and for 2, 4 and 6 autonomy hours for the battery system. The dominant system configuration for this design option consists of one 1056 kW diesel generator, 66,012 V batteries, 2500 kW wind turbines and 839 kW PV rated capacity. It is associated with an NPC of $ 30,158,636 and 6.558 metric tons of CO2 emissions per
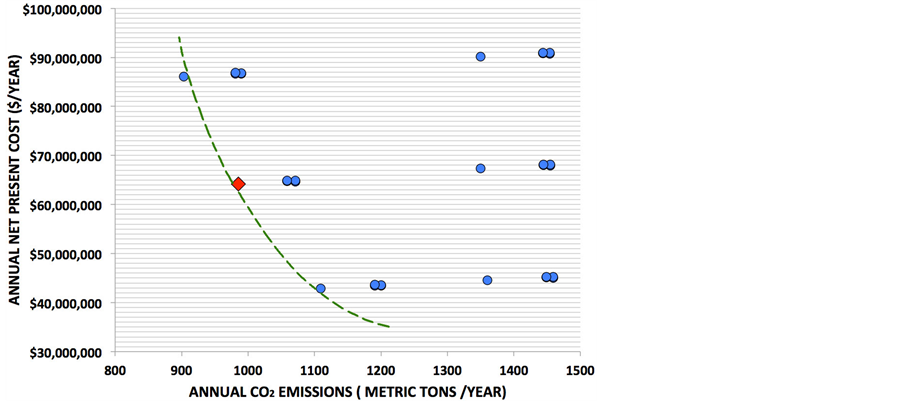
Figure 12. Pareto frontier for PV-diesel-battery hybrid design option.
year. 83% of the renewable energy produced by wind and 17% of the renewable energy produced by PV goes into meeting demand. The electricity produced by the wind turbines is 7,864,188 kWh/yr and that produced by the PV array is 1,604,643 kWh/yr. The surplus electricity produced from the system is 7,055,707 kWh/yr, which is quite high. Taking into account the unrealistically high capacity factor of the wind in the system, the electricity production from the wind turbines may be in actuality significantly less than the reported amount. Consequently, the surplus electricity produced is likely to be much less.
7.7. Hybrid System Optimization
The stand-alone diesel system and the five proposed hybrid system designs were analyzed and compared based the NPC and CO2. The multi-attribute tradeoff analysis determines the set of dominant system configurations along with identifying the best hybrid system in terms of jointly minimizing CO2 emissions and NPC. The system configurations for all six system design options are plotted and the resultant Pareto frontier is shown in Figure 13.
There are four distinct clusters of system configuration options on the curve. They vary in the number of battery autonomy hours, which subsequently determines the total capacity of the battery system. The lowest cluster of system configuration options (least overall cost) has no battery storage incorporated in the systems. The NPC of the remaining clusters of system configuration options increases with the increasing number of autonomy hours (2, 4 and 6).
The curve represents the Pareto optimal frontier of all the dominant system designs, while the red diamond shape represents the dominant hybrid system configuration that jointly minimizes annual NPC and annual CO2 emissions.
The optimal system design identified by the red diamond symbol in Figure 13 is a wind-diesel-battery system, with a configuration of one 1056 kW diesel generator, two 500 kW wind turbines, and 66,012 V batteries. It is associated with an NPC of $26,527,390 and 34.3 metric tons of CO2 emissions per year. This leads to a reduction in CO2 emissions of 2755.1 metric tons per year, which is a 98.8 % decrease with respect to the existing diesel system. There is also a 30% decrease in NPC.
The system configuration option cluster on the curve that is lower than the optimal (red-diamond) system configuration is associated with a 233.1 metric tons/yr increase in CO2 emissions at a $15,823,188 decrease in cost. An addition of 66,012 V batteries to the optimal hybrid system configuration reduces CO2 emissions by 19.9 metric tons/yr yet at a significant increase in cost of $22,573,040/yr. Consistent with multi-attribute tradeoff analysis in general, any of the options along the curve are preferred to all of the sub-dominant (interior points in Figure 13) system configurations.
7.8. Sensitivity Analysis
The sensitivity of the selection of the dominant hybrid system design to uncertainty in the inputs is investigated
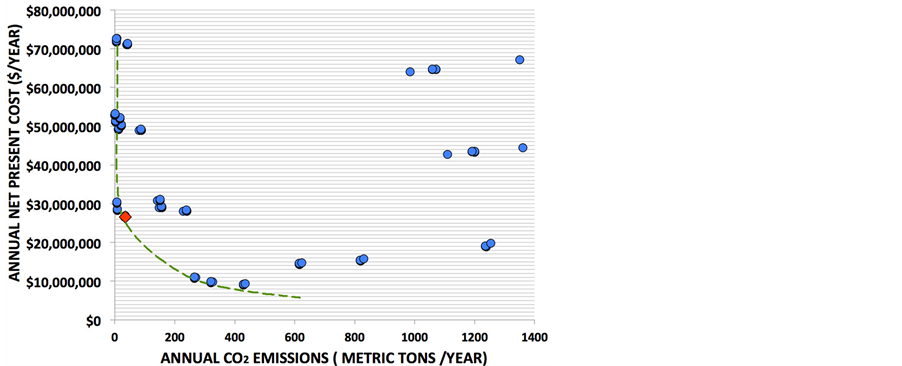
Figure 13. Pareto frontier for all system design configurations.
next. The elements analyzed include the effect of uncertainty in the diesel fuel price ($/L), scaled average wind speeds (m/s) and scaled annual average demand (kWh/d).The effect of best and worst case pairing of wind speed and load level on the NPC and CO2 emissions is also analyzed.
7.8.1. Extreme Scenarios: Wind Speed and Demand
Due to the intermittent nature of wind speeds, three scenarios are defined, simulated and analyzed in order to determine the impact of average wind speed variations on the net present cost of the system and in turn on the amount of CO2 emitted from the hybrid system as outlined below. These scenarios are based on the different levels of wind speeds at different levels of demand.
1) Scenario 1—Medium wind speeds serve an average demand level throughout the year. This scenario is a reference for comparison of the best and worst case scenarios.
2) Scenario 2—Worst-case: Maximum demand with wind speeds below the cut in speed of the wind turbines throughout the year.
3) Scenario 3—Best-case: Low demand with high wind speeds throughout the year.
In Scenario 1, the average demand level was determined by summing hourly average demand values and dividing by the number of hours. The average demand in the months of April, August and December was calculated to be 298 kW, with 267 kW demand during the remaining months. The medium wind speed was determined to be 6.0 m/s for the months of October and November, 8.0 m/s for the months of December to February, 6.0 m/s for the months of March to May and 5.5 m/s for the months of June to September [13] .
The results of this analysis find that with medium wind speeds throughout the year and average demand, the annual NPC of the system would be $26,273,338, with 12.2 metric tons of CO2 emissions being added to the atmosphere every year.4539 liters of diesel fuel would be consumed per year.
In Scenario 2, the maximum demand in Marsabit of 839 kW for the months of April, August and December and 755 kW during the rest of the months is used. If there was no wind throughout the day or if the wind speeds were below 4 m/s (the cut in speed of wind turbine), the annual NPC of the system would be $87,282,072, with 4927.9 metric tons of CO2 emissions being added to the atmosphere every year. This is a 70.0% increase in NPC and a 99.7% increase in CO2 emissions. The amount of diesel fuel consumed each year increases to 1,838,753 L/yr.
In Scenario 3, the low demand in Marsabit was determined to be 49.4 kW in the months of April, August and December and 44.4 kW during the rest of the months. The high wind speed [13] was determined to be 17 m/s for the months of October and November, 20 m/s for the months of December to February, 18 m/s for the months of March to May and 18 m/s for the months of June to September. If there were high wind speeds throughout the year and low demand, the annual NPC of the system would be $26,116,260 with 0.579 metric tons of CO2 emissions being added to the atmosphere every year. This is a 0.599% decrease in NPC and a 95.3% decrease CO2 emissions. The amount of diesel fuel consumed each year decreases to 216 L/yr.
This negative impact of very low or no wind speeds on the NPC of the hybrid system is much larger than the positive impact of high winds. However, the negative impact of low or no wind speeds and the positive impact of high wind speeds on CO2 emissions are both very substantial.
7.8.2. Diesel Fuel Price Forecast
In 2009, the diesel fuel price projections in EUR/MWh from the year 2012 to 2034 were determined using a regression analysis [32] . A typical 3320 kW diesel generator consuming No. 2 diesel fuel oil, consumes fuel at a rate of 55.4 L/h at full load [32] . The price per liter of diesel fuel was therefore determined by multiplying the price per MWh by the capacity and fuel rate of the generator. The fuel price projection forecasts an approximately linear increase in price from $1.55/L in 2012 to $2.80/L in 2034.
7.8.3. Scaled annual Average Demand Projection
The power demand in Kenya is projected to grow at an average rate of 6.5% per annum during 2003 to 2023 [20] . The scaled annual average demand in 2012 based on the demand data available is 6623 kWh/day. The projected growth from the 2012 level is a demand of 13,300 kWh/day in 2023 [13] .
7.8.4. Scaled average Wind Speed Projection
A fundamental element in the assessment of wind energy production is the prediction of the long-term wind resource at the site. If the data is not available, a statistical method known as “measure correlate predict” (MCP) is commonly used. This method uses modeling techniques to relate short-term measurements at the potential wind farm to long-term measurements of wind speeds at a nearby reference station. The on-site wind speeds are compared with concurrently measured wind speeds at the reference station. Once a correlation has been established, it is applied to long-term historic data from the reference station to estimate the long-term wind resource at the potential wind farm [33] .
Since wind speed forecast data for Marsabit was not available, the sensitivity analysis for the scaled average wind speed is based on the individual scaled average wind speeds for the other five locations in Northern Kenya. This analysis is also carried out to examine the impact of average wind speed variations on the hybrid system design for Marsabit so as to determine how the hybrid system configuration would change for the other five locations.
Monthly average wind speed data for these locations was obtained from the NASA Atmospheric Science Data Center for the latitudes and longitudes representative of the locations. It was collected and averaged over a 10-year period from 1983-1993 for the months beginning in January and ending in December at an anemometer height of 50 m. Since the monthly average wind speed data for Marsabit was later re-collected and averaged over a 6 year period from 2001-2006 at an anemometer height of 10 m, the monthly average wind speed data for the other five locations was adjusted based on the ratio of the 1983-93 to the 2001-06 Marsabit wind speed data.
7.8.5. Results of Sensitivity Analysis
For sensitivity to the scaled average, the analysis finds that when there is low average demand, a hybrid system with wind and a 1056 kW diesel generator is the best design. As average demand increases, it is ideal to add PV and upon further increase in demand a 1200 kW diesel generator should be added.
For variations in diesel fuel, the sensitivity analysis determined that as fuel price increases, it is ideal to increase the amount of renewable energy in the system, i.e., add a PV array to the wind turbines to meet demand. This decreases the amount of time the diesel generators run and consequently decreases the amount of diesel fuel being consumed.
As discussed above, the system configuration options on the curve in the cumulative Pareto frontier vary in the number of autonomy hours, which subsequently determines the total number of the batteries (total battery system capacity). The dominant system design option was determined to be Wind/1056 kW diesel gen set/ 66,012 V batteries. The implication of increasing diesel fuel prices with growth in demand on the dominant hybrid system design option is discussed next.
The analysis determined that an increase in diesel fuel at scaled average load levels of less than 11.7 MWh/day does not change the dominant hybrid system design option. However, at scaled average load levels of greater than 11.7 MWh/day, the dominant hybrid system design option changes to incorporate a larger capacity of diesel generation. In addition, when both the diesel fuel price is greater than $1.70 per liter and the scaled average load levels were greater than 11.7 MWh/day, the dominant hybrid system design option changes to also incorporate PV.
Next, the implication of variations in average wind speeds, as scaled average load increases, on the dominant hybrid system design option is discussed. The analysis found that at scaled average load levels of less than 11.7 MWh/day, the dominant hybrid system design option does not change for the given values of scaled average wind speed. Furthermore, the variations in average wind speed in the other five locations do not have an impact on the dominant hybrid system design option determined for Marsabit. This hybrid system design option can therefore be assumed to represent the other five locations as average demand increases over time. However, at scaled average load levels of greater than 11.7 MWh/day, the dominant hybrid system design option changes at different levels of scaled average wind speed and this assumption can no longer hold.
Finally, the implications of variations in average wind speeds, as diesel fuel price increases, on the dominant hybrid system design option is analyzed. At a diesel fuel price of less than $2.40 per liter, the analysis determined that the dominant hybrid system design option does not change for the given values of scaled average wind speed. At a diesel fuel price of greater than $2.40 per liter, the dominant hybrid system design option changes to incorporate larger diesel capacity at scaled average wind speed values of greater than 12.2 m/s. This hybrid system design option can therefore be assumed to represent the other five locations as average diesel fuel price increases over time up to $2.40 per liter.
8. Conclusions
This study analyzes the incorporation of renewable energy and storage technologies into stand-alone diesel power systems servicing six remote villages in northern Kenya, in the bid to reduce Kenya’s dependency on diesel fuel and consequently reduce the carbon footprint. Successful results have already been obtained with hybrid systems in rural communities in developing countries worldwide. Owing to the availability of abundant wind and solar resources in northern Kenya, six different configurations of hybrid energy systems incorporating wind energy, solar energy and battery storage were proposed, simulated and analyzed. The study confirms the feasibility of these hybrid systems with many configurations being profitable. A multi-attribute trade-off analysis was employed to determine the best hybrid system configuration option that would reduce diesel fuel consumption, and jointly minimize the CO2 emissions and net present cost (NPC).
The key findings of this study are:
A. The simulations and analysis results find that the wind-diesel-battery configuration consisting of two 500 kW turbines and 95,040 Ah battery capacity is the best option to replace the stand-alone diesel system providing electricity to a village with a peak demand of 839 kW. This system significantly reduces fuel consumption and CO2 emissions at minimal net present cost. It consumes 12,114 liters of diesel fuel and emits 32.5 metric tons of CO2 gas every year, which is a 98.8% reduction from that of the stand-alone diesel system at a 30% lower net present cost of $ 26,548,492.
B. The sensitivity analysis finds that very low or no wind speeds have a large negative impact on the net present cost (70% increase) of the hybrid system compared to the positive impact of high winds (1% decrease). However, impact on CO2 emissions in both cases is very substantial (>95% increase and decrease respectively). Very low or no wind speeds have a 1.98% probability of occurrence, compared to a 1.25% probability of high wind speeds occurring.
C. An increase in diesel fuel prices and the demand for electricity, based on future projections, result in a substantial increase in both the net present cost of the system (75% increase) and the CO2 emissions(57% increase).
D. As the price of diesel fuel and the electricity demand increase over the years, it would be more economical and environmentally friendly to increase the amount of renewable energy capacity in the system by adding PV panels.
E. At scaled average load levels of greater than 11.7 MWh/day, the dominant hybrid system design option changes to incorporate a larger capacity of diesel generation. In addition, when the diesel fuel price is greater than $1.70 per liter and scaled average load levels are greater than 11.7 MWh/day, the dominant hybrid system design option also changes to incorporate PV.
F. The hybrid system design option for the town of Marsabit can be assumed to represent the other five locations (Moyale, Mandera, Wajir, Lodwar and El Wak) for scaled average load levels of less than 11.7 MWh/ day and diesel fuel prices less than $2.40 per liter. This is because that the variations in average wind speed in the other five locations do not have an impact on the dominant hybrid system option, which was designed for Marsabit. However, at scaled average load levels of greater than 11.7 MWh/day and diesel fuel prices greater than $2.40 per liter, the dominant hybrid system design option changes at different levels of scaled average wind speed and this assumption can no longer hold.
The key findings in this study suggest that the Hybrid Mini-grid Project could be a solid investment and an example of a successful Feed-in-Tariffs (FiT) Policy. The proposed hybrid system could potentially reshape the Kenyan energy industry, indicating that future work should explore the country’s policies concerning electrical power production and distribution to ensure that these policies are met with the implementation of the proposed hybrid system project.
The key findings of this study also indicate that in order to achieve policy strategies and development targets with regards to the incorporation of renewable energy, especially wind energy to the power grids, future work should focus on a detailed analysis of the variability of the wind resource. The integration of a substantial amount of wind power in isolated electrical systems needs careful consideration, so as to maintain a high degree of reliability and stability of the system operation. Due to the high production forecasting uncertainties, there may be problems with operational scheduling (e.g., unit commitment) as well as steady state and dynamic system stability concerns. These problems may considerably limit the amount of wind generation that can be connected to the power systems, increasing the complexity of their operations [15] . Ongoing analysis should therefore include simulation of the proposed hybrid system dynamic performance in order to analyze system voltage and frequency stability and to develop guidelines for the optimal operation of the system.
The results obtained from the simulations show that there would be significant excess electricity produced from the hybrid system design options. Based on the arid nature of Marsabit, future work that explores the possibility of incorporating a water-pumping unit to the system will benefit the community. Water pumping can make use of the excess electricity produced to provide water for household use and also for agriculture.
The results presented here provide a solid foundation for this future research into the efficacy of renewable resources, in the reduction of greenhouse gas emissions. This study provides a framework upon which Kenya can transit into a more environmentally friendly and sustainable country through the energy sector.
References
- Moner-Girona, M. (2008) A New Scheme for the Promotion of Renewable Energies in Developing Countries: The Renewable Energy Regulated Purchase Tariff. http://www.energy.eu/publications/LDNA23284ENC_002.pdf
- Trading Economics (2012) Pump Price for Diesel Fuel (US Dollar Per Liter) in Kenya. http://www.tradingeconomics.com/kenya/pump-price-for-diesel-fuel-us-dollar-perliter-wb-data.html
- The World Bank (2012) Data Kenya: World Development Indicators. http://data.worldbank.org/country/kenya
- International Energy Agency (2011) Energy for All: Financing Access for the Poor. Proceedings of the Energy for All Conference, Oslo, 10-11 October 2011, 1-52.
- Kianji, C.K. (2013) Kenya’s Energy Demand and the Role of Nuclear Energy in Future Energy Generation Mix. Presented at the Joint JAPAN-IAEA Nuclear Energy Management School, Tokai-Mura, Japan, 18 June 2012.
- Phaesun. (2013) Stand-Alone Solar Solutions, Hybrid Systems. http://www.phaesun.com/systems/references/rural-electrification/hybrid-systems.html
- The Republic of Kenya (2011) Scaling-Up Renewable Energy Program (SREP): Investment Plan for Kenya (Unpublished). http://www.renewableenergy.go.ke/downloads/policy-docs/Updated_SREP_Draft_Investment_Plan_May_2011.pdf
- Scaling-Up Renewable Energy Program Country Investment Plan, Kenya. Lecture Presented at SREP Sub-Committee Meeting, Cape Town, 21 June 2011.
- Alliance for Rural Electrification (2012) Hybrid Power Systems Based on Renewable Energies: A Suitable and CostCompetitive Solution for Rural Electrification. http://www.ruralelec.org/fileadmin/DATA/Documents/06_Publications/Position_papers/ARE-WG_Technological_Solutions_-_Brochure_Hybrid_Systems.pdf
- Rehman, S., Al-Hadhrami, M.L. and Mahbub, A.M. (2012) Feasibility Study of a Wind-PV-Diesel Hybrid Power System for a Village. Elsevier: Renewable Energy, 38, 258-268. http://dx.doi.org/10.1016/j.renene.2011.06.028
- Nahid-Al-Masood, R., Mirza, J., Ahmed, A.H., Abedin, S.R., Deeba, F., Begum, H.M. and Chowdhury, A.H. (2011) Design of a Cost Effective Off-Grid Wind-Diesel Hybrid Power System in an Island of Bangladesh. World Academy of Science, Engineering and Technology, 60, 312-315.
- Rehman, S., Ahmad, F., Shaahid, S.M., Shash, A., El-Amin, I.M., Al-Shehri, A.M. and Bakhashwain, J.M. (2011) Feasibility Study of Hybrid Retrofits to an Isolated Off-Grid Diesel Power Plant. Renewable and Sustainable Energy Reviews, 11, 635-653. http://dx.doi.org/10.1016/j.rser.2005.05.003
- Lukuyu, J.M. (2013) Design and Analysis of Hybrid Power System Options for Off-Grid Rural Electrification in Northern Kenya. B.Sc. Thesis, Smith College, Northampton.
- Tabors, R.D. and Hornby, R. (2005) The Use of Multi-Attribute Trade-Off Analysis in Strategic Planning for an Electric Distribution Utility: An Analysis of Abu Dhabi Distribution Company. Proceedings of the 38th Hawaii International Conference on System Sciences, Big Island, 3-6 January 2005, 61b. http://dx.doi.org/10.1109/HICSS.2005.621
- Karapidakis, E.S. (2010) Wind Power Impact on Power System Dynamic Performance. In: Muyeen, S.M., Ed., Wind Power, INTECH, Croatia, 558.
- Kenya National Bureau of Statistics (2013) Population and Housing Census. Constituency Population by Sex, Number of Households, Area and Density. http://www.knbs.or.ke/index.php?option=com_content&view=article&id=165:population-distribution-by-sex-number-of-households-area-and-density-by-administrativeunits&catid=114&Itemid=639
- Elliot, F. and Roth, E.A. (2005) As Pastoralists Settle: Social, Health, and Economic Consequences of the Pastoral Sedentarization in Marsabit District. Kluwer Academic, New York.
- Mbogho, M.S., Wekesa, C., Murage, D. and Toyoda, J. (1996) Economic Analysis of Supplying an Electro Village Using Alternative Electrical Power Sources. IEEE 4th AFRICON, 2, 968-971. http://dx.doi.org/10.1109/AFRCON.1996.563026
- Mwangangi, S., Koech, W., Akinala, J. and Omwega, T. (2010) Environmental and Social Impact Assessment Project Report for Proposed Two 250 KW Wind Turbines at Marsabit. http://www.kplc.co.ke/fileadmin/user_upload/Documents/ESIA/ESIA%20of%20Two%20250%20KW%20Wind%20Turbines%20at%20Marsabit%20District.pdf
- Mwangi, D. (2003) Kenya’s Electricity Demand Projections and Role of Geothermal Resource in National Power Development Plan. Eastern Africa Geothermal Market Acceleration Conference, Nairobi, 9-11 April 2003, 23-43.
- Ouma, C. (2011) Hybrid Energy System for Off-Grid Rural Electrification (Case Study Kenya). Ph.D. Thesis, Gotland University, Sweden.
- Oludhe, C. (2008) Assessment and Utilization of Wind Power in Kenya—A Review. Journal of Kenya Meteorological Society, 2, 39-52.
- Kamau, J.N., Kinyua, R. and Gathua, J.K. (2010) 6 Years of Wind Data for Marsabit, Kenya Average over 14 m/s at 100 m Hub Height; An Analysis of the Wind Energy Potential. Renewable Energy, 35, 1298-1302. http://dx.doi.org/10.1016/j.renene.2009.10.008
- Apratim, R. (2012) Derivation of Surface Roughness and Capacity Factor from Wind Shear Characteristics. International Journal of Renewable Energy Research, 2, 348-355.
- McKahn, D. (2012) Bringing Extraterrestrial Radiation to the Plane of Array. Lecture presented at Smith College, Northampton, 11 September 2012.
- National Renewable Energy Laboratories (2005) Kenya Global Horizontal Solar Radiation [Image]. GIS Database.
- NASA (2012) Surface Meteorology and Solar Energy. Atmospheric Science Data Center Database. https://eosweb.larc.nasa.gov/order-data
- HOMER Energy (2013) Optimizing Clean Power Everywhere. Energy Modeling Software for Hybrid Renewable Energy Systems. http://homerenergy.com/index.html
- Rehman, S. and Al-Hadhrami, L.M. (2010) Study of a Solar PV/Diesel/Battery Hybrid Power System for a Remotely Located Population near Rafha, Saudi Arabia. Renewable and Sustainable Energy Reviews, 35, 4986-4995. http://dx.doi.org/10.1016/j.energy.2010.08.025
- The Kenya Government (2007) Kenya Vision 2030, a Globally Competitive and Prosperous Kenya. http://www.kilimo.go.ke/kilimo_docs/pdf/Kenya_VISION_2030-final.pdf
- Wikipedia (2013) Photovoltaics. http://en.wikipedia.org/wiki/Photovoltaics
- Vuorinen, A. (2007) Planning of National Power Systems. http://www.optimalpowersystems.com/stuff/planning_of_national_power_systems.pdf
- Wind Energy: The Facts (2013) Analytical Methods for the Prediction of the Long-Term Wind Regime at a Site. http://www.wind-energy-the-facts.org/analytical-methods-for-the-prediction-of-the-long-term-wind-regime-at-a-site.html