Energy and Power Engineering
Vol.09 No.03(2017), Article ID:75088,23 pages
10.4236/epe.2017.93012
Two-Dimension Numerical Simulation of Parabolic Trough Solar Collector: Far North Region of Cameroon
Charlain-Joel Ngangoum Keou1*, Donatien Njomo1, Vincent Sambou2, A. R. Andrianaharinjaka Finiavana3, Ahmadou Diaby Tidiane2,4
1Environmental Energy Technologies Laboratory (EETL), University of Yaounde I, Yaounde, Cameroon
2Laboratoire d’Energitique Appliquée(LEA), Université Cheikh Anta Diop, Ecole Polytechnique de Dakar, Dakar, Senegal
3Laboratoire de Thermique Appliquée, Ecole Supérieure Polytechnique, Université d’Antsiranana, Diégo-Suarez, Madagascar
4Université Européenne de Bretagne, Equipe MTRhéo, Laboratoire de Génie Civil et Génie Mécanique (LGCGM), Institut
National des Sciences Appliquées de Rennes et Université de Rennes, Rennes, France

Copyright © 2017 by authors and Scientific Research Publishing Inc.
This work is licensed under the Creative Commons Attribution International License (CC BY 4.0).
http://creativecommons.org/licenses/by/4.0/


Received: November 21, 2016; Accepted: March 28, 2017; Published: March 31, 2017
ABSTRACT
Cameroon lives in the era of great infrastructures in order to reach the economic emergence by 2035. These infrastructures require a solid framework of energy provisions from many natural energy sources and resources that the country possesses. Speaking of natural energy resources, the country is particularly gifted by solar energy potential in the far north. This region of the land is densely populated but much of the populations do not have access to electricity since they live in remote areas far from national electricity grid. Solar thermal energy appears then as real potential to fulfill the growing demand of energy and reduce fossil fuel use dependence. Moreover, it would also be a grandiose opportunity for hospitals in these regions to provide hot water for Sterilization. As the design of a solar thermal plant strongly relies on the potential of direct solar irradiance and the performance of a solar parabolic trough collector (PTC) estimated under the local climate conditions, in this paper, we annually compute direct solar radiation based on monthly average Linke turbidity factor and various tracking modes in two chosen sites in the far north region of Cameroon. Also, a detailed two dimensional numerical heat transfer analysis of a PTC has been performed. The receiver has been divided into many control volumes along his length and each of them is a column consisting of glass, vacuum, absorber and fluid along which mass and energy balance have been applied. Direct solar irradiation, ambient temperature optical and thermal analyses of the collector receiver takes into consideration all modes of heat transfer and the nonlinear algebraic equations were solved simultaneously at each instant during a day of computation using Engineering Equation Solver (EES). To validate the numerical results, the model was compared with experimental data obtained from Sandia National Laboratory (SNL). It has shown a great concordance with a maximum relative error value of 0.35% and thermal efficiency range of systems about 66.67% - 73.2%. It has also been found that the one axis polar East-West and horizontal East-West tracking with 96% and 94% of full tracking mode respectively, were most suitable for a parabolic trough collector throughout the whole year in the two towns considered.
Keywords:
Cameroon, Parabolic Trough, Tracking Modes, Receiver Thermal Performance

1. Introduction
The solar collector’s technology offers a promising method for the large scale use of solar energy. The interest of this has been continuously growing since theirs utilizations do not have dire effects on environment and the availability of the solar resource is endless. In a study carried by Greenpeace [1] , it has been found that the use of concentrating solar power (CSP) can prevent the emission of 154 million tons of CO2 by 2020. Just one 50 MWel parabolic trough power plant can cut the annual heavy oil consumption by 30 million liters and thus eliminate 90,000 tons of carbon dioxide (CO2) emissions [1] . There are four main types of CSP technology, namely the dish collector that consists of a parabolic-shaped point focus concentrator in the form of a dish that reflects solar radiation onto a receiver mounted at the focal point; the linear Fresnel collector, which uses a series of long flat, or slightly curved, mirrors placed at different angles to concentrate the sunlight on either side of a fixed linear receiver; the solar tower, or central receiver systems, where sun-tracking mirrors called heliostats focus sunlight onto a receiver at the top of a tower which converts into heat; and the parabolic trough collector (PTC), which use parabolic reflectors in order to concentrate the solar radiation into a small focal line. Among the aforementioned CSP technologies, the PTC is the most widespread and the most cost effective taking into account the 2419 MWe capacity currently installed worldwide and under construction [2] . From domestic hot water, electricity generation, desalinization, industrial process heat, air-conditioning, refrigeration, distillation to enhanced oil recovery with the range of temperature about 150 - 400 C, it involves a large range of applications. The heat transfer analysis of these collectors is important for the calculation of thermal losses and sizing of the solar power plant during preliminary design and also permits the evaluation of the effects of collector degradation and Heat Transfer Fluid (HTF) flow rate control strategies on overall plant performance once the geometry and thermal properties are stated.
Various studies have been carried out in order to predict, evaluate and estimate performance of parabolic trough collector under many weather conditions and configurations. A detailed heat transfer solar receiver model has been performed by Forristall [3] . Implemented on Engineering Equation Solver (EES), the one and two dimensional models of energy balance for several segments along the receiver were used for short and long receivers. Very wide investigations on PTC with numerous key parameters which influence efficiency under many meteorological conditions have been carried out. The study has revealed that the two dimensional analysis was more accurate particularly for the study of lengthy receivers on PTC and showed great concordance with experimental data measured in existing plant available at Sandia National Laboratory (SNL). Among many propositions suggested so that to improve models was making the models dynamic to perform the same study with every instant of a day.
A model for the solar field was developed by Patnode [4] using the TRNSYS simulation program. The Rankine power cycle was separately modeled with a simultaneous equation solving software (EES). Both the solar field and power cycle models were validated with measured temperature and flow rate data from the SEGS VI plant from 1998 and 2005. The thermal losses and resultant outlet temperatures are modeled assuming 50% of collectors experience some loss of vacuum and hydrogen permeation.
Kalogirou Soteris [5] proposed a model written on EES and validated with data from Sandia National Laboratory (SNL). This model has shown that for the case of bare tube (glass envelope broken), that a reduction of 41.8% in convective heat losses leads to improvement in the performance of the heat transfer model [5] [6] . Based on the results obtained, it has been concluded that the model was suitable for the calculation of heat losses and collector efficiency under different flow, selective coating and operating conditions. The potential of direct solar irradiance in Algeria and the performance of solar parabolic trough collector (PTC) has been estimated under the climate conditions of the country. A computer program in FORTRAN based on the Hottel model has been used for evaluating different tilted and tracking modes so as to determine the most efficient system for the PTC.
In order to evaluate the performance of a tracking solar parabolic trough collector, a heat transfer model has been developed by Ouagued et al. [7] . The receiver, or heat collector element (HCE), has been divided into several segments and heat balance was applied in each segment over a section of the solar receiver. The differential equations were solved by modified Euler method. The study concluded that the Syltherm 800 heat transfer fluid represented the best thermal capacity over all the year for the studied locations compared to the other heat transfer fluids. Also, temperature range, cost and availability could dictate which HTF to use.
Cheng et al. [8] have carried out a three-dimensional numerical simulation of coupled heat transfer characteristics in the receiver tube calculated and analyzed by combining the Monte Carlo Ray-Trace (MCRT) Method and the fluent software, in which the heat transfer fluid and physical model were Syltherm 800 liquid oil and LS2 parabolic solar collector from the testing experiment of Dudley et al. [9] . The model has shown an average difference about 2% compared with test results from three typical testing conditions.
Wang et al. [10] have investigated through numerical simulation, the effect of inserting metal foams in receiver tube of parabolic trough collector on heat transfer. Based on a three-dimensional numerical simulation performed using Gambit and Computational Fluid Dynamics (CFD) code Fluent has shown that the optimum thermal performance is obtained when a 0.75 high stack of metal foams was inserted at the top of the receiver tube. Additionally, it has been concluded that the maximum circumferential temperature difference on the out surface of receiver tube decreases about 45% when the optimum thermal performance is obtained, which would greatly reduce the thermal stress.
Lobón et al. [11] have introduced a computational fluid dynamic simulation approach to predict the behavior of a solar steam generating system. A written STAR-CCM + code has been used to implement an efficient multiphase model capable of simulating the dynamics of the multiphase fluid in parabolic-trough solar collectors. They concluded that the overall mean squared error between computed and measured temperature values was lower than 6% for all considered cases.
Marif et al. [12] have developed a computer program based on one dimensional implicit finite difference method with the energy balance approach considering two fluids namely liquid water and TherminolVP-1™ synthetic oil. Moreover, the study involves estimations of the intensity of the direct solar radiation. According to their simulation findings, the one axis polar East-West and horizontal East-West tracking systems were most desirable for a parabolic trough collector throughout the whole year in Algeria as stated in the paper. They concluded that the liquid water is the best thermal fluid as it presents many advantages: low cost and good thermal performance, however, only useful for low temperature applications (T < 100 C) such as domestic hot water, water distillation, air-conditioning and refrigeration. Whereas for very high temperature applications it is necessary to use synthetic oil.
Basbous et al. [13] performed a numerical study on thermal performances of a parabolic trough solar collector using the nanofluid Al2O3-Syltherm 800 as a working fluid. The mathematical model used in this work was based on energy balances of the collector and has been validated with experimental data of SNL. The results have shown that the nanoparticles significantly improve the convection coefficient between the receiver and the heat transfer fluid and could decrease the heat losses in about 10%.
Our ongoing model performs using values of the monthly Linke coefficient according to the four main tracking modes present in the literature direct solar irradiation annually. This is one operating in two chosen sites in Cameroon in order to predict which one is the most efficient in the considered regions. The second part of this paper is dedicated to a numerical simulation of the parabolic trough solar collector in Makari situated in the far north region of Cameroon using Therminol VP1 synthetic oil as heat Transfer Fluid (HTF). Based on a two-dimensional energy Balance equations written on Engineering Equation solver Program (EES), the model takes into consideration all modes of heat transfer: convection into the receiver pipe, in the annulus between the receiver and the glass cover, and from the glass cover to ambient air; conduction through the metal receiver pipe and glass cover walls; and radiation from the metal receiver pipe to the glass cover and from the glass cover to the sky. Besides evaluating efficiency, optical and thermal losses and pressure drop along the flowing pipe, the great feature of this model is that it performs and evaluates all of the aforementioned parameters during a test day.
2. Solar Irradiation Absorption
2.1. Direct Normal Solar Irradiation
Based on a cross-section of the collector represented in Figure 1,  , the direct solar radiation, which reaches the reflector curve was determined using the following equation [12] :
 (1)
(1)
 is the atmospheric mass and
  is the integral Rayleigh optical thickness given by [12] [13] :
 (2)
(2)
 (3)
(3)
The average monthly values of linke turbidity factor , for long time measurement have been taken from [14] and recapitulated in the Table 1 for both considered sites.

Figure 1. A radial section of receiver with heat transfer interactions.

Table 1. Monthly average linke turbidity factor for Makari and Maroua [14] .
2.2. Tracking Modes
The modes of tracking for PTCs can be generally separated into a single axis tracking or two axes tracking. Two axes tracking follows not only the sun’s changing altitude, but also the sun’s changing azimuth, so as to concentrate the parallel rays incident on the reflectors right onto the receiver tube, whereas for single axis tracking, the collectors can be orientated in one of the three ways: North-South direction, which tracks the sun from east to west (horizontal E-W tracking), or an East-West direction, tracking the sun from north to south (horizontal N-S tracking), or tilted at an angle equal to the latitude of the installation site facing directly to the sun to track the sun’s east-west movement (polar E-W tracking).
The incidence angle between the sun beam and the main normal direction of PTCs, affects the amount of incident irradiation obtained on the reflectors (cosine loss), which relies on the mode of tracking, as shown in Table 2.
2.2.1. Solar Irradiation Absorption in the Glass Envelope
The equation for the solar absorption in the glass envelope in the cross-section considered depends on the tracking mode given by:
 (4)
(4)
And
 (5)
(5)
where the incident angle modifier K is expressed as in [9] by:
Table 2. Incidence angle for various tracking modes [15] .
 (6)
(6)
2.2.2. Solar Irradiance Absorption in the Absorber Pipe
The solar energy absorbed by the absorber occurs very close to the surface; therefore, it is treated as a heat flux. Consequently, the equation for the solar absorption in the absorber section can be expressed as following:
 (7)
(7)
with  (8)
(8)
and  (9)
(9)
2.3. Two-Dimensional Energy Balance Model
Even though no glazing PTC’s receiver are used for low-temperature applications, only the glazed receiver is taken into account in this paper. The receiver collector is divided into “n” sections along the longitudinal cutting as shown in Figure 2(a). Each cross-section is subdivided into five points following the radial cutting of the collector receiver from the external side of the glass envelope to the fluid Figure 2(b) with assumptions that all temperatures, heat fluxes, and thermodynamic properties are uniform around the circumference of the receiver. In addition, Temperature is assumed to be continuous at the bounding surfaces. With these assumptions, based on one-dimensional energy balance, the radial heat transfer terms depicted in Figure 1 with various dimensions are highlighted in Figure 2(b) and Table 4 can be modeled with the following equations:
 (10)
(10)
 (11)
(11)
 (12)
(12)
 (13)
(13)
 (14)
(14)
 and
and  are considered in this paper as heat fluxes since the glass absorptance is relatively small, subsequently, any error in considering solar absorption as a surface phenomenon should be relatively small [3] .
In the sections below, several heat transfer analyses have been depicted taking
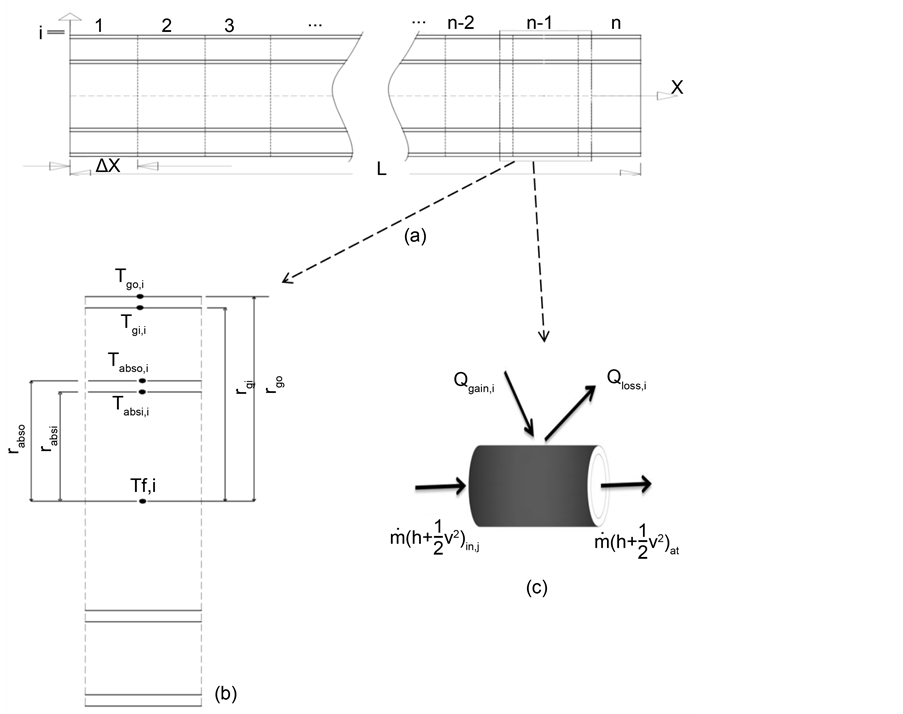
Figure 2. Two dimensional model of receiver.
into account of every heat interactions between collector receiver components firstly, as well as between collector receiver and its surrounding environment. From the top side of the glass envelope to heat fluid transfer, heat transfer interactions follow the five points stated in Figure 2(b). Considering potential Energy is neglected and mass flow rate is constant, the steady-state energy balance for a receiver segment “i” illustrated in of length receiver element  is given by:
 (15)
(15)
Replacing each term with its value and ordering we obtain:
 (16)
(16)
where
 (17)
(17)
With  representing the number of bracket in the cross-section “i”.
The bracket heat loss , is estimated with the following equation:
 (18)
(18)
The average convection coefficient of bracket  is calculated by the Churchill and Chu correlation as detailed in Section 3.1.2 for both wind and no
wind cases with the average temperature of . The (Equation (16)) al-
low us the determine  from a section at each time. Additionally, the inlet fluid velocity
  is determined from the absorber cross-sectional area and volumetric flow rate, both of which are inputs. The remaining velocities are calculated from conservation of mass and continuity at the segment boundaries.

The pressure drop along the pipe is expressed in [3] as:
 (19)
(19)
The Darcy friction factor  is given by the Haaland correlation in [16] as:
 (20)
(20)
The roughness coefficient of the pipe is equal to  and all thermophysical properties are calculated at the average temperature of the HTF for each cross-section.
2.4. Heat Transfer from the Glass Envelope to the Atmosphere
Convection and radiation are both transfer modes by which glass envelope heat is transferred from the glass envelope to the atmosphere. The convection can either be forced or free relying on the presence or absence of wind, respectively. Radiation heat loss supervenes owing to the temperature difference between the glass envelope and the sky.
2.4.1. Radiation Heat Transfer
To predict the performance of solar collectors, it is necessary to evaluate the radiation exchange between the glass envelope and the sky. The sky can be considered as a blackbody at some equivalent sky temperature  so that the actual net radiation between the glass envelope and the sky is given by [17] as:
 (21)
(21)
where  is given by Padilla in [6] as:
 (22)
(22)
And  as a function dependent on time, maximum and minimum temperature is determined by [18] as following:
 (23)
(23)
2.4.2. Convection Heat Transfer
From Newton’s law of cooling, the convection heat transfer from the glass envelope to the atmosphere is given by:
 (24)
(24)
With  (25)
(25)
The Nusselt number depends on whether the convection heat transfer is natural (no wind) or forced (with wind). Thus, we will distinguish two cases as following:
2.5. No Wind Case
The correlation developed by Churchill and Chu [19] is employed to evaluate the Nusselt number on natural convection between the glass envelope and the exterior air in the absence of wind as below:
 (26)
(26)

This correlation assumes a long isothermal horizontal cylinder. Also, all the fluid properties are determined at the film temperature, .
.
2.6. Wind Case
In the presence of wind, the convection becomes forced and the Zhukauskas’s correlation [11] is used:
 (27)
(27)
According to [3] [4] :
 and
and 
All fluid properties are evaluated at the atmospheric temperature,  , except
 , which is evaluated at the glass envelope outer surface.
2.7. Heat Transfer between the Absorber Pipe and the Glass Envelope
Between the absorber and the glass envelope, two heat transfer modes take place namely: Convection and radiation. The convection mechanism depends on the annulus pressure. Depending on whether this pressure is low or high the heat interaction occurring is either molecular or free convection respectively. Radiation results from temperature differences between the outer absorber surface and the inner glass envelope surface.
2.7.1. Convection Heat Transfer
When the annulus is under vacuum (pressure < 0.013 Pa), the convection heat transfer between the receiver pipe and glass envelope occurs by free-molecular convection and is given by [20] :
 (28)
(28)
 (29)
(29)
For: ;
;  and
and

As the gas annulus in this is air, the mean-free-path between collisions of a molecule,  , the accommodation coefficient, a, the ratio of specific heats for the annulus gas
 , the annulus gas pressure
 , and the molecular diameter of annulus gas, δ, are written in Table 3 with their respective units [3] .
In reverse when the annular space is under pressure (pressure > 0.013 Pa), the free convection phenomenon takes place there, obeying the Raithby and Holland’s correlation between concentric horizontal cylinders given in [5] as:
 (30)
(30)
All physical properties are evaluated at the average temperature  and the equation is valid for
2.7.2. Radiation Heat Transfer
Estimated by the following equation [21] , the radiation heat transfer between the
Table 3. Heat transfer coefficients and constants for air.
absorber and glass envelope is given as:
 (31)
(31)
2.8. Convection Heat Transfer between the HTF and the Absorber
From Newton’s law of cooling, the convection heat transfer from the inside surface of the absorber pipe to the HTF is:
 (32)
(32)
 (33)
(33)
As the Nusselt Number relies on flow type, we distinguish three main cases of flows:
In the case of laminar flow (Re < 2300), assuming the problem of heat transfer in laminar flow of an incompressible, constant property fluid in the fully developed region of a circular, constant heat flux, as in the case of a PTC, the Nusselt number is equal to 4.36 [21] .
In the case of turbulent flow (Re > 4000), the Nusselt number is given by the Gnielinski correlation in [3] as:
 (34)
(34)
With  (35)
(35)
In the transition region , Gnielinski proposed the following equation:
 (36)
(36)
where  (37)
(37)
 is easily found from the laminar case above and
  can be evaluated in (Equation (33)) taking
 .
.
2.9. Conduction Heat Transfer through the Absorber Pipe Wall
Conduction heat transfer through the absorber pipe wall is determined by the Fourier’s law of conduction through a hollow cylinder as following:
 (38)
(38)
The absorber pipe thermal conductivity , evaluated at the average absorber pipe temperature, can be expressed with the equation below as stainless steel 321H absorber material has been chosen in this study [4] :
 (39)
(39)
3. Solution Procedure, Results and Discussions
There are two programs solution which have been developed based on the characteristics of the solar PTC used in Table 4 of this paper.
The first one has been written in Matlab in order to evaluate the annual solar energy received on the absorber pipe according to various tracking modes operating in the considered locality. In the Matlab code, solar irradiation has been computed each five minutes from the sunrise to the sunset each day during a year. Results revealed that Makari locality has more than 3500 h/year sunshine duration. Also, the yearly energy received based on different tracking modes is illustrated in Figure 3 and energy collected depending on the period of the year for various tracking modes is reported in Table 5.
Table 4. Characteristics of solar PTC [3,5].
Table 5. Comparison of absorbed energy for various tracking modes.

Figure 3. Annual variation of absorbed energy for different tracking modes.
In this figure it can be seen that compared to other tracking modes, the irradiation of full tracking mode is highest at each period of the year due to the physical movement of the PTC along two axes. But for E-W polar and horizontal tracking modes, irradiation is larger in the summer period and smaller in the winter period. Additionally, as far as N-S horizontal tracking mode is concerned, the amount of irradiation in the winter is more than that in the summer due to the seasonal position of the earth in relation to the sun; for both these periods, the collected irradiation remains less than those of E-W tracking modes in Makari.
From the Table 5, it can be found that the one axis polar East-West and horizontal East-West tracking annually with 96% and 94% of that of full tacking mode respectively, were most desirable for a parabolic trough collector through- out the whole year in the two towns considered since most of PTC plants operate using one axe tracking. Also, simulation findings reveal slight discrepancies for absorbed irradiance per length both between each period of the year and throughout the year in the two localities.
The second one program code is developed on EES to evaluate the performance of HCE since EES automatically identifies all unknowns and groups of equations for most efficient solutions. In addition, it provides built-in mathematical and thermal-physical property functions and numerous HTFs in its library. Nonetheless, one inconvenience of this software is that it does not allow a large amount of variables. This is the reason we have implemented annually solar absorbed energy in Matlab and divided our receiver length in 8 cross-sections. Furthermore, the step-time of irradiation’s variable is the quarter of an hour. However, the present EES code can performs daily analyses on HCE. Hence, (Equation (1)) to (Equation (39)) are solved simultaneously at each instant for a day long.
The model results have been compared to experimental data provided by Sandia National Laboratory (SNL) with Great satisfaction as illustrated in Table 6. The close concordance between simulations and experimental data of the outlet fluid temperature can be appreciated since the maximum relative error value does not exceed 0.35%.
Inasmuch as the efficiency of the collector is strongly related to the mass flow rate of the fluid in the absorber pipe, we computed the program with many values of mass flow rates and deduced how much flow rate influences the efficiency in Figure 4. Considering 900 W/m2 as direct normal solar irradiation, 30˚C as ambient temperature and Therminol-VP1 as HTF, wind speed equal to 3 m/s and 25˚C as inlet fluid temperature, it has been noted from simulation findings that the more flow mass flow rate increases the higher the efficiency (Figure 5) due to the fact that the residence time of the fluid inside the pipe is longer thus it collects more heat from the pipe but also allows long time for losses due to this
Table 6. Comparison of the outlet fluid temperature experimental [3] and simulation results.

Figure 4. Mass flow rate influence on the collector efficiency.

Figure 5. Variation of the fluid temperature along the pipe for various values of mass flow rate.
fact efficiency decreases. At 0.1 kg/s the temperature recorded is the highest, but the efficiency is the lowest among various values of mass flow rate tested, namely 66.67%. Also, the temperature of fluid has been monitored during his route inside the absorber pipe and shown in Figure 5. From both graphs, in order to satisfy an acceptable outlet fluid temperature and good efficiency, the value of 0.2 kg/s of mass flow rate has been retained for the next investigations in this paper corresponding to the efficiency value of 72.49%.
Also, the collector efficiency depends on useful energy as the absorbed energy does not vary in this case. The useful energy, in its turn, mainly depends on mass flow rate and temperature variation. From a certain mass flow rate value, the temperature difference tends to slightly change, but as we lower the mass flow rate, the efficiency is negatively affected. Hence the rapid drop of efficiency observed between 0.2 and 0.1 kg/s.
As mentioned above, the irradiation obtained from the full tracking mode and ambient temperature vary based on each quarter of an hour as shown in Figure 6. From the graph, speaking of irradiation, the sunrise happens very early. Both irradiation and ambient temperature increase continuously until reaching their peak values around the midday in Makari. From there, begins the drop of the curves till the sunset around 5 p.m. for the considered day.
At each single value of time-step, the five points’ temperatures are then computed Figure 7. The shape of the five temperature curves follows that of the irradiation during the day. It can be noticed that the both outlet and inlet glass envelope temperatures are the lowest during day time hours thus showing the low thickness of the glass envelope and the low thermal absorptance of this material as well. While the temperatures of the absorber pipe are indeed close, and also the highest in the system of five points temperatures since this pipe has been coated in order to convert the most irradiation into heat. Fluid temperature in its turn, receives, the heat from the absorber to reach the maximum value around 100˚C for the chosen day depending mostly on mass flow rate.
The energy rate on the HCE has been also studied in this paper as illustrated by Figure 8. due to the low temperature difference between the outer side of the glass cover and the surrounding temperature on the one hand, and between the cover and the sky on the other, helps to reduce the growth of radiative and convective lost energies which are the main  components, thus confining

Figure 6. Direct solar radiation and ambient temperature variation over time.

Figure 7. Temperature evolution of the five points.

Figure 8. Energy rate on receiver.
this energy to a range of values from approximately 70 W/m, just after sunrise, to 700 W/m, just before sunset. However the remaining lowest of the three considered graphs also follows a similar growth shape linked to that of the temperature of the glass outer cover such as highlighted in Figure 7.  Meanwhile, in the same interval of time, following the same growth as that of
  but presents as it higher values closely depends not only on irradiation but also on the optical characteristics of the parabolic trough collector. Its

Figure 9. Pressure drop inside the pipe along the day.
values are established between 110 W/m and 1020 W/m.
 follows the rhythm of irradiation with values ranging from 300 W/m and 2800 W/m, far superior to the losses at any time. Thermal losses with a maximum percentage of less than 25% of the energy gained confirms that the study is worthy of interest in Makari.
The pressure drop in the pipe has been analyzed as exemplified in Figure 9 because this knowledge is very essential, especially when we have to operate at a low mass flow rate and a sufficiently long tube. At first, in the morning, the pressure drop is important due to the fact that the heat transfer fluid is more viscous, increasing the friction between the fluid and the pipe walls. As we approach the middle of the day, this pressure drop is subject to a characteristic shrinking because the fluid receiving more heat, thermally expands and becomes less dense and therefore there is a reduction in predominantly responsible frictional forces of the pressure drop in the pipe. A similar phenomenon to that of the morning is observed in the afternoon until sunset.
4. Conclusion
In this paper, we have first evaluated local solar potential for the four tracking modes and unearthed that the one axis polar East-West and horizontal East- West tracking annually with 96% and 94% of full tracking mode respectively, were most suitable for a parabolic trough collector throughout the whole year in the two towns considered. Also, we have numerically investigated thermal and optical analyses on a PTC’s receiver in Makari based on a two dimensional model of a receiver written on EES taking into account all of heat transfer interactions. Although many assumptions have been taken for the elaboration of this model, simulation findings have revealed that their impacts on the study are almost negligible due to the fact that the maximum relative error value between outlet numerical and experimental fluid temperature does not exceed 0.35%.
Cite this paper
Keou, C.-J.N., Njomo, D., Sambou, V., Finiavana, A.R.A. and Tidiane, A.D. (2017) Two-Dimension Numerical Simulation of Parabolic Trough Solar Collector: Far North Region of Cameroon. Energy and Power Engineering, 9, 147-169. https://doi.org/10.4236/epe.2017.93012
References
- 1. Stoddard, L., Abiecunas, J. and O’Connell, R. (2006) Economic, Energy, and Environmental Benefits of Concentrating Solar Power in California. National Renewable Energy Laboratory, Subcontract Report NREL/SR-550-39291, Golden.
- 2. http://1.csptoday.com/LP=15138?utm_campaign=2218+26OCT16+DB&utm_medium=email&utm_source= Eloqua&elqTrackId=7bb96cd6c68a4ded8b3d01fa5f439df2&elq=39a2423ce92f483f8f7297cb3de14346&elqaid= 23068&elqat=1&elqCampaignId=10307 October 2016.
- 3. Forristall, R. (2003) Heat Transfer Analysis and Modeling of a Parabolic Trough Solar Receiver Implemented in Engineering Equation Solver. National Renewable Energy Laboratory (NREL), Golden. https://doi.org/10.2172/15004820
- 4. Patnode, A.M. (2006) Simulation and Performance Evaluation of Parabolic Trough Solar Power Plants. Master Thesis. University of Wisconsin-Madison: College of Engineering, Madison.
- 5. Kalogirou Soteris, A. (2012) A Detailed Thermal Model of a Parabolic Trough Collector Receiver. Energy, 48, 298-306.
- 6. Padilla Ricardo, V., Demirkaya, G., Yogi Goswami, D., Stefanakos, E. and Rahman Muhammad, M. (2011) Heat Transfer Analysis of Parabolic Trough Solar Receiver. Applied Energy, 88, 5097-5110.
- 7. Ouagued, M., Khellaf, A. and Loukarfi, L. (2013) Estimation of the Temperature, Heat Gain and Heat Loss by Solar Parabolic Trough Collector under Algerian Climate Using Different Thermal Oils. Energy Conversion and Management, 75, 191-201.
- 8. Cheng, Z., He, Y., Xiao, J., Tao, Y. and Xu, R. (2010) Three-Dimensional Numerical Study of Heat transfer Characteristics in the Receiver Tube of Parabolic Trough Solar Collector. International Communications in Heat and Mass Transfer, 37, 782- 787.
- 9. Dudley, V.E., Kolb, G.J., Sloan, M. and Kearney, D. (1994) Test Results: SEGS LS-2 Solar Collector. Sandia National Laboratories, SAND94-1884, Albuquerque.
- 10. Wang, P., Liu, D.Y. and Xu, C. (2013) Numerical Study of Heat Transfer Enhancement in the Receiver Tube of Direct Steam Generation with Parabolic Trough by Inserting Metal Foams. Applied Energy, 102, 449-460.
- 11. Lobón, D.H., Valenzuela, L. and Baglietto, E. (2014) Modeling the Dynamics of the Multiphase Fluid in the Parabolic-Trough Solar Steam Generating Systems. Energy Conversion and Management, 78, 393-404.
- 12. Marif, Y., Benmoussa, H., Bouguettaia, H., Belhadj, M. and Zerrouki, M. (2014) Numerical Simulation of Solar Parabolic Trough Collector Performance in the Algeria Saharan Region. Energy Conversion and Management 85, 521-529. https://doi.org/10.1016/j.enconman.2014.06.002
- 13. Basbous, N., Taqi, M. and Belouaggadia, N. (2015) Numerical Study of a Parabolic Trough Collector Using a Nanofluid. Asian Journal of Current Engineering and Maths, 4, 40-44.
- 14. http://re.jrc.ec.europa.eu/pvgis/apps4/pvest.php?map=africa September 2016.
- 15. Wang, C., Zhang, H. and Wang, S. (2015) Applied Research Concerning the Selection of Track Modes of Parabolic Trough Collectors in Sub-Tropical Area. International Journal of Control and Automation, 8, 251-262. https://doi.org/10.14257/ijca.2015.8.7.26
- 16. Kiijarvi, J. (2011) Darcy Friction Factor Formulae in Turbulent Pipe Flow. Lunowa*Fluid Mechanics Paper 110727, 29 July 2011.
- 17. Duffie, J.A. and Beckman, W.A. (2013) Solar Engineering of Thermal Processes. 2nd Edition, Madison, New York; John Wiley & Sons, Hoboken. https://doi.org/10.1002/9781118671603
- 18. Maher Chaabene. Gestion énergétique des panneaux photovoltaiques. Universite de Sfax.
- 19. Price, H., Lupfert, E., Kearney, D., Zarza, E., Cohen, G. and Gee, R. (2002) Advances in Parabolic Trough Solar Power Technology. Journal of Solar Energy Engineering, 124, 109-125. https://doi.org/10.1115/1.1467922
- 20. Ratzel, A., Hickox, C. and Gartling, D. (1979) Techniques for Reducing Thermal Conduction and Natural Convection Heat Losses in Annular Receiver Geometries. Journal of Heat Transfer, 101, 108-113. https://doi.org/10.1115/1.3450899
- 21. Bergman, T.L., Lavine, S.A., Incropera, F.P. and Dewitt, D.P. (2011) Fundamentals of Heat and Mass Transfer. 7th Edition, John Wiley & Sons, Hoboken.
Nomenclature
Symbols
 Cross-sectional area (m2)
 Specific heat (J/kg-K)
 Diameter (m)
 Darcy friction factor
 Gravitational constant (m/s2)
 Heat transfer coefficients (W/m2-K),
Enthalpy [J/kg]
 Direct solar radiation (W/m2)
 Solar constant (1367 W/m2)
 Thermal conductivity (W/m-K)
L Receiver Length (m)
 Atmospheric mass
 Mass flow rate (kg/s)
 Nusselt number
P Pressure (mmHg), perimeter (m)
 Prandtl number
 Heat transfer rate per unit receiver length (W/m)
Solar irradiation absorption rate per unit receiver
Length (W/m)
 Solar irradiance per receiver unit length (W/m)
 Net heat flux per unit circumferential area (W/m2)
 Rayleigh number
 Reynolds number
 Temperature (°C)
 Link turbidity factor
 Time length since sunrise (h)
 Bulk fluid velocity (J/kg)
Greek
 Absorptance
 Sun elevation angle (deg)
 Volumetric thermal expansion coefficient (K−1)
 Sun-Earth correction distance, Emittance
 Incidence angle (deg)
 Integral Rayleigh optical thickness
 Declination (deg)
 Effective optical efficiency, Efficiency
 Transmittance factor
 Solar azimuth angle (deg)
 Receiver segment length (m)
 HTF pressure drop (Pa)
 Stefan-Boltzmann constant
 Density (kg/m3)
Subscripts
 Ambient
 Absorber pipe
 Between inner and outer
walls of absorber
 At average temperature
 Between outer absorber
wall and inner glass
 Bracket
 ;
;  Convection; Conduction
 Collector
 Fluid
Fluid
 Glass envelope
 Gained
Loss Lost
 Between inner and outer
glass envelope
 Between outer glass envelope
and ambient air
 Between outer glass envelope
and sky
 Section “
 ”; inner
 Inlet
Inlet
 Laminar
 Maximum
 Minimum
 Outer
Outer
Opt Optical
 Radiation
 Sky
Sky
 At standard conditions
 Turbulent
 Total
Total
Abbreviations
E-W East west
N-S North south
AE Autumnal Equinoxes
SE Spring Equinoxes
SS Summer Solstice
WS Winter Solstice