Energy and Power Engineering
Vol.07 No.11(2015), Article ID:60639,9 pages
10.4236/epe.2015.711049
Overvoltage Condition Assessment of a Microgrid Due to Faults Occurring in the Islanded Mode of Operation
Ricardo Leon Vasquez-Arnez1, Dorel Soares Ramos2, Tesoro Elena Del Carpio Huayllas2
1Foundation for the Technological Development of the Engineering Sciences (FDTE), São Paulo, Brazil
2Department of Electric Power and Automation Engineering, University of São Paulo, São Paulo, Brazil
Email: rarnez@fdte.org.br, dorelram@usp.br, tesoroelena@hotmail.com
Copyright © 2015 by authors and Scientific Research Publishing Inc.
This work is licensed under the Creative Commons Attribution International License (CC BY).
http://creativecommons.org/licenses/by/4.0/


Received 2 July 2015; accepted 24 October 2015; published 27 October 2015
ABSTRACT
This paper presents the results of the simulations and their respective analyses corresponding to the power frequency overvoltages resulting from various fault types occurring inside a microgrid. During the islanded mode of operation, the analysed microgrid can be simultaneously fed by a diesel generator, a 1 MW wind power turbine, a small solar system and a 1 MW hydroelectric scheme. The operating voltage of the microgrid is 2.4 kV. During a fault in the system, the overvoltages normally occur in two remarkable instants. The first one occurs at the beginning of the fault itself. The second one occurs at the instant when the fault is cleared. The major concern here is the overvoltage during the fault period. Due to the travelling wave effect along cables and overhead lines composing the microgrid system, these overvoltages can be amplified, thus jeopardizing the insulation level of the microgrid transmission system and related equipment. Much of the work available now is dedicated to overvoltages present in high-voltage systems leaving a gap for the study and behaviour on low voltage microgrid systems. The overvoltage stress is characterized by the maximum low-frequency, short-duration (crest value) of the overvoltage. Both cables and overhead lines that constitute the microgrid transmission system are characterized by their R-L-C parameters. The simulations of the microgrid system are conducted using the ATP program. According to the international ANSI and IEEE standards, the minimum BIL (Basic Impulse Insulation Level) and BSL (Basic Impulse Switching Level) for the 2.4 kV voltage level are 20 kV and 10 kV, respectively; thus, care should be taken so that the healthy phases upon which commonly appear such overvoltages are not exceeded in their insulation level.
Keywords:
Islanded Mode, Microgrids, Overvoltage, Short-Circuit

1. Introduction
The establishment of microgrid systems is nowadays regarded by the power industry as one of the alternatives to assist not only critical loads but also provide electricity to some regular consumers, especially during periods of prolonged unexpected interruptions. However, in an analogous way to the operation of large power systems, a microgrid can also face periods of overvoltage which, depending on its nature and duration, can significantly affect or even damage the affected circuit or, in the worst of the cases, the whole microgrid.
Any overvoltage present in an electrical installation disturbs equipment. The most important factor in low- frequency short-duration overvoltages or in switching overvoltages, compared to overvoltages due to lightning, is that they have got longer duration; thus, imposing a detrimental effect on equipment and the insulation of the installation. Various can be the causes for the presence of overvoltages in a microgrid, namely [1] .
- Faults inside the microgrid: both line-to-ground (L-G) and double-line-to-ground (L-L-G) faults;
- Resonance phenomenon: series resonant overvoltages (when natural frequency of circuits » AC power frequency) and overvoltages resulting from ferroresonance (due to the interaction between capacitors and saturable iron-core inductors, hence the terms ferro and resonance);
- Voltage regulation: due to microgrid connection to a large amount of distributed generators;
- Lightning effect: overvoltages due to direct impact of lightning on the phase conductors and, overvoltages due to indirect impact of lightning (strikes at the vicinity of the line);
- Switching overvoltages: due to cable energisation or those due to shunt capacitor switching;
- Load rejection.
Some specific cases of overvoltages have been previously studied. The conclusion of [1] , for example, is that resonant overvoltages and those produced by lightning are among the most serious overvoltages in microgrids. The overvoltage caused by reverse power flow, which is a major factor that limits the PV (photovoltaic) power output is studied by [2] . The proposed online control strategy is, reportedly, able to maintain the PV voltages within certain limits. A model and its simulation results of a three phase inverter that is able to perform well in the presence of balanced or unbalanced loads is presented in [3] . Additionally, the inverter will be able to limit fault currents (thus, overvoltages) effectively without significant distortions of voltage and current waveforms. The effect of the addition of a PV array and a battery storage to a predominantly diesel powered microgrid is investigated by [4] . Issues like the steady-state overvoltage, temporary undervoltage, under and over frequency, among others, are discussed in that reference. Overvoltages stemming from lightning which are transferred into a microgrid through the transformers present inside a microgrid are studied by [5] .
2. Types of Overvoltages Analysed
The faults to be considered here, and which give rise to overvoltages, are:
- Line-to-ground fault;
- Line-to-line fault;
- Double line-to-ground fault;
- Broken conductor.
The other type of overvoltages (e.g. due to ferroresonance, line energisation, switching, etc.) are not studied here, as they need a somewhat different approach. Overvoltages due to lightning are not discussed either. During line-to-ground faults the system zero sequence impedance should be included in the analysis. The healthy phase(s) during fault periods normally exhibit a voltage increase.
3. Description of the Analysed Microgrid
The microgrid system used in the simulations is connected to the utility through a main circuit-breaker (CB) in series with a 6 MVA, 2.4/13.8 kV transformer (Figure 1). The energy sources considered here are a 2.0 MVA synchronous generator, driven by a diesel engine, which is connected to Bus 1 through a 0.48/2.4 kV transformer and cables Z1 and Z4. A 1.0 MVA synchronous hydro-generator (SHG) connected to Bus 1 through a 0.6/2.4 kV transformer and cables Z2 and Z6. A 0.9 MVA wind turbine driving a Doubly-Fed Induction Generator (DFIG) connected to Bus 1 through a 0.69/2.4 kV transformer and cables Z3 and Z8. The characteristics of the DFIG generator are based on the wind generator used by [6] .
All cables (with impedances Z1 through Z9, except Z6) have similar parameters. Such parameters, as well as

Figure 1. Microgrid used in the simulations.
the OHTL (Z6), are presented in Appendix section. The type of the cable is 500 MCM (copper) whose maximum in-duct current is about 470 A (90˚C).
The microgrid loads (Load 1, Load 2 and Load 3) were specified as constant power loads. The complete system was implemented in both the EMTDC/PSCAD [7] and ATP [8] programs. In the PSCAD program some of the components (such as the source models and the constant power loads) were taken from its own library. This program was used to validate the steady-state response of the specific microgrid considered. To do so, the main parameters of the generators like the direct and quadrature reactances as well as the transient and subtransient time constants (Xq, T′′do, X′′q, T′′qo, etc) were estimated according to [9] .
No PV (photovoltaic) systems or sources requiring energy storage elements were considered because the primary focus of this study is to analyse sources containing rotating parts rather than sources based on static devices. The machine equations are omitted here as they can be found in the available literature dealing with electric machines.
Previous publications such as that presented by [6] already addressed issues related to the transition from the grid-connected to the islanded mode of operation and load shedding within a microgrid. However, a study focused on the overvoltages due to internal faults is still needed. The maximum fault current occurs when all three sources inside the microgrid are operating.
From Table 1, withdrawn from [10] , it can be seen that the IEC low frequency short-duration withstand voltage for Vmax = 3.6 kV is equal to 10 kV rms (phase-to-ground) whereas the crest value of the BIL (Basic Impulse Insulation Level) can be 20 kV to 40 kV depending of the type of system. The IEEE Std do not show any value for systems whose maximum voltage go from 3.6 kV to 12 kV. So, the overvoltages to be calculated herein will be compared with the values given by the IEC Standards.
Because systems under 36 kV are particularly prone to external aggressions, thus, to failure and face stresses in their insulation system (electrical stress), greater values of low-frequency short-duration overvoltages are allocated upon them (more than twice the rms maximum phase-to-phase voltage, Vm).
Clearly, the values of BIL (Basic Impulse Insulation Level) for this range of voltages are higher, offering additional protection to BSL (Basic Impulse Switching Level) overvoltages. Also, switching overvoltages are

Table 1. BSL and BIL voltages for low voltage systems [10] .
normally proportional to the system operating voltage; thus, one can expect that these BSL overvoltages would be low, that is why at these voltage levels BSL values are less crucial than BIL values [10] .
Additionally, it is well established that in systems above 245 kV the BSL overvoltages are a key factor to be considered, whereas in systems with lower voltages the values of BIL are more important than BSL (IEEE Std C62.82.1 [11] ).
4. Simulation Results
In order to analyse the referred overvoltages the fault types previously mentioned were assumed to occur at Bus 1 (see Figure 1). The fault is initiated at t = 22.5 ms and kept for the rest of the simulation time. Also, so as to simulate the worst conditions, a fault resistance equal to 0.001 W, was used. The following are the results obtained in the simulations.
4.1. Line-to-Ground Fault
One of the premises of the specific microgrid considered is that its short-circuit current should be limited to relatively low values (less than 4 kA). Thus, the star-connected side of all three transformers were grounded through a 39.8 W resistance. Figure 2(a) shows that with this grounding resistance the fault current measured at Bus 1 is limited to 3.2 kA (peak).
As an extra comment, the reduction of this resistance to a low value (e.g. 0.398 W) gave a fault current (peak value) equal to 8.74 kA, as shown in Figure 2(b). From these preliminary simulations conducted it can be stated that low values of the limiting resistance gives place to high fault currents but lower overvoltages. Contrarily, higher values of the limiting resistance produces lower fault currents but gives place to higher overvoltages. Unless otherwise specified, all the overvoltage results shown below will consider the reduced fault current mentioned, i.e. the transformers were grounded through a 39.8 W resistance. Note that both fault currents have a small dc offset component.
In Figure 3, the line-to-ground voltage of the sound phases (A and B) is shown. The voltage increase in these phases is about 1.7 times the pre-fault voltage. So, the rms phase-to-phase overvoltage in phases A and B will be approximately . This value is well below the low-frequency short-duration over- voltage considered by IEC in Table 1 (10 kV).

Figure 2. Fault currents measured: (a) RTransf = 39.8 W; (b) RTransf = 0.398 W.

Figure 3. Voltages measured at Bus 1 (phases A and B) during the line-to- ground fault.
4.2. Line-to-Line Fault
As expected, the fault current within the involved phases are high (first peak = 15.4 kA at phases B and C) but no overvoltage in the sound phase (phase A) was observed. Therefore, this type of fault, in terms of overvoltage, offers no hazard to the microgrid system.
4.3. Line-to-Line-to-Ground Fault
In this case, phases B and C make contact to ground. Although the initial peak fault current in both faulty phases reached values of up to 15 kA, the overvoltage in the sound phase (VBus 1A = 2.84 kV) is not as high as in case 4.1. The rms phase-to-phase overvoltage at phase A was approximately  (Figure 4).
4.4. Broken Conductor
The broken conductor condition in low-voltage systems may occur due to various causes ranging from vandalism, attempt to conductor robbery, phase conductor rupture due to large vehicles carrying high loads, etc. The fault current, thus, the overvoltages arising from this condition, depend on the type of soil upon which the overhead conductor falls. Highly resistive soils (e.g. rocky terrain, dry asphalt surfaces, etc.) will give place to low fault currents. Conversely, low resistive soils such as clay, silt or humid soil will drain large currents to the ground.
The broken conductor analysis was applied on the segment where the overhead line lies (i.e. segment between the SHG transformer and the LCC component at phase C). It is assumed that the ground has a relatively low resistance (with a ground resistivity equal to 500 W-m). It is also assumed that both ends of the broken conductor fall to ground simultaneously. The peak voltage measured right after the occurrence of the fault (phase B) was equal to 3.27 kV (close to the case presented in Section 4.1) which gives an rms phase-to-phase voltage of Vrms_A = 3.27* = 4.0 kV (Figure 5). From Figure 6, it can be seen that at Bus 1 lower voltages than those presented in Figure 5 appear. Thus, no stressing voltages capable to damage the components immediately around Bus 1 are present.
4.5. Line-to-Ground Fault at No-Load
One of the most detrimental conditions, in terms of creating harmful overvoltages, is the fault occurrence during no-load conditions. This is because during a fault the load still absorbs part of the system current, which otherwise would go to feed the fault. This condition was also simulated in the analysed microgrid (phase C as faulted

Figure 4. Voltages measured at Bus 1 (phase A) during the double-line-to-ground fault.

Figure 5. Voltages measured near the OHTL between the transformer and the OHTL (broken conductor case).
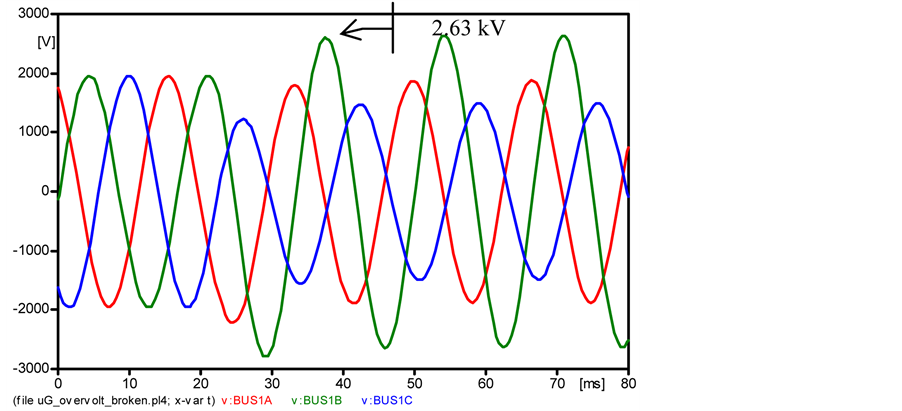
Figure 6. Voltages measured at Bus1 for the broken conductor condition.
phase). To do so, all the passive loads (Loads 1, 2 and 3) were removed and simulated a fault at Bus 1. The peak voltage measured at phase B (see Figure 7) was equal to 3.57 kV, which gives an rms phase-to-phase voltage equal to Vrms_A = 3.57* = 4.4 kV.
In a further analysis, the constant power loads (Load 1, 2 and 3) shown in Figure 1 were replaced by equivalent synchronous motors with nearly the same active power. Due to its intrinsic nature, the reactive power of a motor will be somewhat larger than that of its equivalent constant power load. Recall that in the case of motor models, parameters like the direct and quadrature reactances as well as the transient and subtransient time constants, among other variables, have to be specified.
During fault periods the system voltage drops, in an effort to restore this voltage the rotating magnetic field of the rotor behaves like a power source; thus, providing some additional current to the motor stator, thus, to the system.
According to [12] , depending on their size and capacity, the contribution of induction motors typically last from 1 to 4 cycles once the fault is initiated. The contribution of synchronous motors can last from 6 to 8 cycles. The main difference for this time duration is the presence of the excitation system in synchronous motors, which induction motors do not have; hence, the use of synchronous motors in this analysis.
Due to space limitations the graphic results of this analysis are not included but only the steady-state peak overvoltages. A summary of such results as well as the overvoltages obtained with constant power loads are presented in Table 2. Note that overvoltages obtained using dynamic loads are higher than those using constant power loads. This is due to the contribution of the motors to the fault current thus worsening the bus voltage in the healthy phases.
In the absence of dynamic loads (motors), the use of constant power loads to provide the worst scenario is sometimes preferred. This is because with constant power loads whenever the bus voltage drops the current increases which can further reduce the bus voltage, which may eventually lead to voltage collapse or to any destabilising effect.
Another issue of concern was to observe if the installation of a surge arrester at Bus 1 would help to reduce the above overvoltages (i.e. case with synchronous motors). A priori, due to the relatively low overvoltages attained, it can be inferred that a surge protector device for this overvoltages will not have any effect, but this should be confirmed after performing the respective simulations. The characteristics of the commercial surge arrester installed are also presented in Appendix.
As expected, after conducting the simulations no effect upon these overvoltages was observed. The reason for that is that for this low voltage arrester the lowest phase-to-ground voltage of its VxI curve (30/60 ms wave front, regularly used in low-frequency surges) is equal to 6.2 kV. Therefore, voltages below this value, which is the case of the analysed microgrid, will not be cut by the arrester. Still, this same surge arrester will be essential to cut off overvoltages produced by lightning whose values are much greater than the ones obtained in this article.
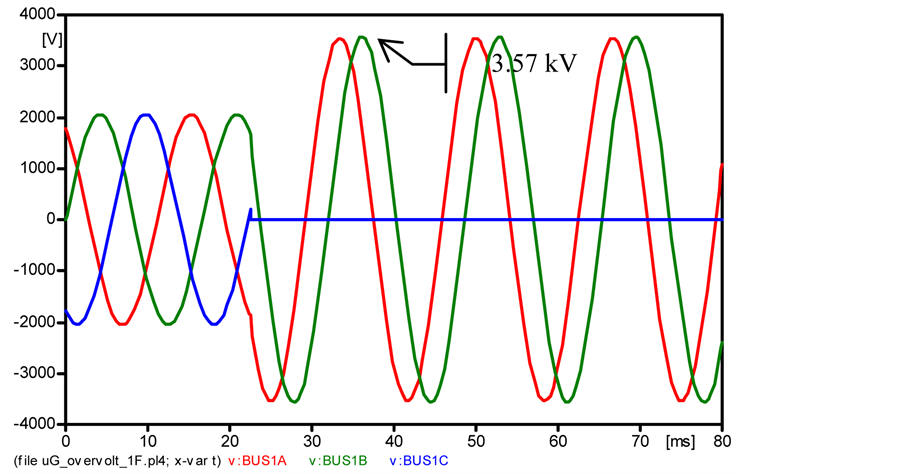
Figure 7. Voltages measured at Bus 1 during the line-to-ground fault at no-load.
Table 2. Overvoltages measured at Bus 1 for both constant power loads and their equivalent values with synchronous motors.
(A)at phase A; (B)at phase B; (O)at phase B near OHTL.
5. Conclusions
From the above results, it can be stated that overvoltages stemming from internal faults are well below the low-frequency short-duration withstand voltages (phase-to-ground) established for the 3.6 kV maximum system voltage by the IEC standards.
Overvoltages due to internal faults considering dynamic loads (synchronous motors) within the 2.4kV microgrid exhibite values somewhat higher than the overvoltages obtained under the presence of constant power loads. Still, no significantly high values close to the low-frequency short-duration overvoltages established by IEC are found. Briefly, no dangerous overvoltages capable to exceed the BSL or BIL of the specific microgrid are found. Such overvoltages refer to sustained voltages appearing in the sound phases during phase-to-ground faults.
Cite this paper
Ricardo LeonVasquez-Arnez,Dorel SoaresRamos,Tesoro Elena Del CarpioHuayllas, (2015) Overvoltage Condition Assessment of a Microgrid Due to Faults Occurring in the Islanded Mode of Operation. Energy and Power Engineering,07,525-534. doi: 10.4236/epe.2015.711049
References
- 1. Shuiming, C. and Hongqiao, Y. (2010) A Review on Overvoltages in Microgrid. 2010 Asia-Pacific Power and Energy Engineering Conference (APPEEC), Chengdu, 28-31 March 2010, 1-4.
- 2. Yang, W., Peng, Z., Li, W.Y., Xiao, W.D. and Adollahi, A. (2012) Online Overvoltage Prevention Control of Photovoltaic Generators in Microgrids. IEEE Transactions on Smart Grid, 3, 2071-2078.
http://dx.doi.org/10.1109/TSG.2012.2222679 - 3. Pokharel, S.P., Brahma, S.M. and Ranade, S.J. (2012) Modeling and Simulation of Three Phase Inverter for Fault Study of Microgrids. North American Power Symposium (NAPS), Champaign, 9-11 September 2012, 1-6.
http://dx.doi.org/10.1109/naps.2012.6336325 - 4. Franklin, A., Yan, R.F. and Saha, T.K. (2013) Investigation of a Micro-Grid Operation: A Case Study of Heron Island Network (Australia). 2013 Australasian Universities Power Engineering Conference (AUPEC). Hobart, 29 September-23 October 2013, 1-6.
http://dx.doi.org/10.1109/AUPEC.2013.6725422 - 5. Hongqiao, Y., Shuiming C. and Yang, P.C. (2010) Study on Transferred Lightning Overvoltage in Microgrid. 2010 Asia-Pacific Symposium on Electromagnetic Compatibility (APEMC), Beijing, 12-16 April 2010, 1550-1553.
http://dx.doi.org/10.1109/apemc.2010.5475606 - 6. Vasquez-Arnez, R.L., Ramos, D.S. and Del Carpio-Huayllas, T.E. (2014) Microgrid Dynamic Response during the Pre-Planned and Forced Islanding Processes Involving DFIG and Synchronous Generators. International Journal of Electrical Power & Energy Systems, 62, 175-182.
- 7. PSCAD/EMTDC Program, Manitoba HVDC Research Center, v.4.3.1.0 (x4), 2010. https://hvdc.ca/pscad/
- 8. Alternative Transients Program (ATPDraw). v 5.5, 1998-2007.
http://www.atpdraw.net/ - 9. Sarma, M.S. (1994) Electric Machines: Steady-State Theory and Dynamic Performance. 2nd Edition, PWS Pub. Co., Boston.
- 10. Hase, Y. (2007) Handbook of Power System Engineering. John Wiley & Sons Ltd, England, 451-452.
http://dx.doi.org/10.1002/9780470033678 - 11. (2010) IEEE Std C62.82.1?-2010, IEEE Standard for Insulation Coordination-Definitions, Principles, and Rules.�
- 12. Broussard, D.G. (2013) Understanding Short Circuit Motor Contribution. Vector, 45.
http://www.ee.co.za/wp-content/uploads/legacy/Vector%202013/vector_june2013_ge.pdf
Appendix
Details of the cables, overhead line and surge arrester data used.
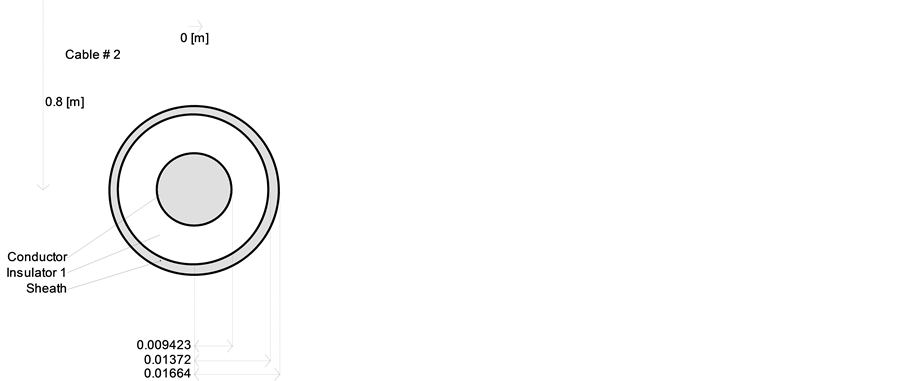
Figure A1. Details of the cale used.

Figure A2. Dimensions of the overhead distribution line used.
Table A1. Surge arrester data.
All other data used in this article can be willingly sent upon request.