Energy and Power Engineering
Vol.6 No.9(2014), Article
ID:49553,9
pages
DOI:10.4236/epe.2014.69019
Solar Driven Wind Speed Monitoring System Using Wireless or Wired Sensors
Federico Hahn, Mauricio Pablo, José Reyes
Department of Irrigation, Universidad Autonoma Chapingo, Texcoco, México
Email: fhahn@correo.chapingo.mx
Copyright © 2014 by authors and Scientific Research Publishing Inc.
This work is licensed under the Creative Commons Attribution International License (CC BY).
http://creativecommons.org/licenses/by/4.0/


Received 29 June 2014; revised 31 July 2014; accepted 11 August 2014
ABSTRACT
Instrumented towers are being constructed to characterize vertical wind profiles in order to improve the understanding and characterization of a desired environment up to 100 m. The site being measured is at a height of 2500 m over sea level, in one side of Sierra Madre Oriental, which crosses Mexico from North to South. As the site has no energy, it was powered by a photovoltaic system. Power consumption of two sets of sensors fixed at the tower was evaluated. The first sensor set consisted of a pulsed anemometer and a RH sensor having a 0 - 10 V output; these sensors used cables for transmitting the output signals. Three cup anemometers fixed at 25, 35 and 45 m high measured wind speed. Wireless sensors in the second set, requires of a power consumption and battery life study. Solar cells energized the sensors, becoming the installation and operation easier. The datalogger that acquired the RH and T measurements encountered an 11% voltage loss throughout the cable; cup anemometer measurements did not show variations due to its pulsed signals. Wireless sensors drew less energy from the PV system, resulting in battery overcharge. A dump regulator turned-on a 200 W lamp during the night when the battery voltage reached 14 V; the lamp was turned-off when the battery voltage felt beneath 11.5 V. Considering the high wind available, wireless sensors batteries were charged by small wind turbines combined with 5 W solar panels.
Keywords:Wind Tower, Wireless Anemometers, Battery Regulator

1. Introduction
Wind has been used to commercially produce energy in North America since the early 1970s and is one of the most rapidly growing sectors of the energy industry [1] . Wind turbines generate electricity without many of the negative environmental impacts associated with other energy sources (e.g., air and water pollution, greenhouse gas emissions associated with global warming and climate change). Towers are used as platforms to characterize vertical profiles of wind conditions within 200 m of the ground, which is the layer in which wind turbines operate. Measurements are done to improve the understanding and characterization of the desired environment and wind speed data are recorded for a period of one year. Air quality monitoring programs for uranium mines and mills [2] also use 200 m towers and EPA [3] recommend monitoring for hourly average wind speed, wind direction, vertical wind speed, temperature, temperature gradient, relative humidity, solar radiation and precipitation.
There are currently two technologies being used for wind farm site evaluations and for installed turbine monitoring. The first is point measurements on a vertical mast and the second remotely senses wind speed from an instrument placed on the ground [4] . The quality of remote sensing instruments is generally judged by performing an inter-comparison experiment [5] ; wind speed and direction are measured at several heights by cup anemometers on a mast together with measurements by a remote sensing instrument where a number of sampling volumes are centered on the same heights as the mast measurements. Differences between winds measured by mast sensors and remote sensors can arise from a number of causes. For example differences exist when remote sensing takes place in presence of background noise or when differences between scalar (cup-type) and vector component (remote-type) measurements over spatially distribute volumes [5] .
A wireless sensor network [6] [7] is a collection of distributed sensors that monitor environmental conditions and cooperatively pass their data wirelessly to a central hub. Wireless sensor networks (WSN) are advantageous over RFID technologies in many ways as WSN enables long range communication over multi-hop networks, scattering the communicatory energy consumption among the tags; wireless sensor networks offer more flexible coverage than RFID technologies. Using the technology available today, a typical wireless node consumes from 50 mW to 90 mW of power when both the radio and the microcontroller are in the active mode. Radio transmission and reception are the higher power consumption systems for two popular wireless sensor nodes [8] . The radio of a MICAz consumes as much as 59.1 mW of power in the RX mode. The energy source that offers the best potential for harvesting is direct outdoor sunlight (at a rate of 37 mW); this rate is still well below the wireless sensor nodes full operational power requirements of 83.1 mW in MICAz. In order to reduce the energy consumption of the wireless sensor node to a level at which it can operate solely using harvested energy, a practical, ultra-low duty cycle communication protocol is required [9] . A wireless system could be combined with electrical, mechanical and environmental monitoring sensors to be a part of a remote, multi-panel, centralized plant monitoring, and control system. Data from the sensors are transmitted via wireless technology to a central monitoring station using satellite Internet [10] . Various performance monitoring systems consisting of sensors and other photo-operated devices like op-amp 741 circuitry, photo-transistors, photo sensors, etc., can be integrated and a PV module used to power them.
The power supply is usually the largest and most expensive component of the emerging wireless sensor nodes being also the limiting factor on the lifetime of the sensor node; replacing batteries in every device every year or two is simply cost prohibitive. Battery development challenges must maintain (or increase) its performance, while decreasing size; for example, at Oak Ridge National Laboratory a process is developed to deposit a primary thin film lithium battery onto a chip in the form of a traditional Volta pile [11] . Research is being carried out to substitute batteries by using ultra-capacitors [12] , hydrocarbon-based fuels [13] , micro heat engine-based power generation small systems [14] [15] and photovoltaic systems. Single crystal silicon solar cells exhibit efficiencies of 15% - 20% under high light conditions and are better suited to the spectrum of light available outdoors [16] . Lithium ion batteries are widely used for wireless applications [17] but many options may be mostappropriate for a given application and diverse energy harvesting systems should be considered. Remote monitoring of airplanes and turbines for aging, malfunction, defect and preventive maintenance uses wireless sensors with photovoltaic cells [18] -[21] .
Monitoring equipment in space, rivers, sea, ponds and remote sites require a power source without physical wires. Although batteries can be used for its sensor nodes, its great drawback is the short lifetime [22] . The energy in batteries will exhaust and the sensor nodes will die after a certain time. To make the system last longer solar energy is used to supply the energy for the sensor nodes. The advantage of solar energy over other forms of environmental energy is that the available solar energy can be predicted [23] allowing to plan and optimize the future sensing activity, in order to achieve a more sustainable operation. Many wireless systems have been applied successfully using solar energy in aquaculture [24] [25] . Buoy or bottom-anchored systems powered by solar energy provide long-term monitoring of water quality using integrated with multi-parameter water quality sensors [26] .
This paper uses a solar panel to supply energy for a datalogger and set of sensors composed of anemometers and RH at 25, 35 and 45 m sensors. Two different groups of sensors were used, one that transmit the information through a cable and another group of wireless sensors. A charger helps to avoid overcharge of the battery as the system fails when the battery voltage is higher than 15 V.
2. Methods
2.1. Sampling Tower and Sensors
The site where the tower was fixed was located at the coordinates 19˚27'11.8" north and 98˚48'12.61" west almost at the top of the “Sierra Madre Oriental” being the height 2820 m, Figure 1. The tower was constructed of triangular steel rods so that someone could go up and install the sensors measuring wind speed at three heights: 25 m, 35 m, and 45 m using cup anemometers, Figure 2(a).
Two different configurations were used to measure wind speed, temperature and relative humidity: normal sensors and wireless sensors. In the former configuration Novus RHT-WM sensors and 014 cup anemometers were employed to measure temperature, relative humidity and wind speed; temperature and RH measured values were obtained in a 0 - 10 V format and acquired every 30 seconds with a Hioki datalogger. The cup anemometer presented wind speed data in a pulsed format which was also sampled every 30 seconds by the same datalogger. Data stored in the datalogger was downloaded after one month to a computer. As the equipment was mounted in the field, a PV equipment was required to power the system.
A three-cup anemometer model 014 A [27] measured horizontal wind speed; rotation of the cup wheel opens and closes a reed switch at a rate proportional to wind speed. One cup anemometer was fixed at 25 m, another at 35 and the third one at a height of 45 m. A 15 volt power supply fed the anemometer and pulses were counted by a datalogger. Information arrived from the sensors through a 2-cable (AWG-10) surrounded with shield to avoid EMC noise. The NOVUS transmitter RHT-WM is a microprocessor based instrument that incorporate highaccurate and stable sensors whose readings are converted to linear 0 - 10 Vdc, Figure 2(b); HR and temperature are measured with this sensor. RH accuracy is 3% in the 20% - 80% HR range, with a repeatability of ±1% RH and stability lower than 1% per year [28] ; its response time is 4 seconds in slow moving air. The temperature can be measured between −40˚C and 120˚C, with accuracy better than ±1˚C from 10˚C to 40˚C. Temperature repeatability is of ±0.1˚C and its response time of 30 seconds.
The T24-WSS wireless wind speed sensor (Figure 2(b)) is built using 2.4 Ghz wireless technology and operates alongside any T24 device such as base stations, analogue output, GPRS data loggers and others. The device sleeps between transmissions to maximize battery life in the field having a wireless range of up to 200 meters. The wind speed sensor features a high quality 3-cup rotor pressed on a stainless steel shaft with rugged Delrin body and bronze Rulon bushings; it is housed in an IP65 case [29] . The output value of the anemometer comes pre-calibrated and can be configured to the user’s requirements; it measures in the 2.235 to 55.85 ms−1 range. Its
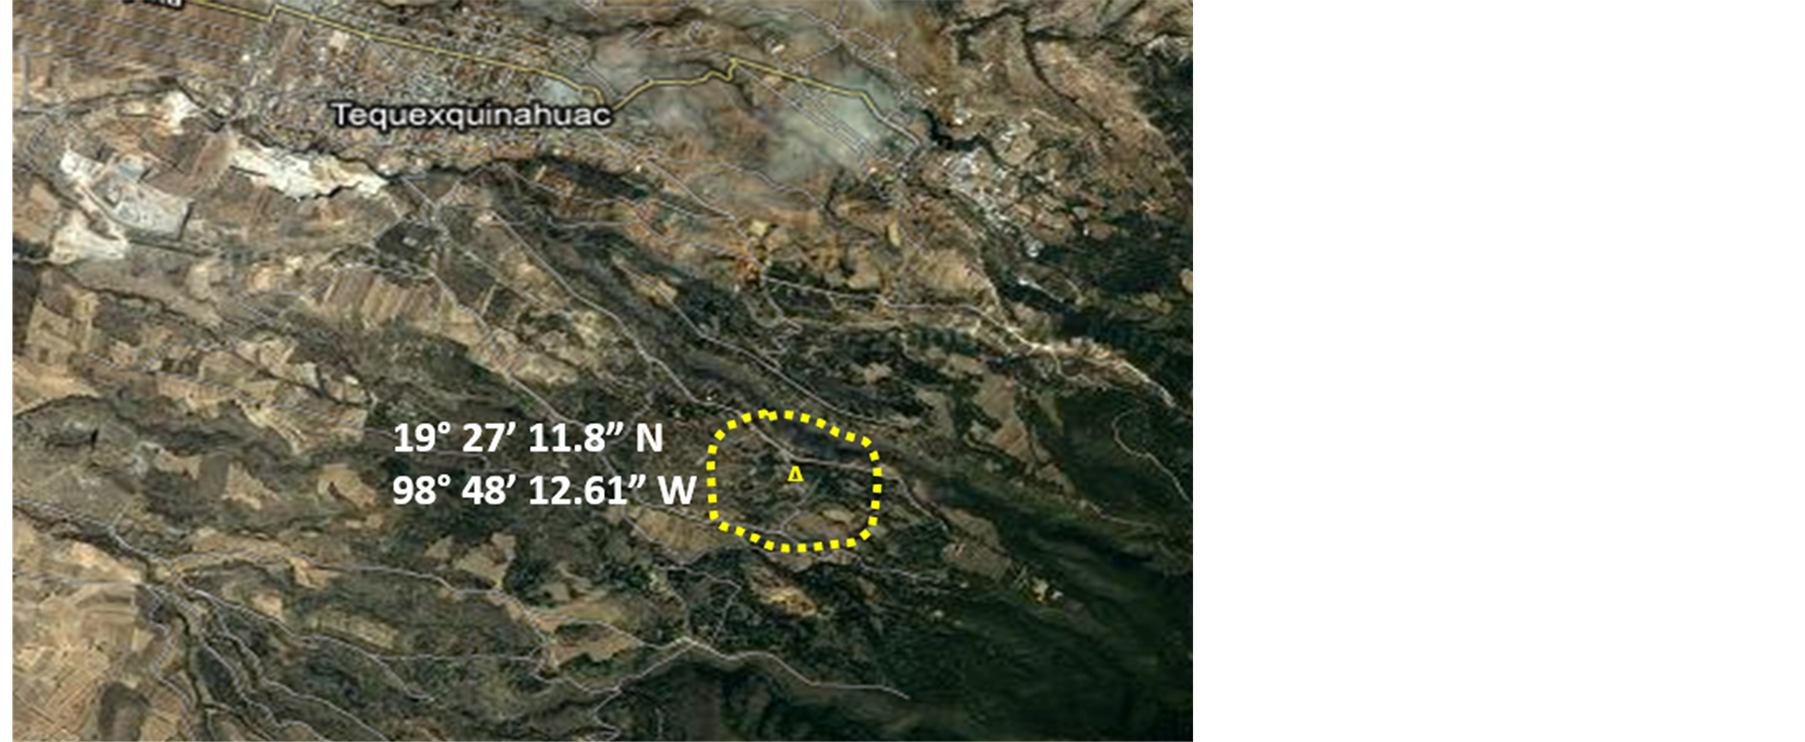
Figure 1. Place where the tower was installed.
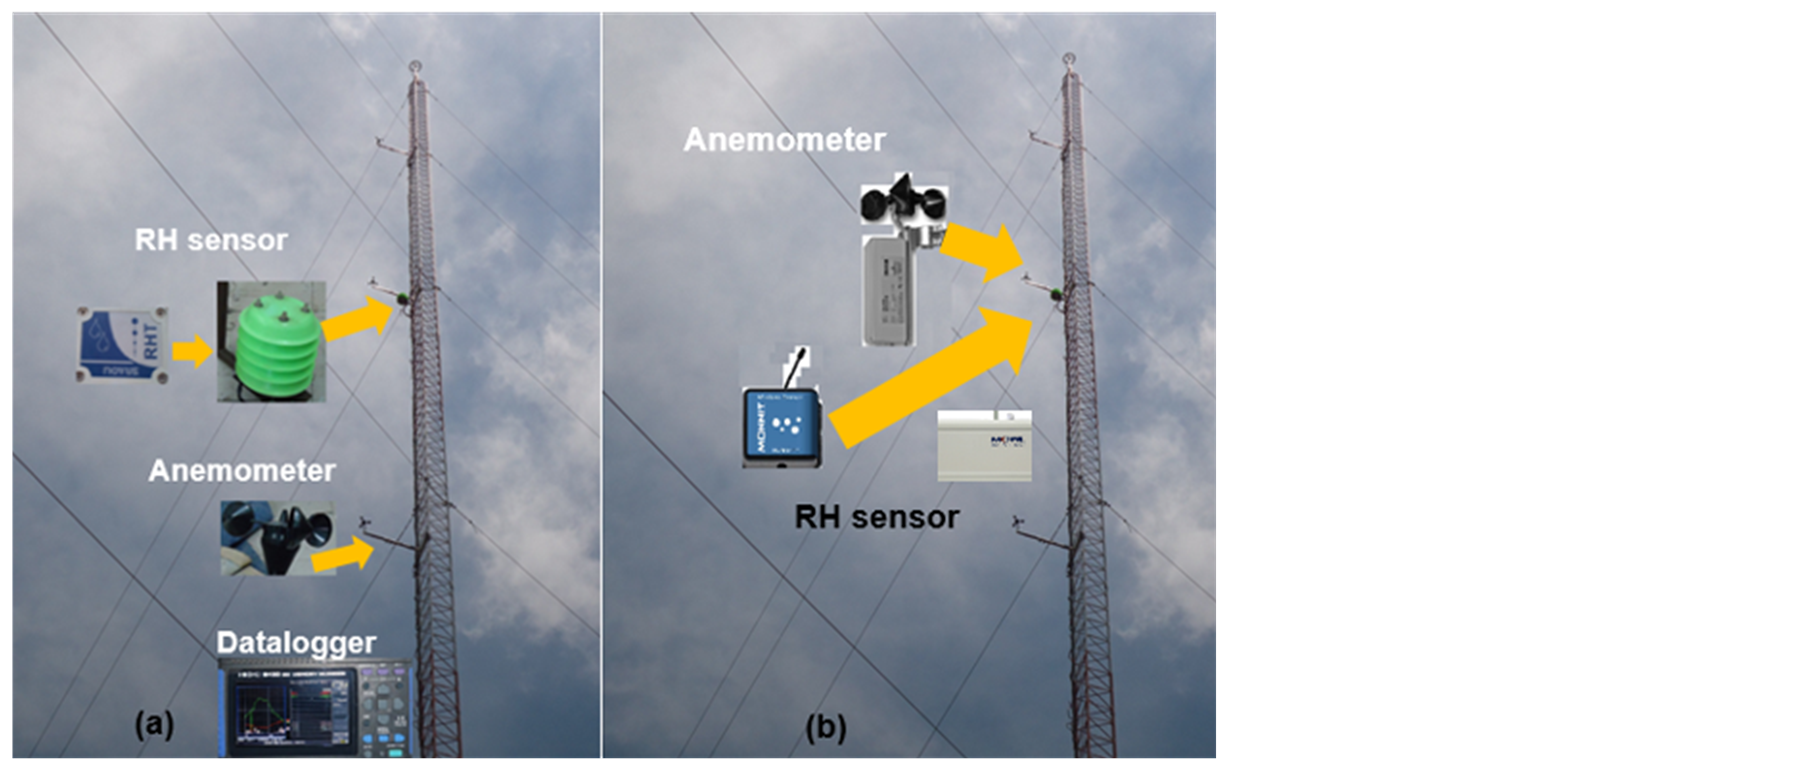
Figure 2. Tower monitoring RH, air speed and temperature with (a) cabled sensors and with (b) wireless sensors.
accuracy is 0.22 ms−1 from 2.2 to 4.46 ms−1 and ±4% from 4.46 to 55.85 ms−1. The T24-WSS is powered either from internal batteries or an external supply; a solar panel is used for applications when batteries cannot be substituted. Sample time should be 1 second for measuring wind speeds of 3 m/s. The T24-WSS is factory set to sample the anemometer every 5 seconds; running continuously the batteries in the module will last 1 month and 11 days (based on Duracell LR20 D Cells).
The wireless humidity (RH) sensor model MNS-9-RH (blue box in Figure 2(b)) has a 10 cm wire antenna, transmits up to 100 m at 900 or 433 MHz. The operating temperature ranges from −7˚C to 60˚C, being is accuracy of 0.7˚C in the 10˚C - 40˚C. Although the sensor can measure from 0 to 100% RH, the best RH accuracy of 2% is achieved in the 50% - 90% range; it increases to 3% in the 40% - 50% range and the 90% - 95% RH [30] . If every 12 bit measurement consumes 26.6 µA and is done and transmitted every minute the energy consumed per hour is 2.1 A obtained from (60 × (26.6 µA + 35 mA)); it will require 50.4 A per day (Table 1). The sensor is connected through a USB cable to a computer which has to be on. With a two LR20 D Duracell of 10 Ahr with 1 second interval it will last 8 days; for 5 second interval it will last 1 month.
In order to bring a Wi-Fi device compatible with the T24-WSS wireless wind speed sensor a MOWI sensor was used (white box in Figure 2(b)). The transmission rate is reduced as a datalogger is inside. It transmitted up to 75 m at 2.4 Ghz, and its power use during transmission and reception was 180 mA and 35 mA, respectively. It has an installed datalogger that can save up to 50,000 readings. Its accuracy is better than the MD016 being of 1.8% in the 10% - 95% RH [31] ; its response time is of 8 seconds. A measurement was taken every ten seconds and saved in datalogger. If every 10 minutes the data is transmitted, 1.080 A per hour will be consumed due to the transmission. If the 360 data are recorded per hour and sent every 6 hours, the consumed energy for transmission will be 180 mA; the entire day energy consumption will be 720 mA (Table 1).
2.2. PV System
The solar panel and battery size required by photovoltaic system depends on the total charge of the system, Figure 3. In the first system consisting of three pulsed anemometers and three NOVUS RHT-WM transmitters, the energy demand per day was 124 W. The datalogger Hioki 8430 used 10 VA during charging and the power supply that fed the anemometers used 15 VDC@ 0.5 A. If the power supply works 24 hours and the datalogger 5 hours a day, the total consumption of sensors, datalogger and power supply is 364 Watts per day. Considering a safety factor of 20% and a DC voltage of 12 V, the charge is 36.4 Ah. Considering 3 days of autonomy gives a total of 109.2 Ah. If the discharge factor DoD is 0.7 than the batteries will require to provide 156 Ah. A J198 Endurant deep cycle battery will provide 185 Ah. With 5 daily hours having an irradiation over 1000 Wm−2, it will require 3 panels of 50 W. As the solar panel was located at latitude of 19˚ the panel was fixed with a slope of 19˚.
The wireless system will not require any energy for the sensors and it will require a small laptop of 25 W

Table 1 . Different sensor energy consumed per day.
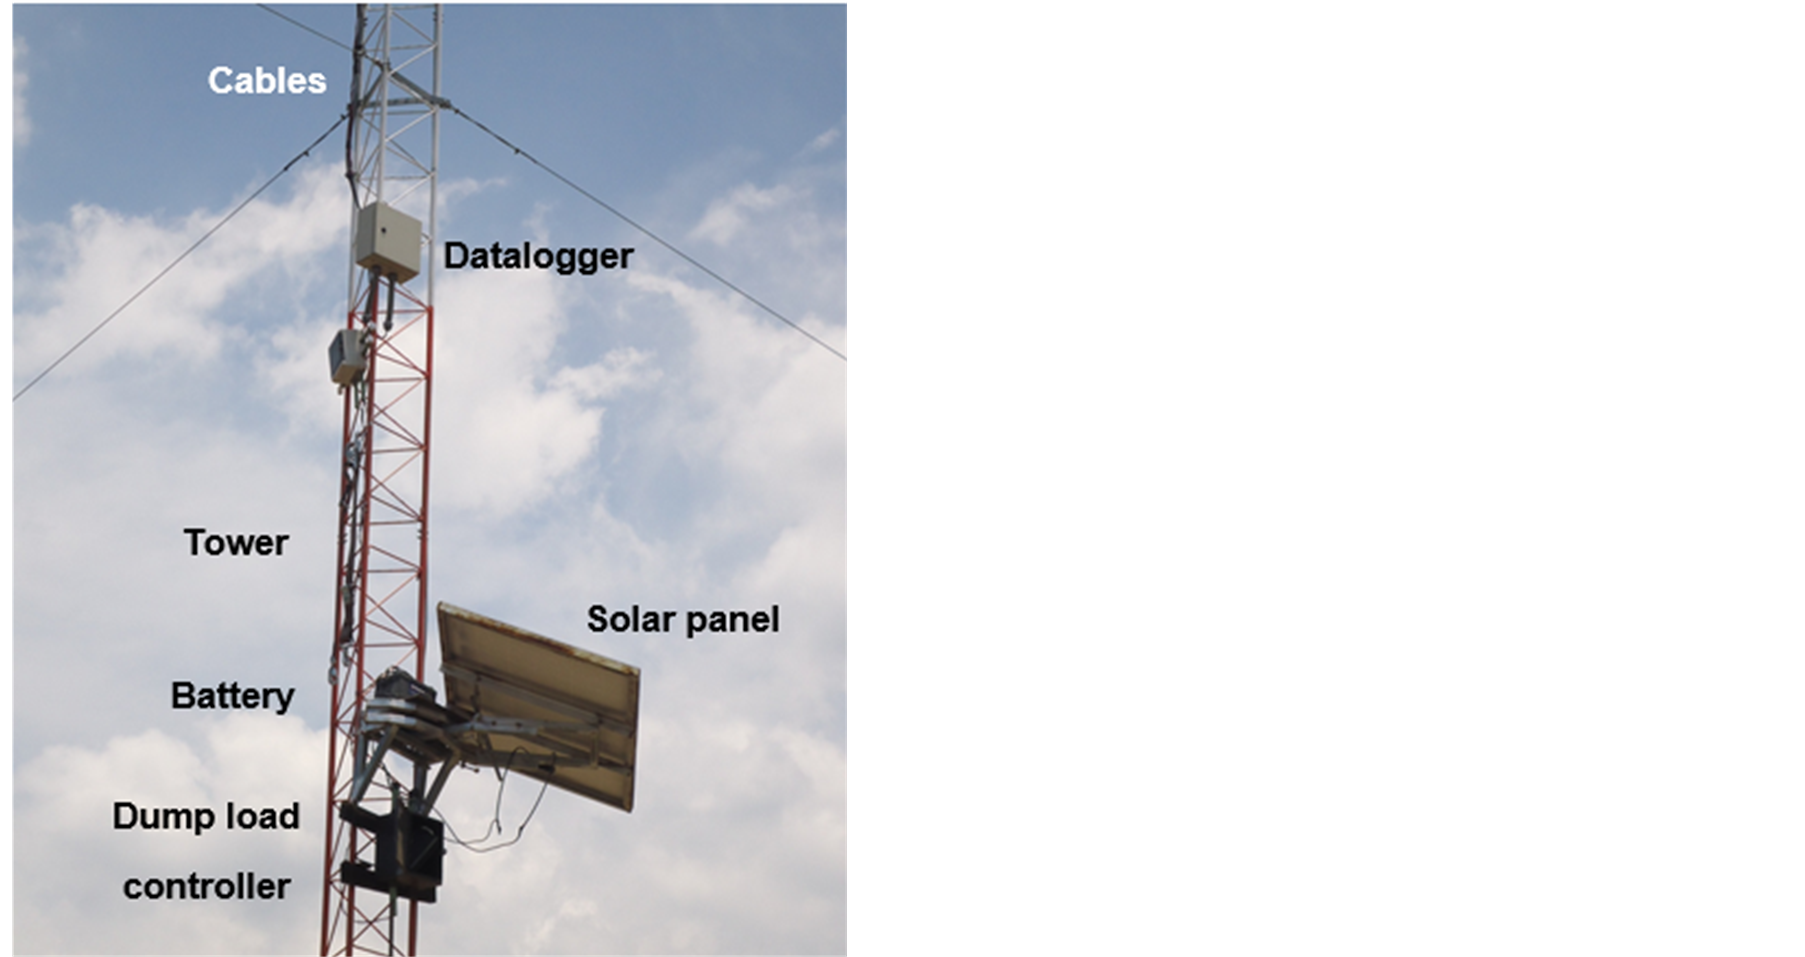
Figure 3. Photovoltaic system installed in the tower.
representing a daily consumption of 200 W, as it requires charging every 3 hours. The same system can be used and small panels feed each anemometer and RH MOWI.
3. Results
3.1. Sensor Operation
Sensors connected with cables worked well although cables present problems during installation. Cables were fixed with plastic strips and after two weeks the sun, rain and environmental conditions broke them down. The cable was fixed to the tower with nylamid rings avoiding damage and EMC noise in the measurements. As the distance from the higher Novus RHT-WM sensor to the Hioki datalogger was 40 m and the output was a DC voltage, a voltage loss was noted, representing a 11% lower RH than the one provided by the wireless sensor, Figure 4. Both type of anemometers provided good results, and pulses were not lost in the wired system. It can be noted in Figure 5 that wind speed is similar in height of 45 and 35 m. There appeared moments where speed was over 8 m at 25 m of height.
Wireless sensors are capable of collecting data instead of traditional cabled sensors, but do not function as exact replacements. Without wires, wireless sensors are often dependent on internally stored (battery) power for operation [32] . However, the batteries cannot be changed at 40 or 50 m high, so solar cells and small turbine generators were used. With wireless sensors the power consumption from the battery decreased and as a result the battery got overcharged and one day it didn’t work. It was necessary to develop an intelligent dump charger for the battery.
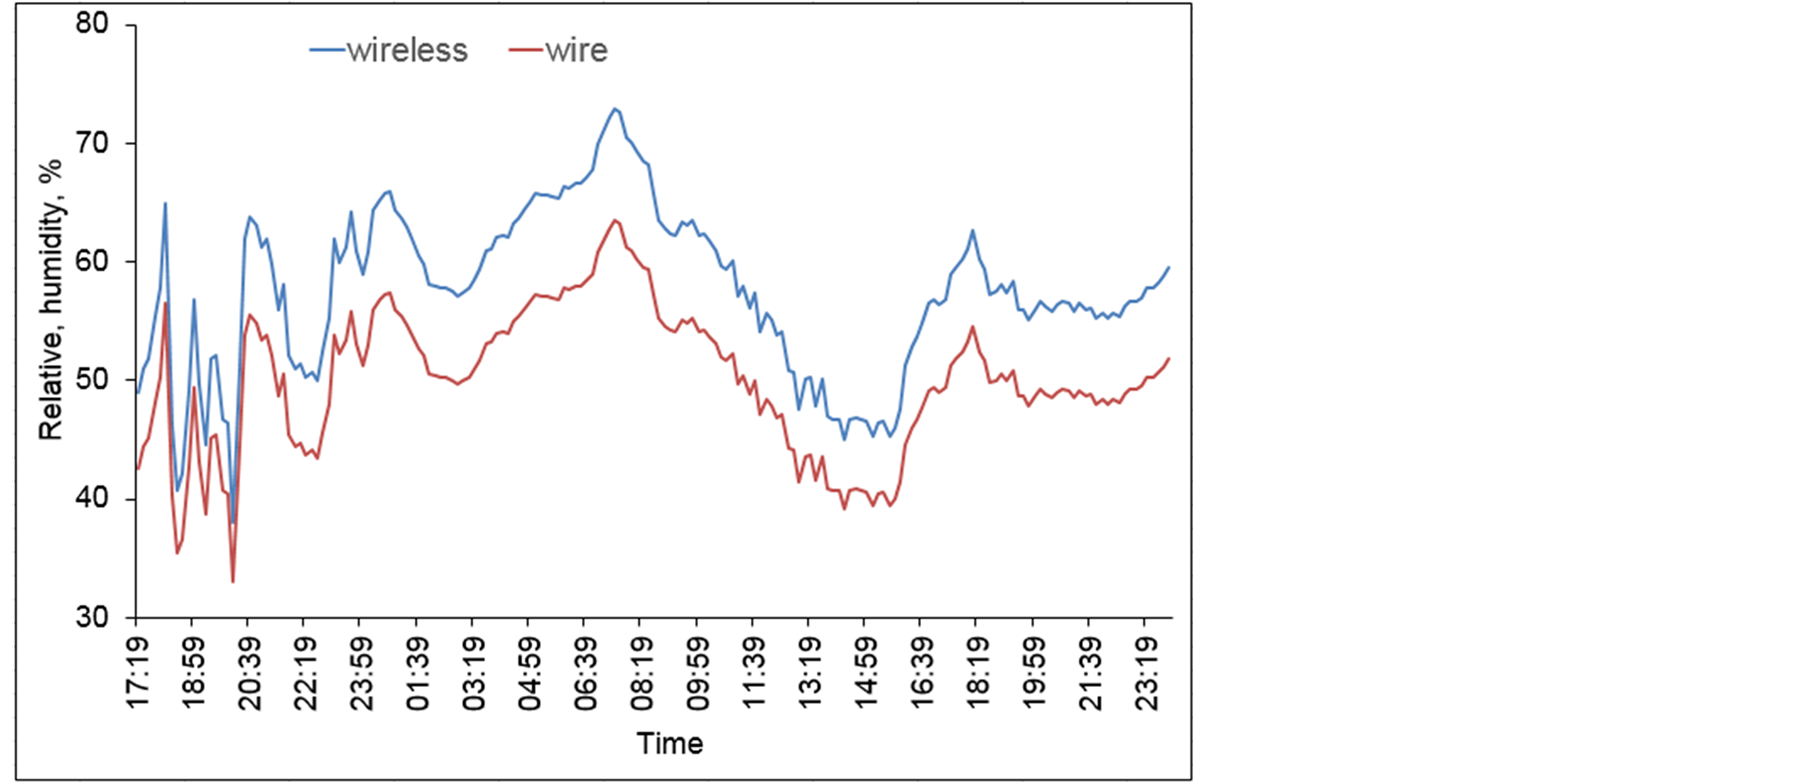
Figure 4. Relative humidity of wireless and wired sensors at the same height.
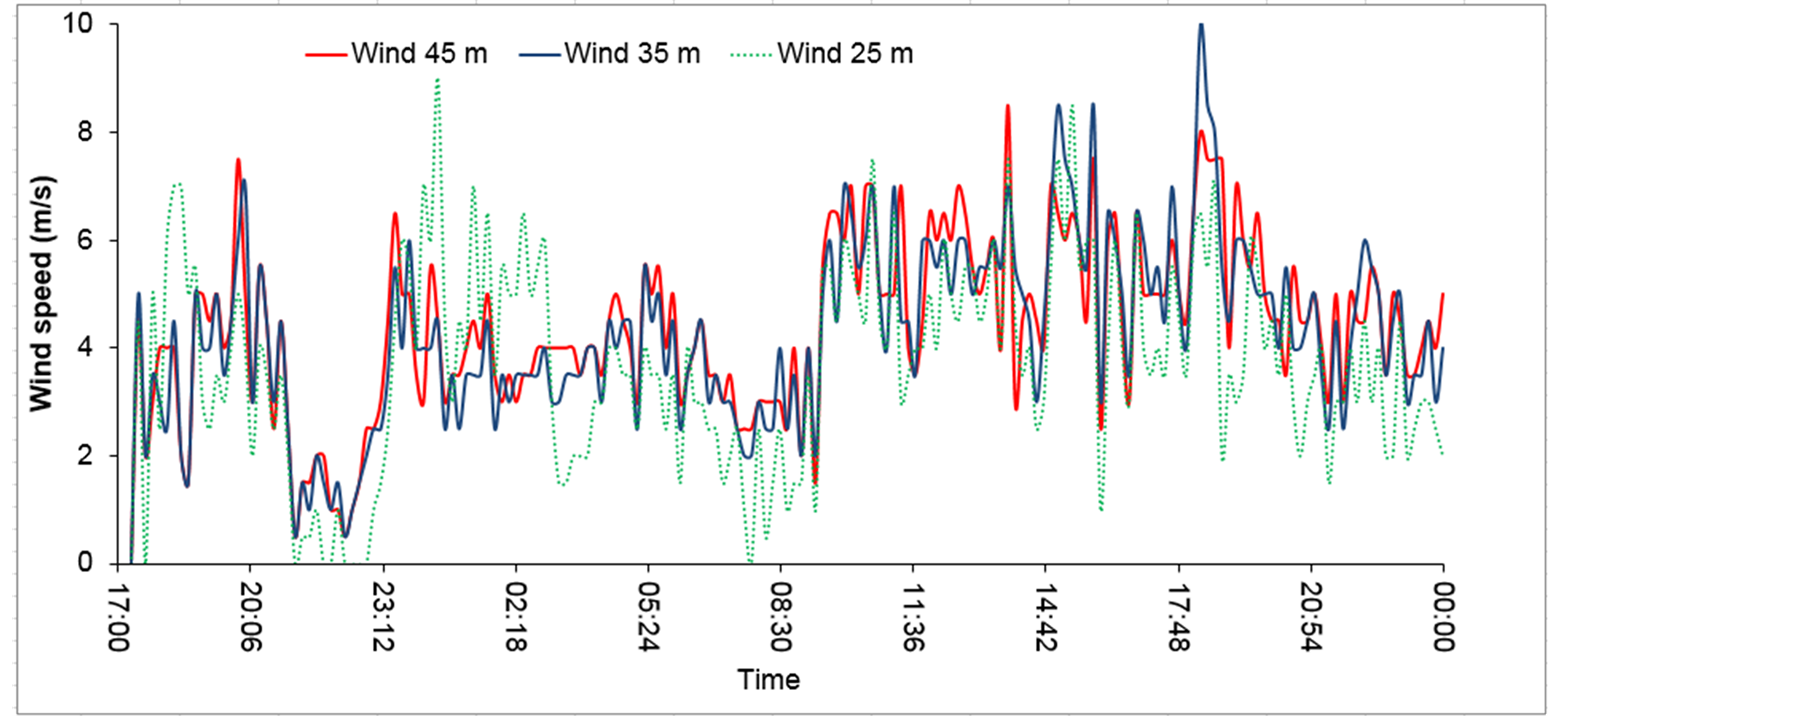
Figure 5. Wind speed measurement at different heights with the wireless sensors.
3.2. Battery Dump Controller
The controller maintained constant current to charge the battery, whose voltage varied from 11.5 to 15 V and the charging current from the solar energy systems fluctuated significantly. The battery lifetime can last several years if it is not discharged below 80% of the fully charged capacity, and that it is not overcharged more than 10%. The low cut-off voltage for the controller was 11.5 V, which for a new battery will be at 30% of the full charge capacity [33] . However, since the solar system will be continually charging the battery during the day when it is sunny, the cut-off 11.5 V should seldom be reached; at night battery discharges and the cut-off limit can be reached. A dump load consisting of a resistive element (lamp) capable of dissipating 200 W was installed to absorb the excess renewable energy and protect the batteries from overcharging. To implement the controller an ARDUINO MEGA based on an ATMEGA 2560 microcontroller was used. The block diagram of the system is shown in Figure 6.
When the voltage from the battery is over 14 volts, it turns on the 200 W lamps to discharge the battery. This operation lasts until it is 12.5 V at night and 11.5 V during the day. The difference is due to the recharge that is obtained by the solar panel during the day and the lack of charge left to acquire the data during the night. The solid state relay is more efficient than normal relays and can be fed with a voltage as low as 3 VDC. To detect day or night a photocell was used. The PV system used 150 W for three days of autonomy, meaning that with 50 W will be enough if all the days were sunny. In these areas almost 70% of the time is cloudy and sunny per periods, so it is needed to assure its proper operation.
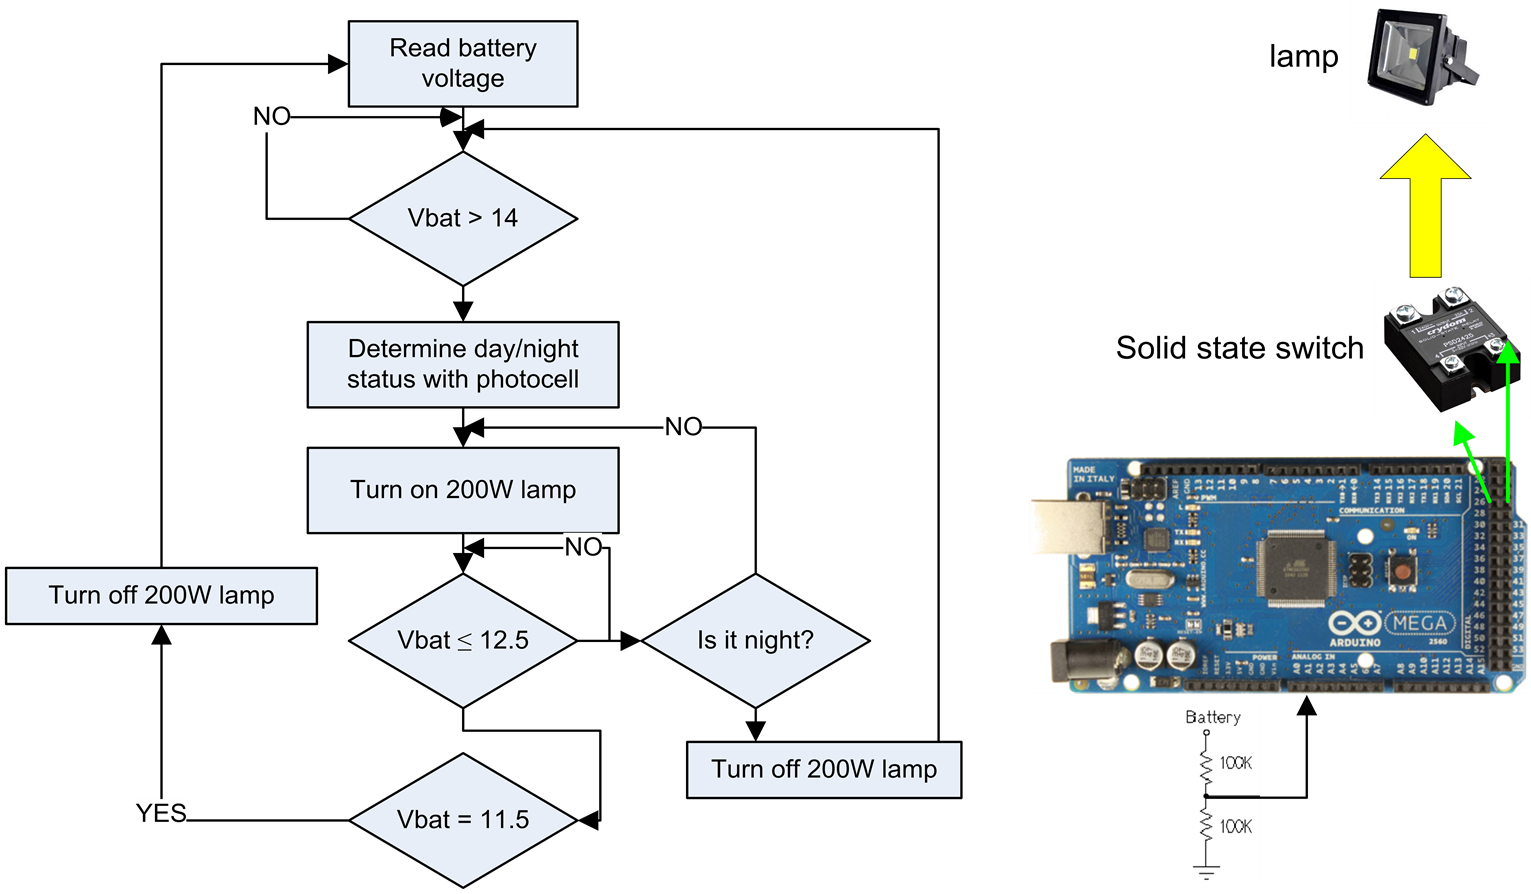
Figure 6. Block diagram and Arduino Mega connections.
Considering the high winds present during all day (Figure 5) fans were installed with a simple generator and were able to charge the batteries of the sensors instead of the 5 W solar cells. Both systems were used in order to avoid loss of information. Seven months have been monitored searching whether a wind turbine can be installed to supply energy to the University campus.
Wind monitoring towers have to be installed in places where no electricity is available. Even though PV power can be 5 - 10 times more expensive than grid power generated from hydropower generating plants, PV becomes more economical for remote customers. The costs to extend electrical lines from the grid are in the order of $27,000 per mile [34] , so photovoltaic systems become a reality. Hybrid photovoltaic ultra-capacitor sources has been designed theoretically and experimentally [35] . Although capacitors are more robust than batteries, the hybrid source should supply pulses. Super-capacitors offer a much higher power density than batteries because of their low equivalent series resistance (ESR); however, compared to batteries capacitors offer a lower energy density which makes them less suitable as single energy storing devices [23] . A typical super-capacitor offers more than half a million charge cycles and a 10-year operational lifetime until the capacity is reduced by only 20%; capacitors therefore require very little maintenance.
Harvesting of electrical energy from aphotovoltaic cell to power wireless sensors by means of super-capacitors is promising [36] . A single photovoltaic cell of reduced size provides the upstream current, and a predictive model is established to assess the amount of energy needed to power the wireless sensor. The number of cycles increases with the irradiance as the photovoltaic electricity production gets higher [37] . A small shift in the first cycle cumulates with the number of cycles due to the sensitivity to temperature of the storage capacitor [38] . The Bologna energy scavenger won’t charge until the capacitor reaches 2.5 V which is the maximum voltage allowed by the super-capacitor. When the capacitor voltage gets too close to the solar cell voltage, the latter drops and starts to follow the capacitor voltage with a constant voltage difference between them [23] . Energy from solar cells (SMH-8-0450) with an active area of 23 cm2 is stored in super-capacitors [39] . If the maximum power of the solar cell is 418 mW ± 10%, the time required to fully charge the super-capacitor will then be about 8 minutes and 8 seconds under ideal conditions (sunlight of 1 kW/m2). Current flow is configurable by the wireless node to charge the super capacitor or battery from solar energy as well as send power from the battery to the super capacitor for night operation [40] .
4. Conclusions
Solar energy was used to supply the requirements of a wind monitoring system composed of anemometers, RH and temperature. The tower measures wind speed and environmental variables at 25, 35 and 45 m. Initially, the tower had to be cabled in order to connect the sensors with the datalogger and the power supply. However, it was difficult to maintain the cable gripped to the tower due to the strong winds in the region; at the beginning trying to avoid noise due to EMC, plastic strips were added but rain and sun destroyed them. Later nylamid rings maintained the cable in the right position. Transmission of the voltage obtained from the RH sensors showed an 11% loss at the entrance of the datalogger, so measurements were not precise. The use of wireless sensors was practical consuming very little energy. The solar panels of the PV system overcharged the battery, so a dump charger having a 200 W lamp was designed. A hybrid system of a 5 W solar cell and a turbine generator assured energy at the sensing places. It will be very wise to replace the sensor batteries by a solar cell-capacitor interface.
References
- American Wind Energy Association (AWEA) (2006) Wind Power Outlook 2006. http://www.awea.org/pubs/documents/Outlook_2006.pdf
- USA Environmental Protection Agency (EPA) (2000) Meteorological Monitoring Guidance for Regulatory Modeling Applications. EPA-454/R-99-005.
- WRIGHT (2012) Uranium Study: Air Quality Monitoring Report. DEQ/DMME Contract No. EP881027. Wright Environmental Services Inc., 1-69.
- de Noord, M., Curvers, A., Eecen, P., Antoniou, I., J?rgensen, H.E., Pedersen, T.F., Bradley, S., von Hünerbein, S., Kindler, D., Mellinghoff, H. and Emeis, S. (2005) WISE Wind Energy SODAR Evaluation Final Report. EU Project NNE5-2001-297, ECN-C--05-044, 1-95.�
- Antoniou, I., J?rgensen, H.E., von Hünerbein, S., Bradley, S.G., Kindler, D., Warmbier, G. and de Noord, M. (2004) The Profiler Inter-Comparison Experiment (PIE). European Wind Energy Conference (EWEC), London, 22-25 November 2004.�
- Suriyachai, P., Roedig, U. and Scott, A. (2012) A Survey of MAC Protocols for Mission-Critical Applications in Wireless Sensor Networks. IEEE Communications Surveys & Tutorials, 14, 240-264. http://dx.doi.org/10.1109/SURV.2011.020211.00036
- Klaib, A.R., Shubair, R.M., Al-Qutayri, M.A. and Ng, J.W.P. (2011) An Overview of Localization Techniques for Wireless Sensor Networks. International Conference on Innovations in Information Technology, Abu Dhabi, 25-27 April 2011, 167-172.
- Crossbow (2012) Wireless Measurement System: MICAz. MICAz Data Sheet.
- Sudevalyam, S. and Kulkarni, P. (2011) Energy Harvesting Sensor Nodes: Survey and Implication. IEEE Communications Surveys and Tutorials, 13, 443-461. http://dx.doi.org/10.1109/SURV.2011.060710.00094
- Devabhaktuni, V., Alam, M., Depuru, S.S.,Green, R. C.Nims, D., and Near, C. (2013) Solar energy:Trends and enabling technologies. Renewable and Sustainable Energy Reviews, 19, 555-564. http://dx.doi.org/10.1016/j.rser.2012.11.024
- Bates, J., Dudney, N.J., Neudecker, B., Ueda, A. and Evans, C.D. (2000) Thin-Film Lithium and Lithium-Ion Batteries. Solid State Ionics, 135, 33-45. http://dx.doi.org/10.1016/S0167-2738(00)00327-1
- Simjee, F. and Chou, P.H. (2006) Everlast: Long-Life, Supercapacitor-Operated Wireless Sensor Node. Proceedings of the 2006 International Symposium on Low Power Electronics and Design, Tegernsee, 4-6 October 2006, 197-202.
- Holloday, J.D., Jones, E.O., Phelps, M. and Hu, J. (2002) Microfuel Processor for Use in a Miniature Power Supply. Journal of Power Sources, 108, 21-27. http://dx.doi.org/10.1016/S0378-7753(01)01011-4
- Schaevitz, S.B., Franz, A.J., Jensen, K.F. and Schmidt, M.A. (2001) A Combustion-Based MEMS Thermoelectric Power Generator. 11th International Conference on Solid-State Sensors and Actuators, Munich, 10-14 June 2001, 30- 33.
- Nielsen, O.M., Arana, L.R., Baertsch, C.D., Jensen, K.F. and Schmidt, M.A. (2003) A Thermophotovoltaic Micro-Generator for Portable Power Applications. 12th International Conference on Transducers, Solid-State Sensors, Actuators and Microsystems, Boston, 8-12 June 2003, 714-717.
- Randall, J.F. (2003) On Ambient Energy Sources for Powering Indoor Electronic Devices. Ph.D. Thesis, Ecole Polytechnique Federale de Lausanne, Switzerland.
- Corke, P., Valencia, P., Sikka, P., Wark, T. and Overs, L. (2007) Long-Duration Solar-Powered Wireless Sensor Networks. 4th Workshop on Embedded Networked Sensors, Cork.
- Yang, B. and Sun, D. (2013) Testing, Inspecting and Monitoring Technologies for Wind Turbine Blades: A Survey. Renewable and Sustainable Energy Reviews, 22, 515-526. http://dx.doi.org/10.1016/j.rser.2012.12.056
- Lynch, J.P. and Loh, K.J. (2006). A Summary Review of Wireless Sensors and Sensor Networks for Structural Health Monitoring. The Shock and Vibration Digest, 38, 91-130. http://dx.doi.org/10.1177/0583102406061499
- Ling, Q., Tian, Z., Yin, Y. and Li, Y. (2009) Localized Structural Health Monitoring Using Energy-Efficient Wireless Sensor Networks. IEEE Sensors Journal, 9, 1596-1604. http://dx.doi.org/10.1109/JSEN.2009.2019318
- Hyers, R., McGowan, J., Sullivan, K., Manwell, J. and Syrett, B. (2006) Condition Monitoring and Prognosis of Utility Scale Wind Turbines. Energy Materials, 1, 187-203.
- Ishengoma, F. (2014) A Novel Design of IEEE 802.15.4 and Solar Based Autonomous Water Quality Monitoring Prototype Using ECHERP. International Journal of Computer Science and Network Solutions, 2, 24-36.
- Laurier, S. (2007) Experimental Analysis of Photovoltaic Energy Scavengers for Sensor Nodes. M.Sc. Thesis, Computer Engineering and Networks Laboratory, University of Ghent, Belgium.
- Han, S., Kang, Y., Park, K. and Jang, M. (2007) Design of Environment Monitoring System for Aquaculture Farms. 2007 Frontiers in the Convergence of Bioscience and Information Technologies, The Jeju Island, 11-13 October 2007, 889- 893.
- Shifeng, Y., Jing, K. and Jimin, Z. (2007) Wireless Monitoring System Foraquaculture Environment. IEEE International Workshop on RF Integration Technology, Singapore, 9-11 December 2007, 274-277.
- Lu, Y.L., Lin, C.Y. and Tsai, W.S. (2012) Application of Solar Wireless Sensor Network to Monitor Water-Quality in Cage Aquaculture Zone in the Inner Sea at Penghu. AFITA/WCCA 2012 Conference, Taiwan, 3-6 September 2012.
- Campbell Scientific (2009) Model 014A Met One Wind Speed Sensor Instruction Manual. Campbell Scientific Inc., Utah.
- Omni Instruments (2009) Humidity and Temperature Transmitter RHT-WM Operating Manual. Omni Instruments Inc., USA.
- Mantracourt (2009) T24-WSS Wind Speed Sensor (Anemometer). Zse Electronic Mess-Systeme & Sensortechnik Gmbh, Germany.
- Monnit (2012) Wireless Humidity (RH) Sensor. Monnit Corporation, Utah.
- Monnit (2013) Monnit Wi-Fi Humidity Sensor. Monnit Corporation, Utah.
- Swartz, R.A., Lynch, J.P., Zerbst, S., Sweetman, B. and Rolfes, R. (2010) Structural Monitoring of Wind Turbines Using Wireless Sensor Networks. Smart Structures and Systems, 6, 183-196. http://dx.doi.org/10.12989/sss.2010.6.3.183
- Vick, B.D., Clark, R.N., Ling, J. and Ling, S. (2003) Remote Solar, Wind, and Hybrid Solar/Wind Energy Systems for Purifying Water. Journal of Solar Energy Engineering, 125, 107-111. http://dx.doi.org/10.1115/1.1531148
- Martinez, T.M., Nelson, J.S. and Begay-Campbell, S. (2005) Remote Monitoring System Design-Sustainable Systems for the Navajo Tribal Utility Authority. Sandia National Laboratories, Albuquerque.
- Andreotti, A., Mottola,F., Pagano, M. and Velotto, G. (2008) Design Ofultracapacitor Based Filter for Isolated PV Source Feeding Pulsing Load. Electric Power Systems Research, 78, 1038-1046. http://dx.doi.org/10.1016/j.epsr.2007.08.003
- Bergonzini, C., Brunelli, D. and Benini, L. (2010) Comparison of Energy Intake Prediction Algorithms for Systems Powered by Photovoltaic Harvesters. Microelectronics Journal, 41, 766-777. http://dx.doi.org/10.1016/j.mejo.2010.05.003
- Logerais, P.O., Riou, O., Camara, M.A. and Durastanti, J.F. (2013) Study of Photovoltaic Energy Storage by Supercapacitors through Both Experimental and Modelling Approaches. Journal of Solar Energy, 2013, Article ID: 659014. http://dx.doi.org/10.1155/2013/659014
- Rafik, F., Gualous, H., Gallay, R., Crausaz, A. and Berthon, A. (2007) Frequency, Thermal and Voltage Supercapacitor Characterization and Modeling. Journal of Power Sources, 165, 928-934. http://dx.doi.org/10.1016/j.jpowsour.2006.12.021
- Sevcik, P. and Kovar, O. (2013) Power Unit Based on Supercapacitors and Solar Cell Module. 1st International Virtual Scientific Conference, Zilina, 10-14 June 2013, 468-471.
- Martino, M. and Varley, J. (2012) A Wireless Sensor Node Powered by a PV/Supercapacitor/Battery Trio. University of Toronto, Toronto. www.ti.com/corp/docs/university/docs/University_of_Toronto_Wireless_Sensor_Node_MatthewMartino_JordanVarley.pdf