Social Networking
Vol.3 No.2(2014), Article ID:43321,6 pages DOI:10.4236/sn.2014.32008
Using Luhn’s Automatic Abstract Method to Create Graphs of Words for Document Visualization
Faculdade de Tecnologia SENAI Cimatec, Salvador, Brazil
Email: luizclaudio@gmail.com, renelson.sampaio@fieb.org.br
Copyright © 2014 Luiz Cláudio Santos Silva, Renelson Ribeiro Sampaio. This is an open access article distributed under the Creative Commons Attribution License, which permits unrestricted use, distribution, and reproduction in any medium, provided the original work is properly cited. In accordance of the Creative Commons Attribution License all Copyrights © 2014 are reserved for SCIRP and the owner of the intellectual property Luiz Cláudio Santos Silva, Renelson Ribeiro Sampaio. All Copyright © 2014 are guarded by law and by SCIRP as a guardian.
Received November 15, 2013; revised December 17, 2013; accepted January 25, 2014
Keywords: Text Visualization; Graph of Words
ABSTRACT
Visualization methods for single documents are either too simple, considering word frequency only, or depend on syntactic and semantic information bases to be more useful. This paper presents an intermediary approach, based on H. P. Luhn’s automatic abstract creation algorithm, and intends to aggregate more information to document visualization than word counting methods do without the need of external sources. The method takes pairs of relevant words and computes the linkage force between them. Relevant words become vertices and links become edges in the resulting graph.
1. Introduction
Text mining and visualization have been given more attention lately due to the large and increasing volume of available documents, both physical and digital. The search for relevant information and the identification of patterns in unstructured data can be aided by understanding what a text is about, how it is structured and in which style it is written.
Single document mining and visualization may be difficult tasks depending on text length. Shorter texts provide less data to work on and lead to simpler results. There are two kinds of single document visualization methods. The first one comprises statistical methods, basically word counting; they are simpler but produce limited results. The other kind comprises more complex methods that use syntactic analysis and may need semantic-annotated vocabularies; those lead to better results [1].
The most known word frequency-based method for text visualization is the word cloud, also known as tag cloud. It was first adopted in so called “Web 2.0” sites as a way to highlight the words that were most used to tag posts or links. These words are shown in an image in font size directly proportional to their frequency in the text. A color scale may be used too.
Word clouds can also be used for single document visualization. In this case, tags will represent the most frequent words in the text. There are sites that let users create word clouds on-line. Figure 1 shows an example created with IBM Many Eyes [2] and Figure 2 shows another one created with Wordle [3].
Another method adopted for single document visualization is the graph of words. As its name suggests, text is represented by a graph in which some words are selected as the vertices and the edges are traced between vertices that satisfy a given relation. It is also a simple method but brings more information than a word cloud. And although it is not as informative as a concept map [4], for example, which presents the meaning of the relationships between concepts, a graph of words can be created by unsupervised methods.
This article proposes the creation of graphs of words inspired by a well-known document summarization algorithm. This is a development of a previous work [5] presented at the first Brazilian Workshop on Social Network
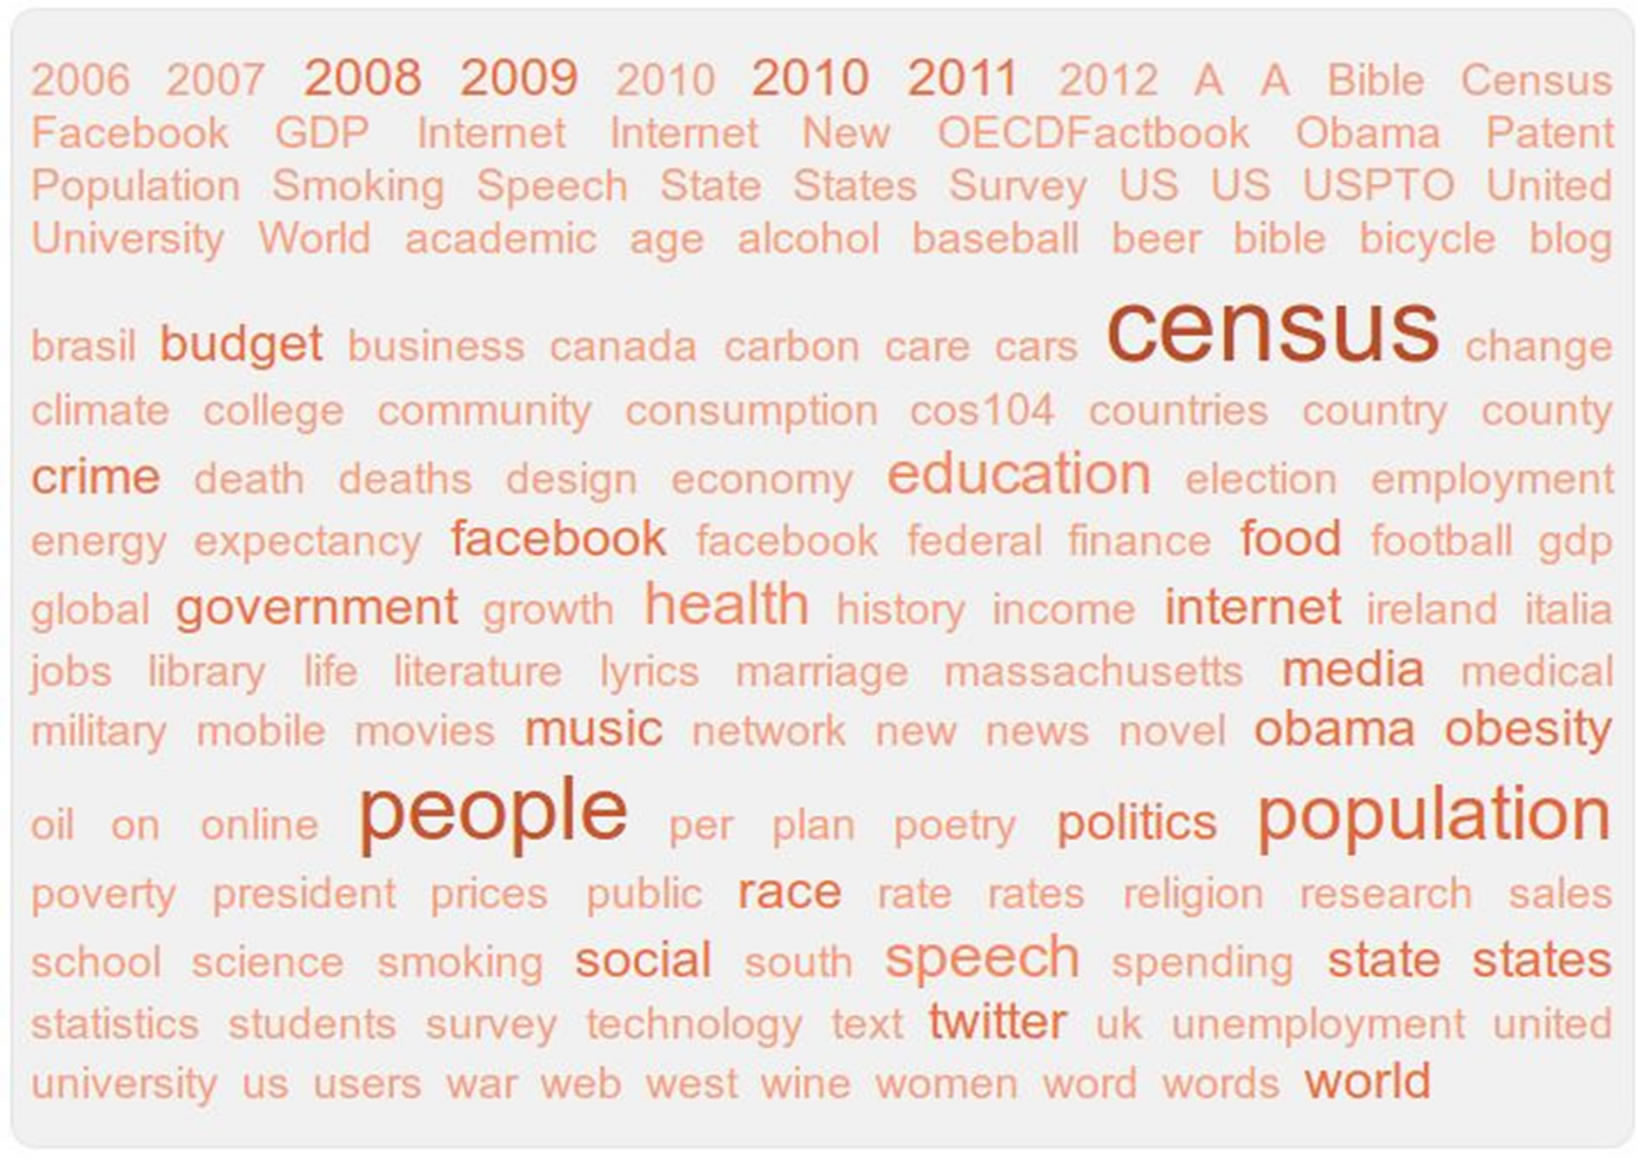
Figure 1. Word cloud showing the most used tags in IBM research many eyes data sets [2].
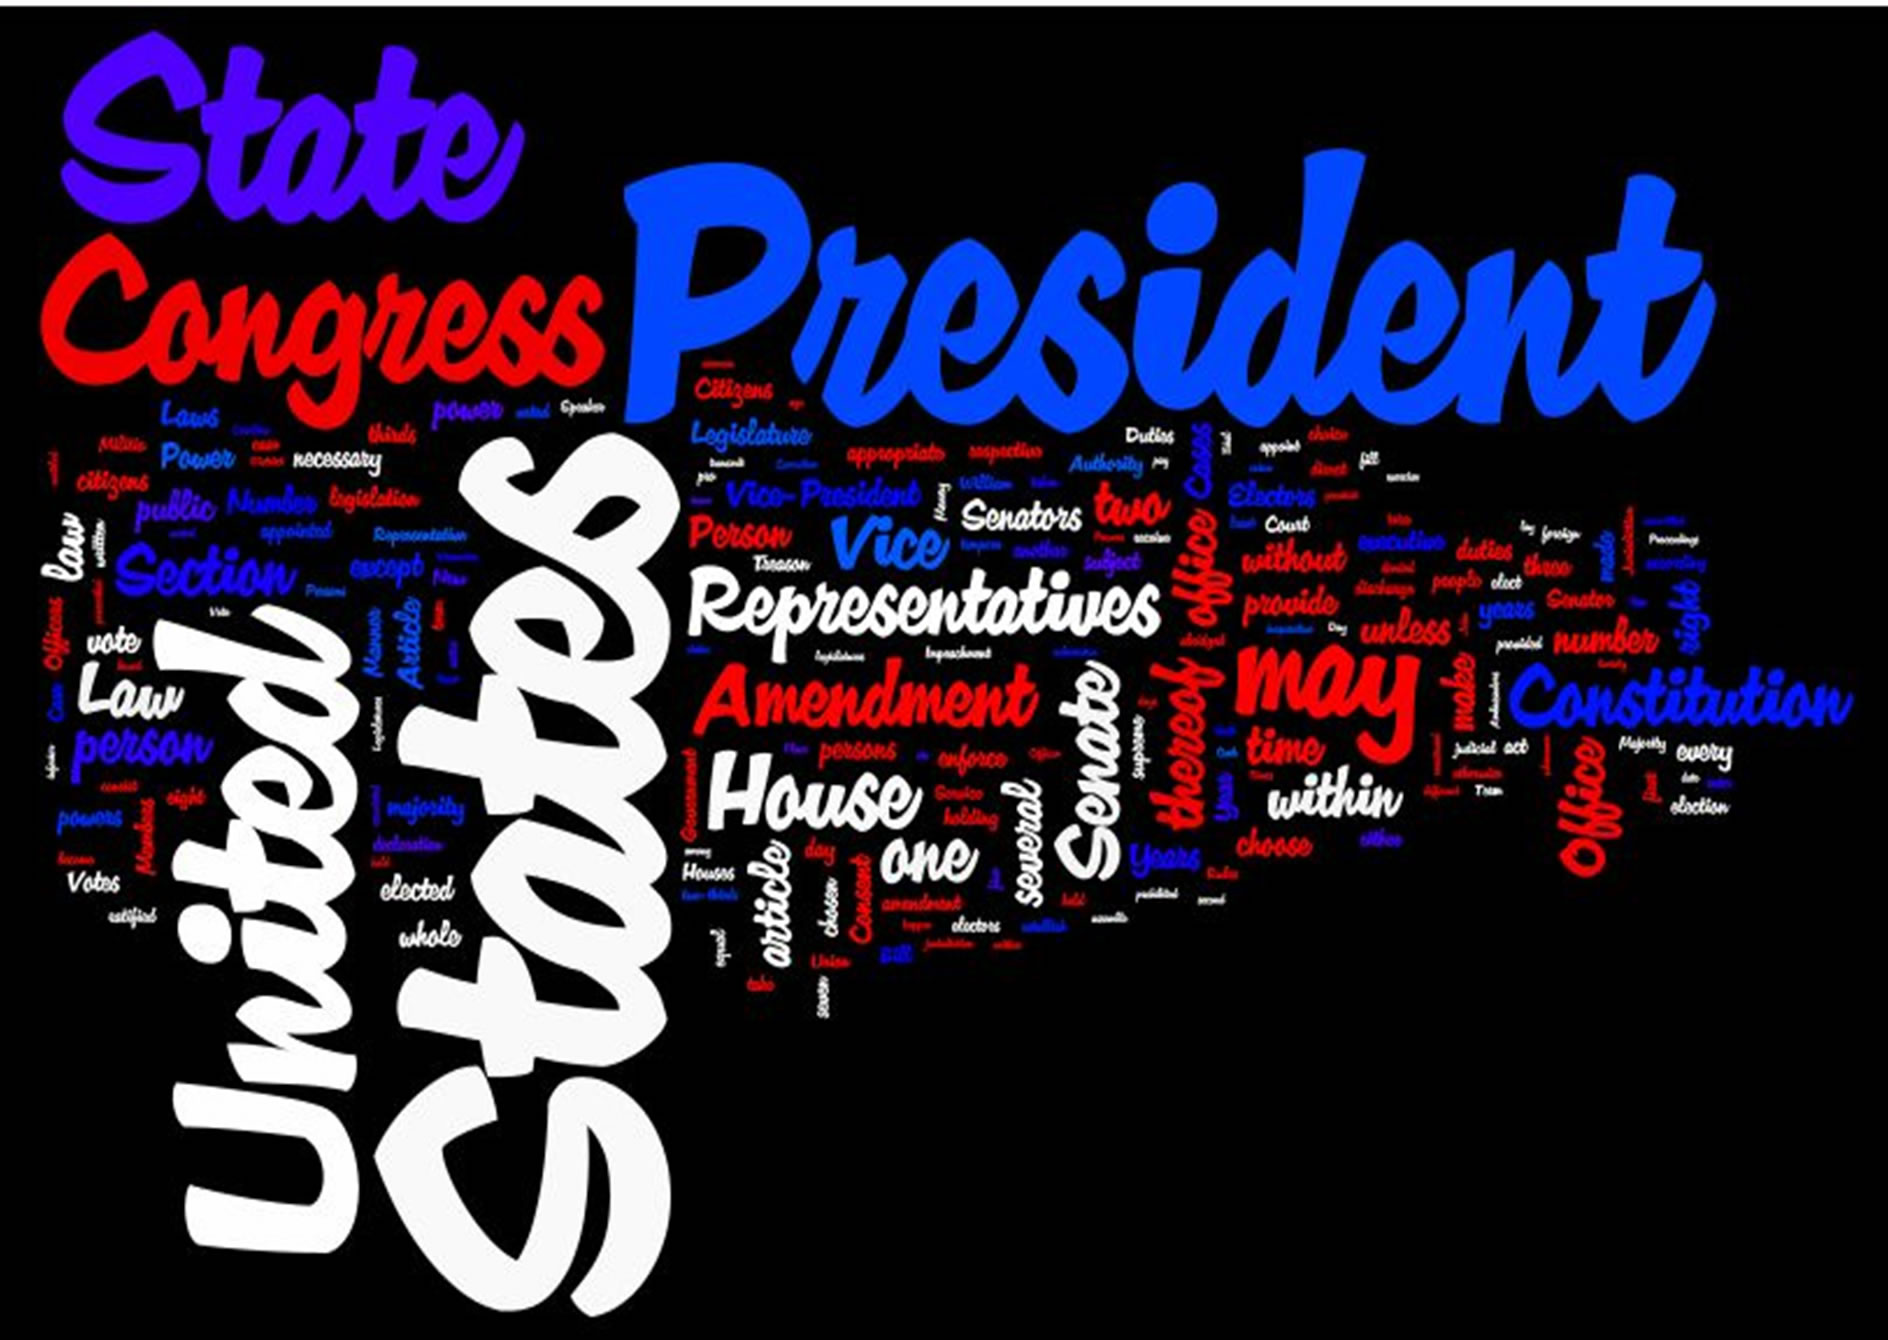
Figure 2. Most frequent words of US constitution presented using Wordle [3].
Analysis and Mining (BraSNAM), a satellite event of the XXXII Brazilian Computer Society Conference in July of 2012.
Document summarization algorithms intend to automatically create summaries. The basic ones simply select sentences or paragraphs from the text and show them in order of relevance. One of the first of these methods was proposed by H. P. Luhn back in 1957 [6]. It proposes the selection of a significant word pool through the definition of high and low frequencies cutoffs. These words should reflect the core subject, or subjects, of the text. The most relevant sentences will be those in which significant words appear more and closer to each other. It is important to note that Luhn’s method initially targeted science and technology texts, but its principles may work well for other styles too.
Luhn’s automatic abstract method was chosen as a starting point due to its simplicity and efficiency. It can create good summaries using only text mining and simple statistical concepts. Despite all the time since its publication, this algorithm continues to be used in recent works [7]. Nevertheless, previous examples using Luhn’s algorithm for the creation of graphs of words could not be found.
In the next section, the proposed method is described in detail. In Section 3, some application examples are presented and discussed. And in Section 4, the final considerations are made.
2. Method
The method proposed by this article can be divided in three main steps, as shown in Figure 3. In the following parts of this section, each step is explained.
2.1. Identifying Relevant Words
To identify the relevant words, text must be first preprocessed by well known text mining tasks: elimination of stop-words and stemming [8], although Luhn’s method may be used without these prior steps.
After preprocessing, next step is to identify the more relevant words by calculating their frequencies in the text. Simplifying Luhn’s method, the mean word frequency is considered as the low cutoff and no high cutoff is adopted. If the number of relevant words still shows too large due to the length of the document, one or more standard deviations may be added to the mean to raise the low cutoff. And some of the much frequent words may need to also be considered contextual stop-words.
To select the sentences to create the document abstract, Luhn’s method adopts a score that depends on the number of relevant words that appear together in that sentence, but within a defined threshold distance. This idea is adapted here to define a way of estimating the linkage force between a pair of relevant words.
2.2. Computing Linkage Force
Once relevant words have been selected, it is necessary to find how many times they appear together in pairs, in the same sentences, as well as the distances between them two within the same sentences. (Differently from Luhn’s method, there is not a threshold distance beyond which pairs should not be considered.) The many possible distances between each pair of relevant words must be reduced to a mean value for the pair.
Then, these two values, 1) number of times two relevant words appear together in a sentence and 2) mean distance between them in all sentences, should be used to compute the linkage force between them two. The more times two relevant words appear in the same sentences and at the shortest mean distance, the stronger is the link between them. For any two relevant words A and B, doing the necessary normalizations, the linkage force between them is
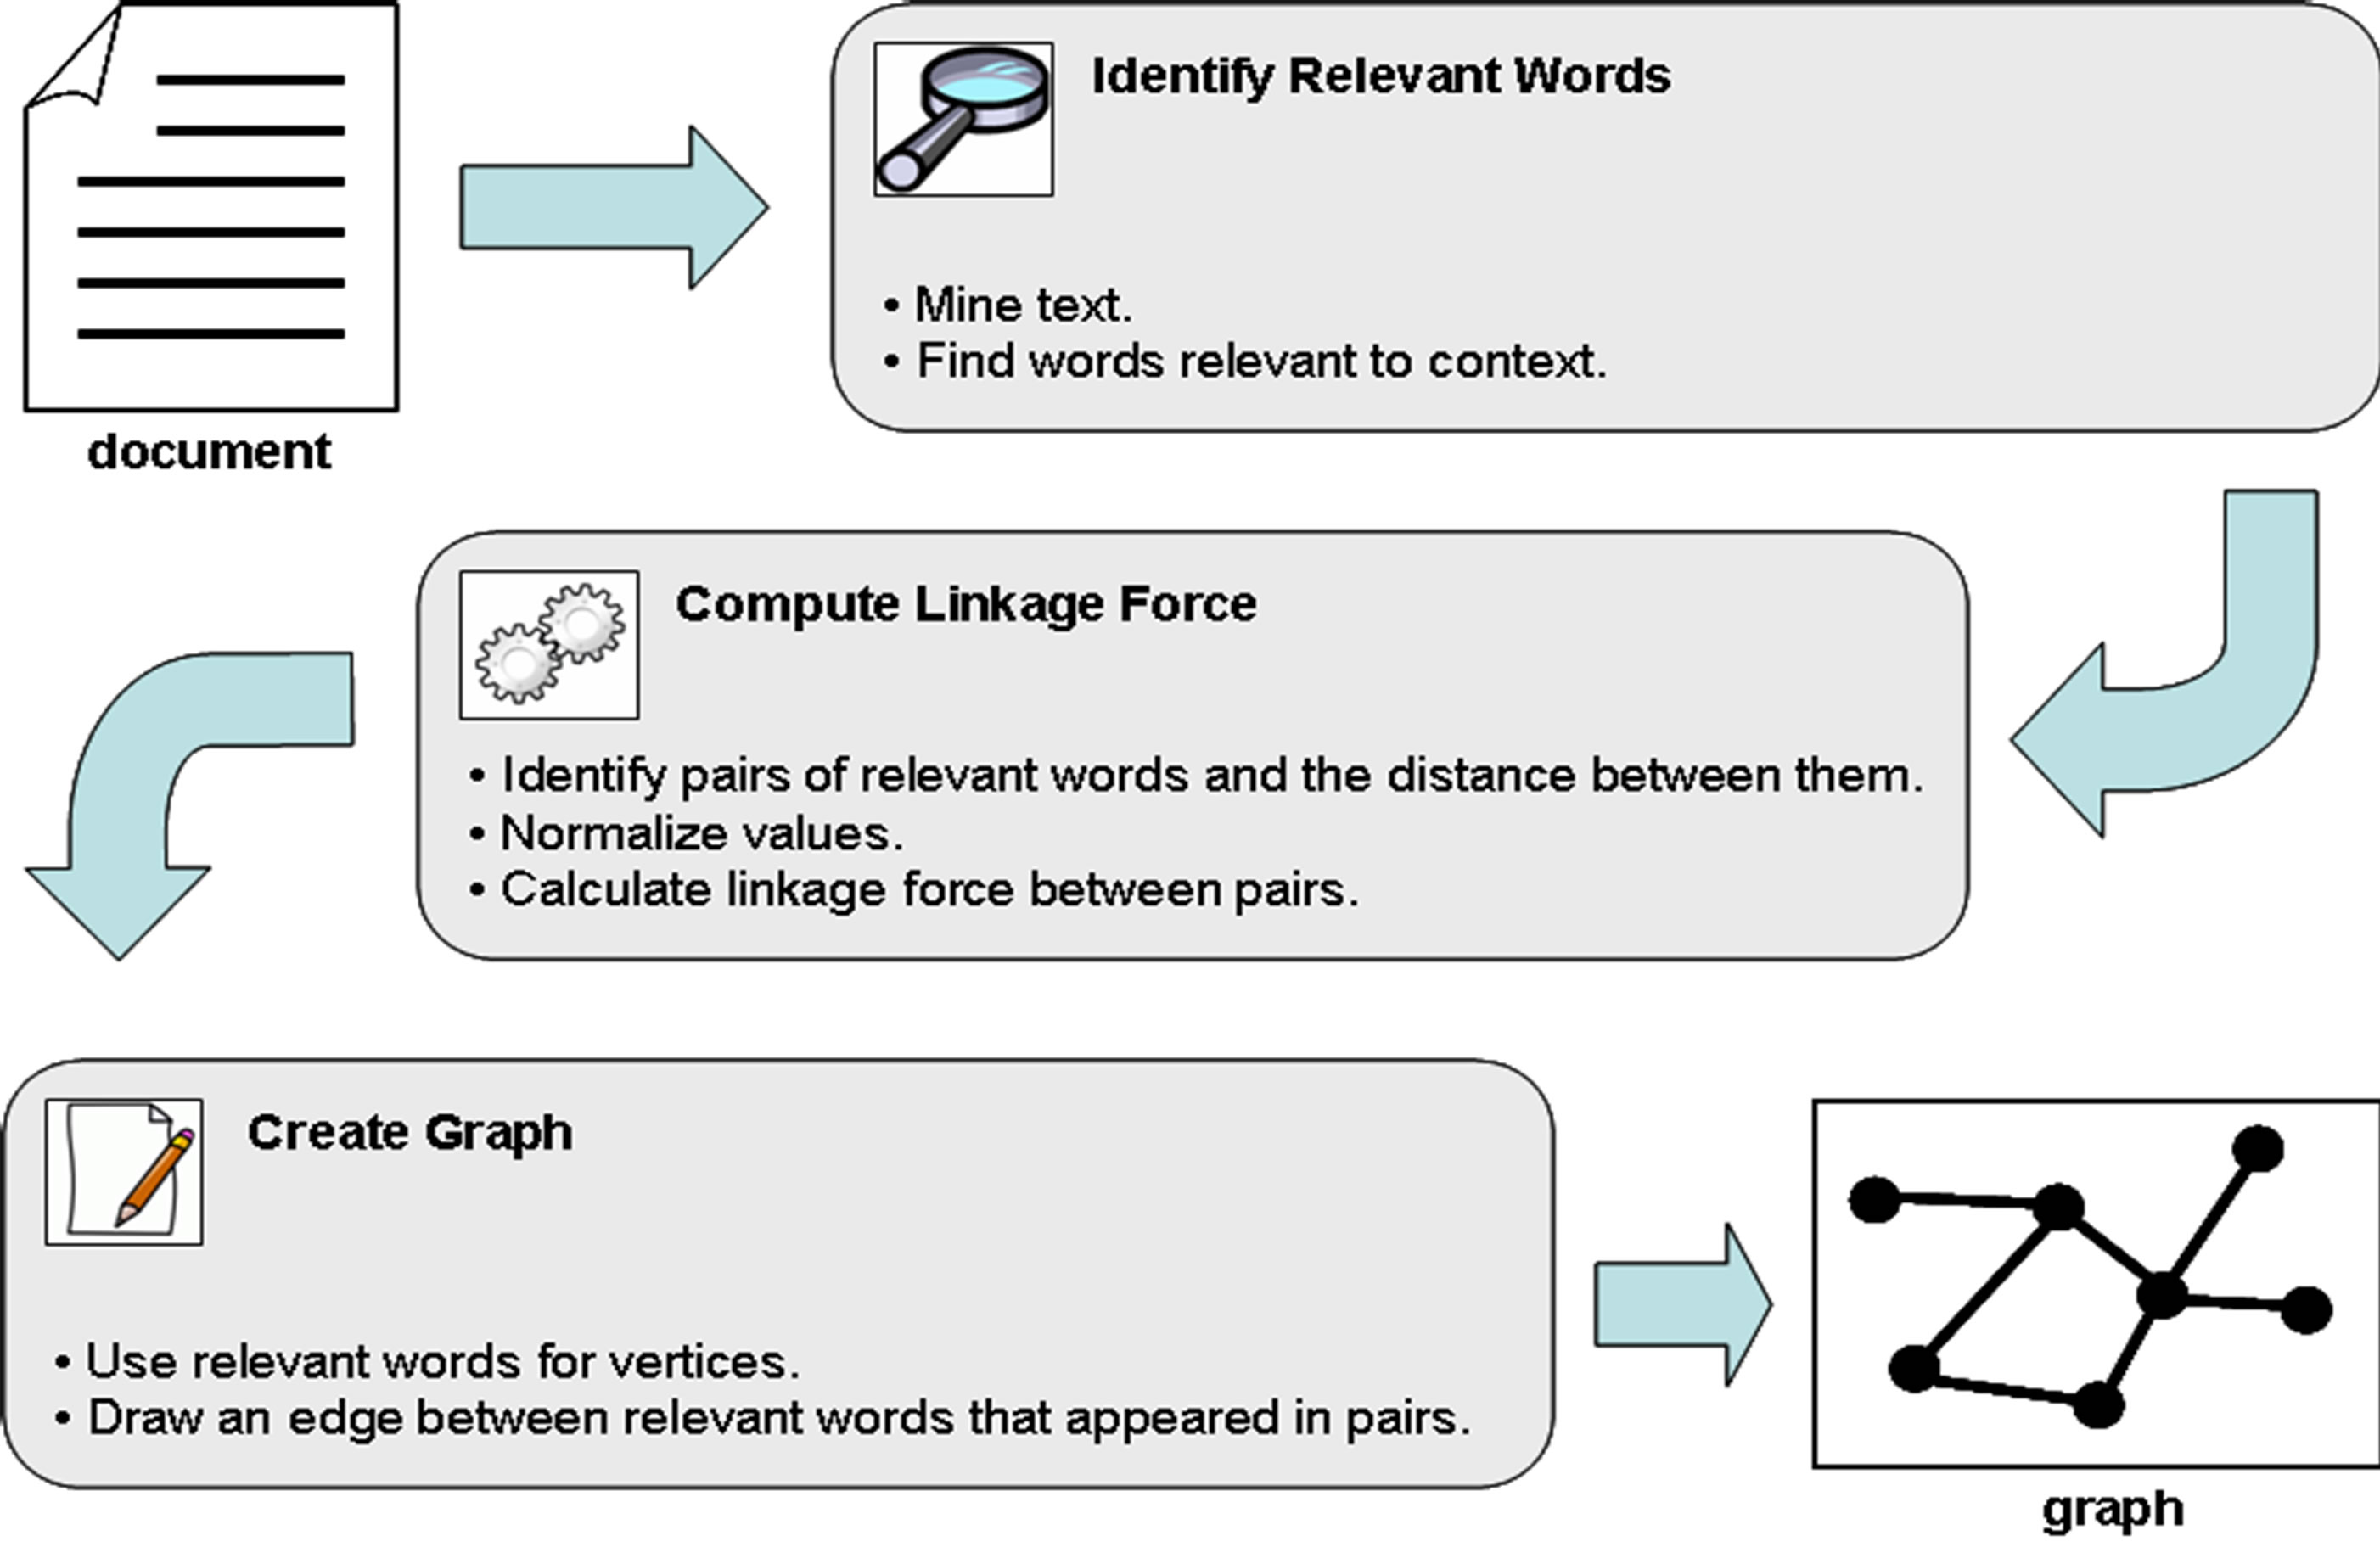
Figure 3. Main steps of the proposed method.
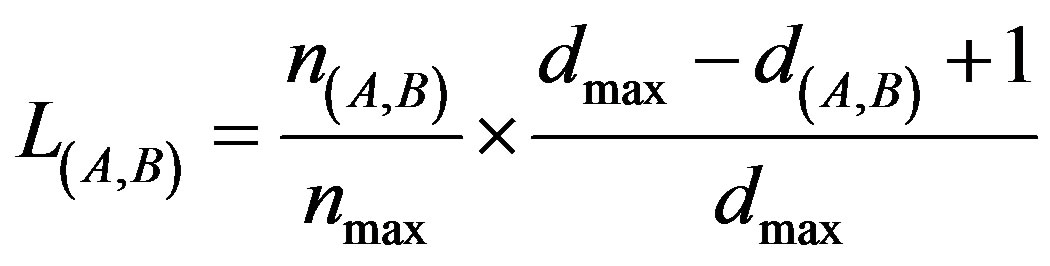
where n(A,B) is number of times words A and B appear together in the same sentences, nmax is the highest number of times any pair of relevant words appear together in then same sentences, d(A,B) is the mean distance between words A and B in all sentences they appear together and dmax is the highest mean distance between any pair of relevant words in all sentences they appear together.
The normalized number of times and mean distance vary from zero (exclusive) to 1 (inclusive) and so does the linkage force, consequently.
2.3. Creating a Graph of Words
Once data have been processed, the graph of words may be created. Relevant words will stand as vertices and the edges will exist whenever there will be a relationship between a pair of words. Visual exploration let us evaluate concepts like centrality and intermediation, which helps to understand document’s core subject and the structure. Disconnected sub graphs may show different subjects or subparts in the same text.
To enhance visualization, vertices may be drawn in a size proportional to the word frequency, as well as edges may be drawn as thick as the linkage force between the words. That is, bigger vertices denote more frequent words and thicker edges denote stronger links.
3. Application
To evaluate the method, three documents of different lengths were processed. There was no special reason other than to vary the input in each turn and observe the results.
All documents were converted to plain text format and processed by scripts developed by the authors in the Python programming language. Two important Python libraries were also used: NumPy [9], for statistical treatment, and Natural Language Toolkit (NLTK) [10], for text mining. The HalfViz graph visualization environment [11] was used to create the graphs.
It was observed that the method has an important dependence on sentence delimitation criteria. When binary files are converted to plain text, paragraphs and sentences may be broken and the resulting fragmented text will lead to a more disconnected graph.
3.1. Document A
Document A [12] is a tutorial about the use of “sna” package for the statistical software R. It was chosen to represent shorter documents. Table 1 displays the metrics computed for the document.
To reach a satisfactory representation for this document, only relevant words with frequency greater than the mean word frequency plus one standard deviation were selected. And only pairs with linkage force greater than 0.1 were finally considered.
Figure 4 shows the graph created for Document A. It has two sub graphs and the bigger one gathers the main concepts. The edges that link the vertices “network”, “social” and “sna” are stronger and denote their importance to the document context. On the other hand, the distance of the sub graph formed by the words “graph” and “set” shows they represent a different part of the document.
3.2. Document B
Document B [6] is H.P. Luhn’s paper itself. It was chosen to represent medium length documents. Table 2 displays the metrics computed for the Document B:
To reach a satisfactory representation for this document, only relevant words with frequency greater than mean word frequency plus one standard deviation were selected. And only pairs with linkage force greater than 0.1 were finally considered.
Figure 5 shows the graph created for Document B. It has two main sections and a disconnected pair (“total”-“number”). Some words stand out due to their degree and stronger linkage force: “document”, “word”, “method” and “process”.
3.3. Document C
Document C [13] is the W3C’s Request for Comments for HTTP 1.1 (RFC 2616). It was chosen to represent longer documents. Table 3 displays the metrics computed for the Document C.
To reach a satisfactory representation for this document, only relevant words with frequency greater than mean word frequency plus three standard deviations were selected. And only pairs with linkage force greater than 0.35 were finally considered. Figure 6 shows the graph created for Document C.
Document C was by far longer than the previous documents. Due to the number of words, limits had to be higher to avoid an overpopulated graph. And the final result was very good, with a connected graph where the words “request” and “must” are central to the structure. Although a verb, “must” has been included as a relevant word because of the prescriptive nature of the document.
4. Conclusions
The objective of this paper was to propose a new way of creating graphs of words for single document visualization. The idea was to go beyond the simple word frequency metrics. Method adopts principles present in H. P. Luhn’s Automatic Abstract Method, and uses them to mine links between important concepts in the document.
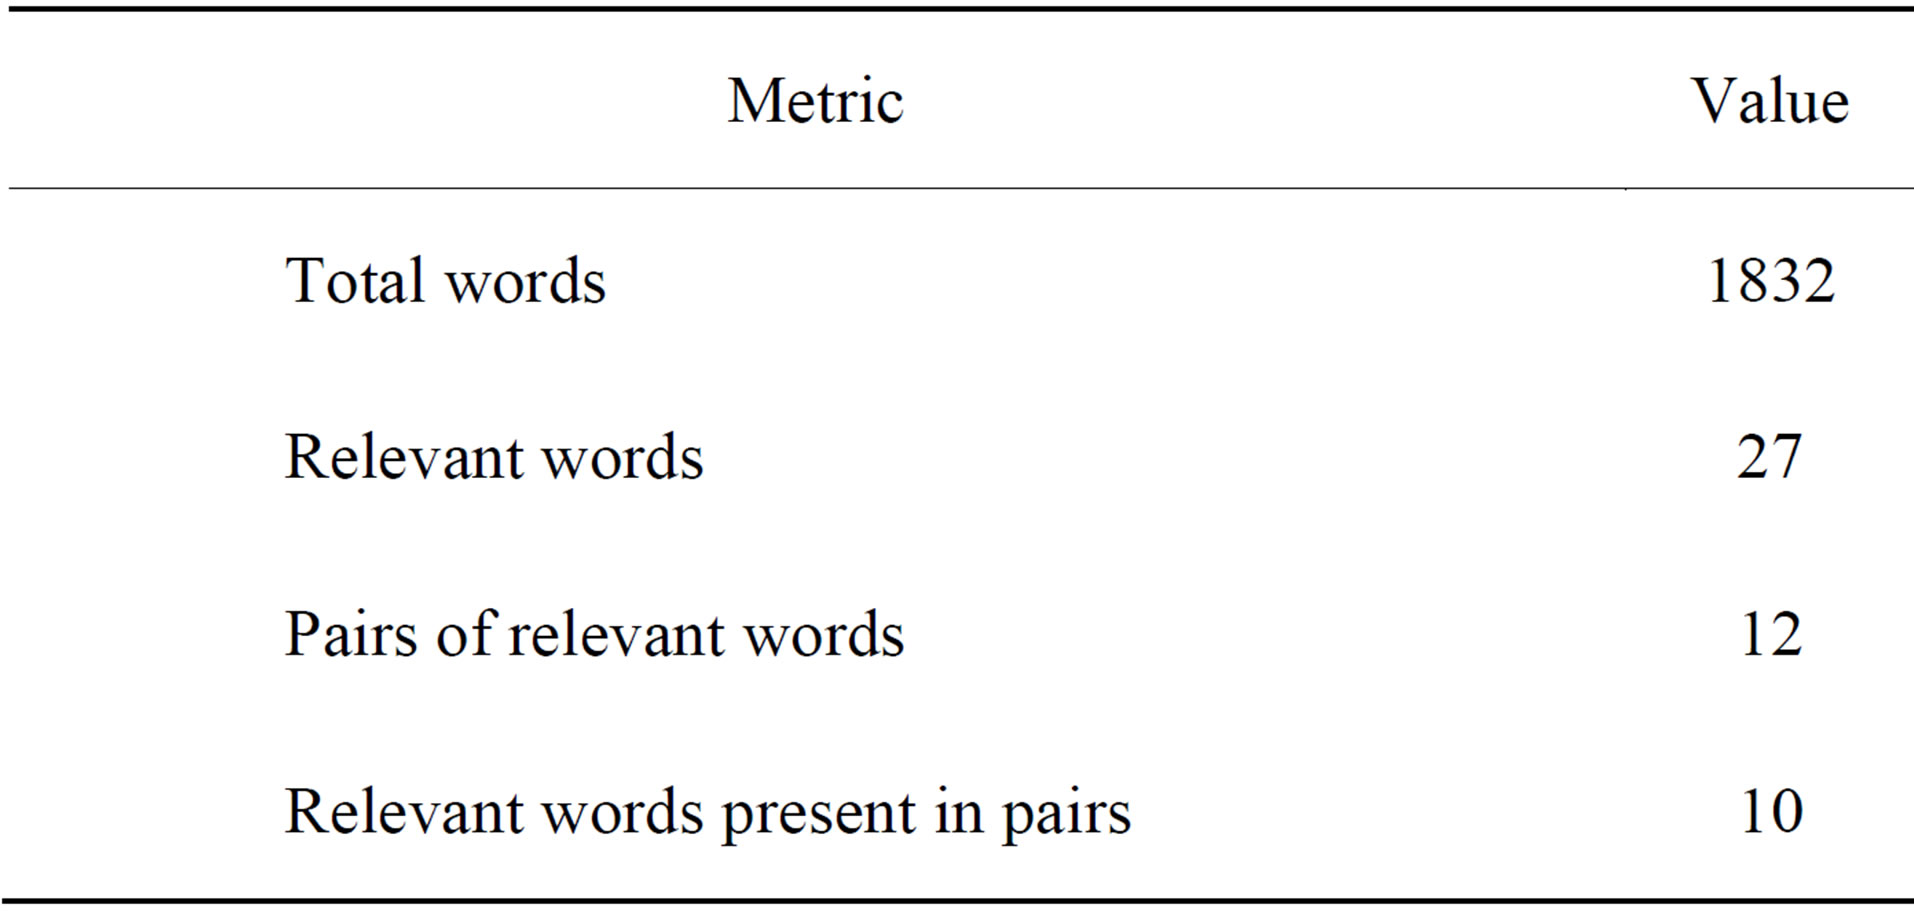
Table 1. Metrics for document A.
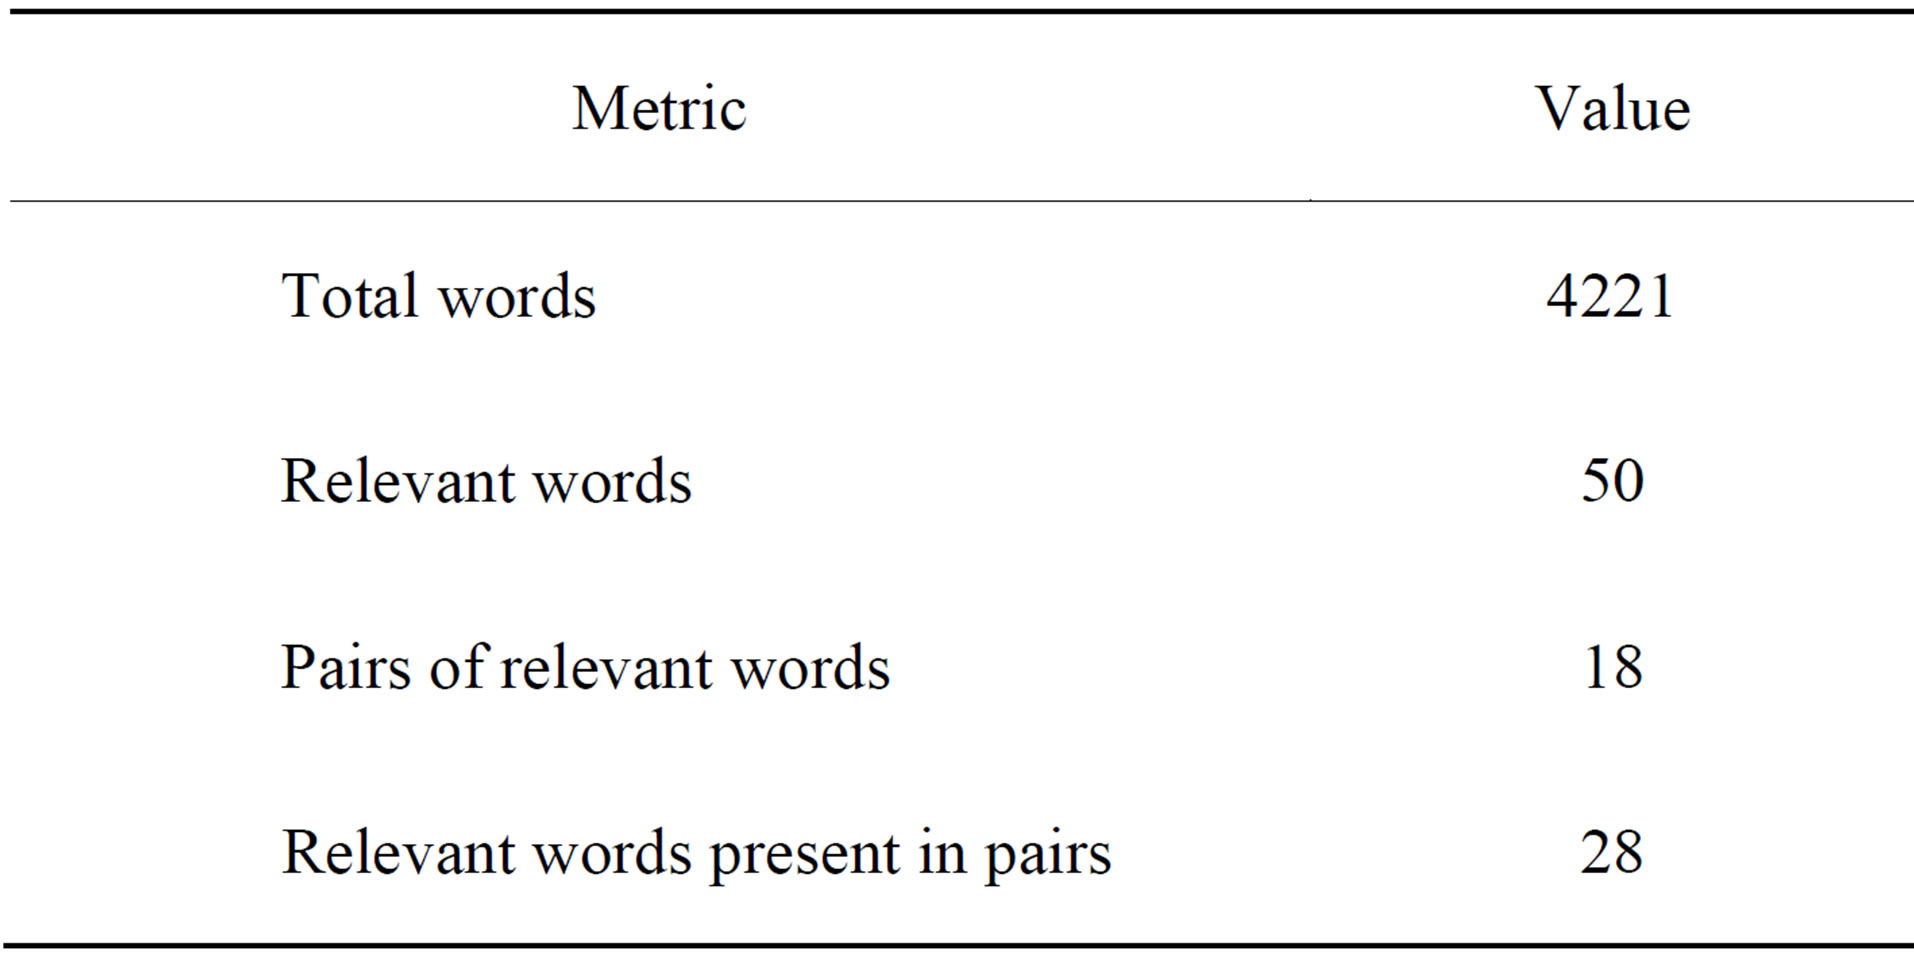
Table 2. Metrics for document B.
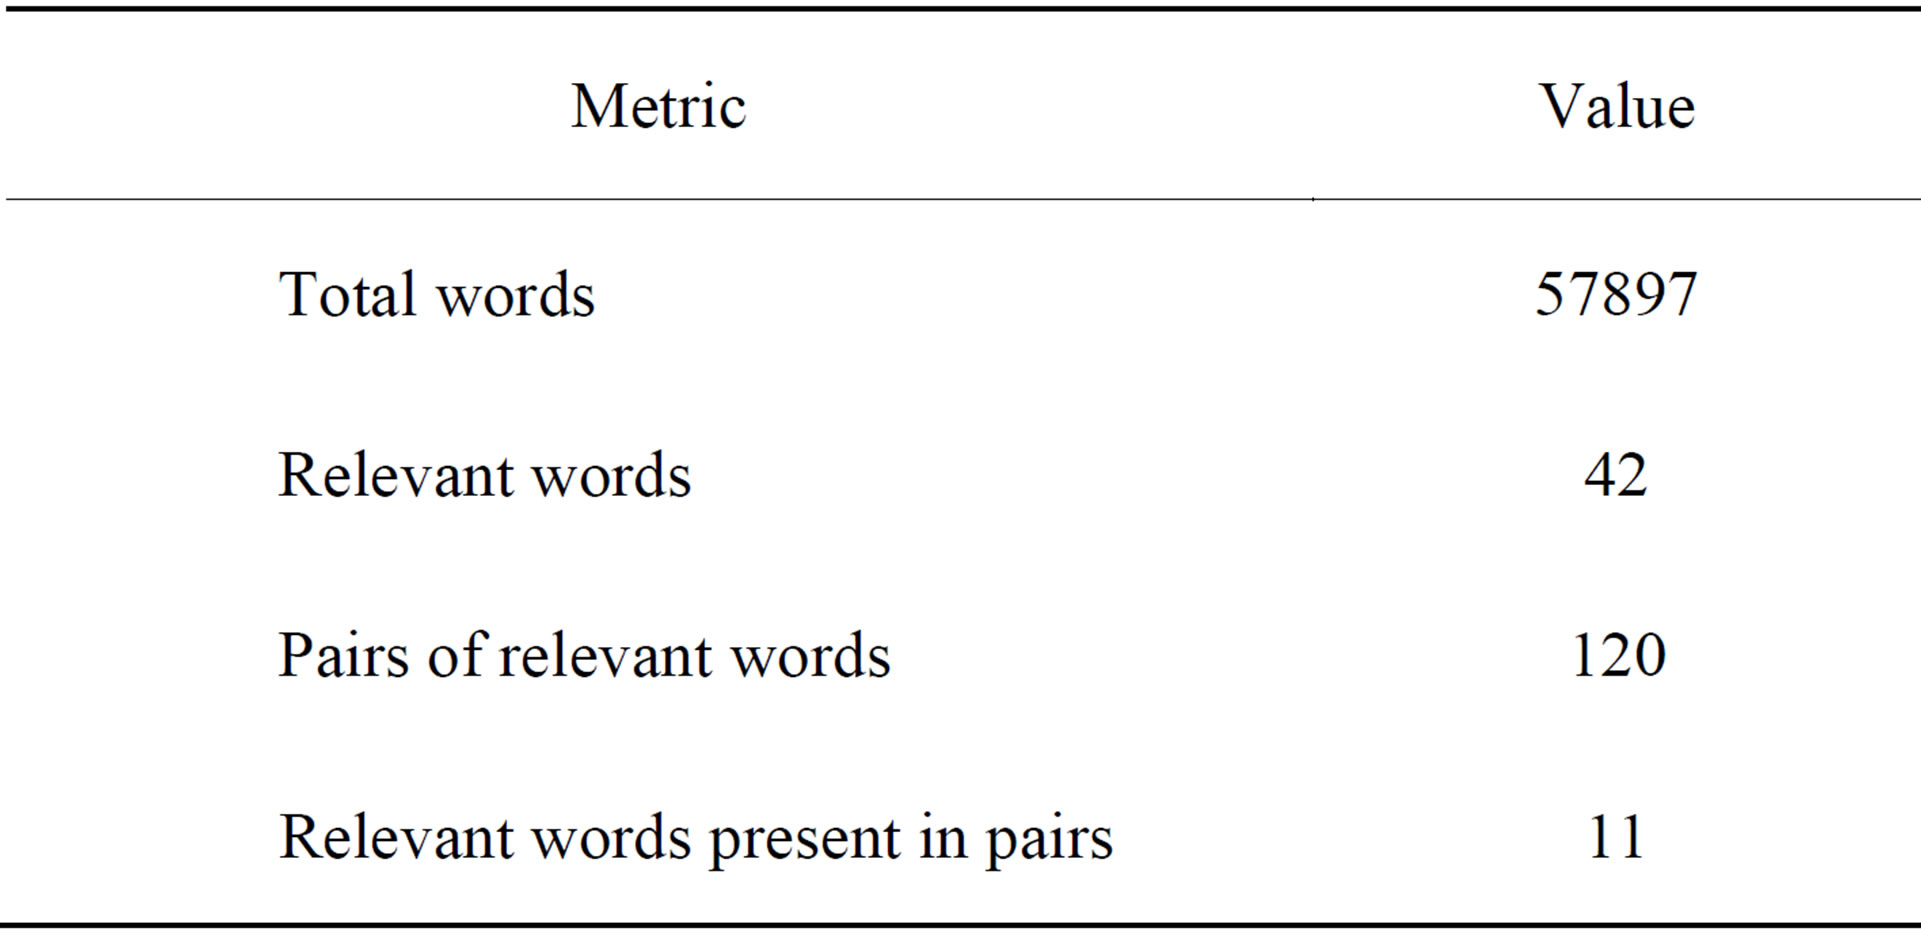
Table 3. Metrics for document C.
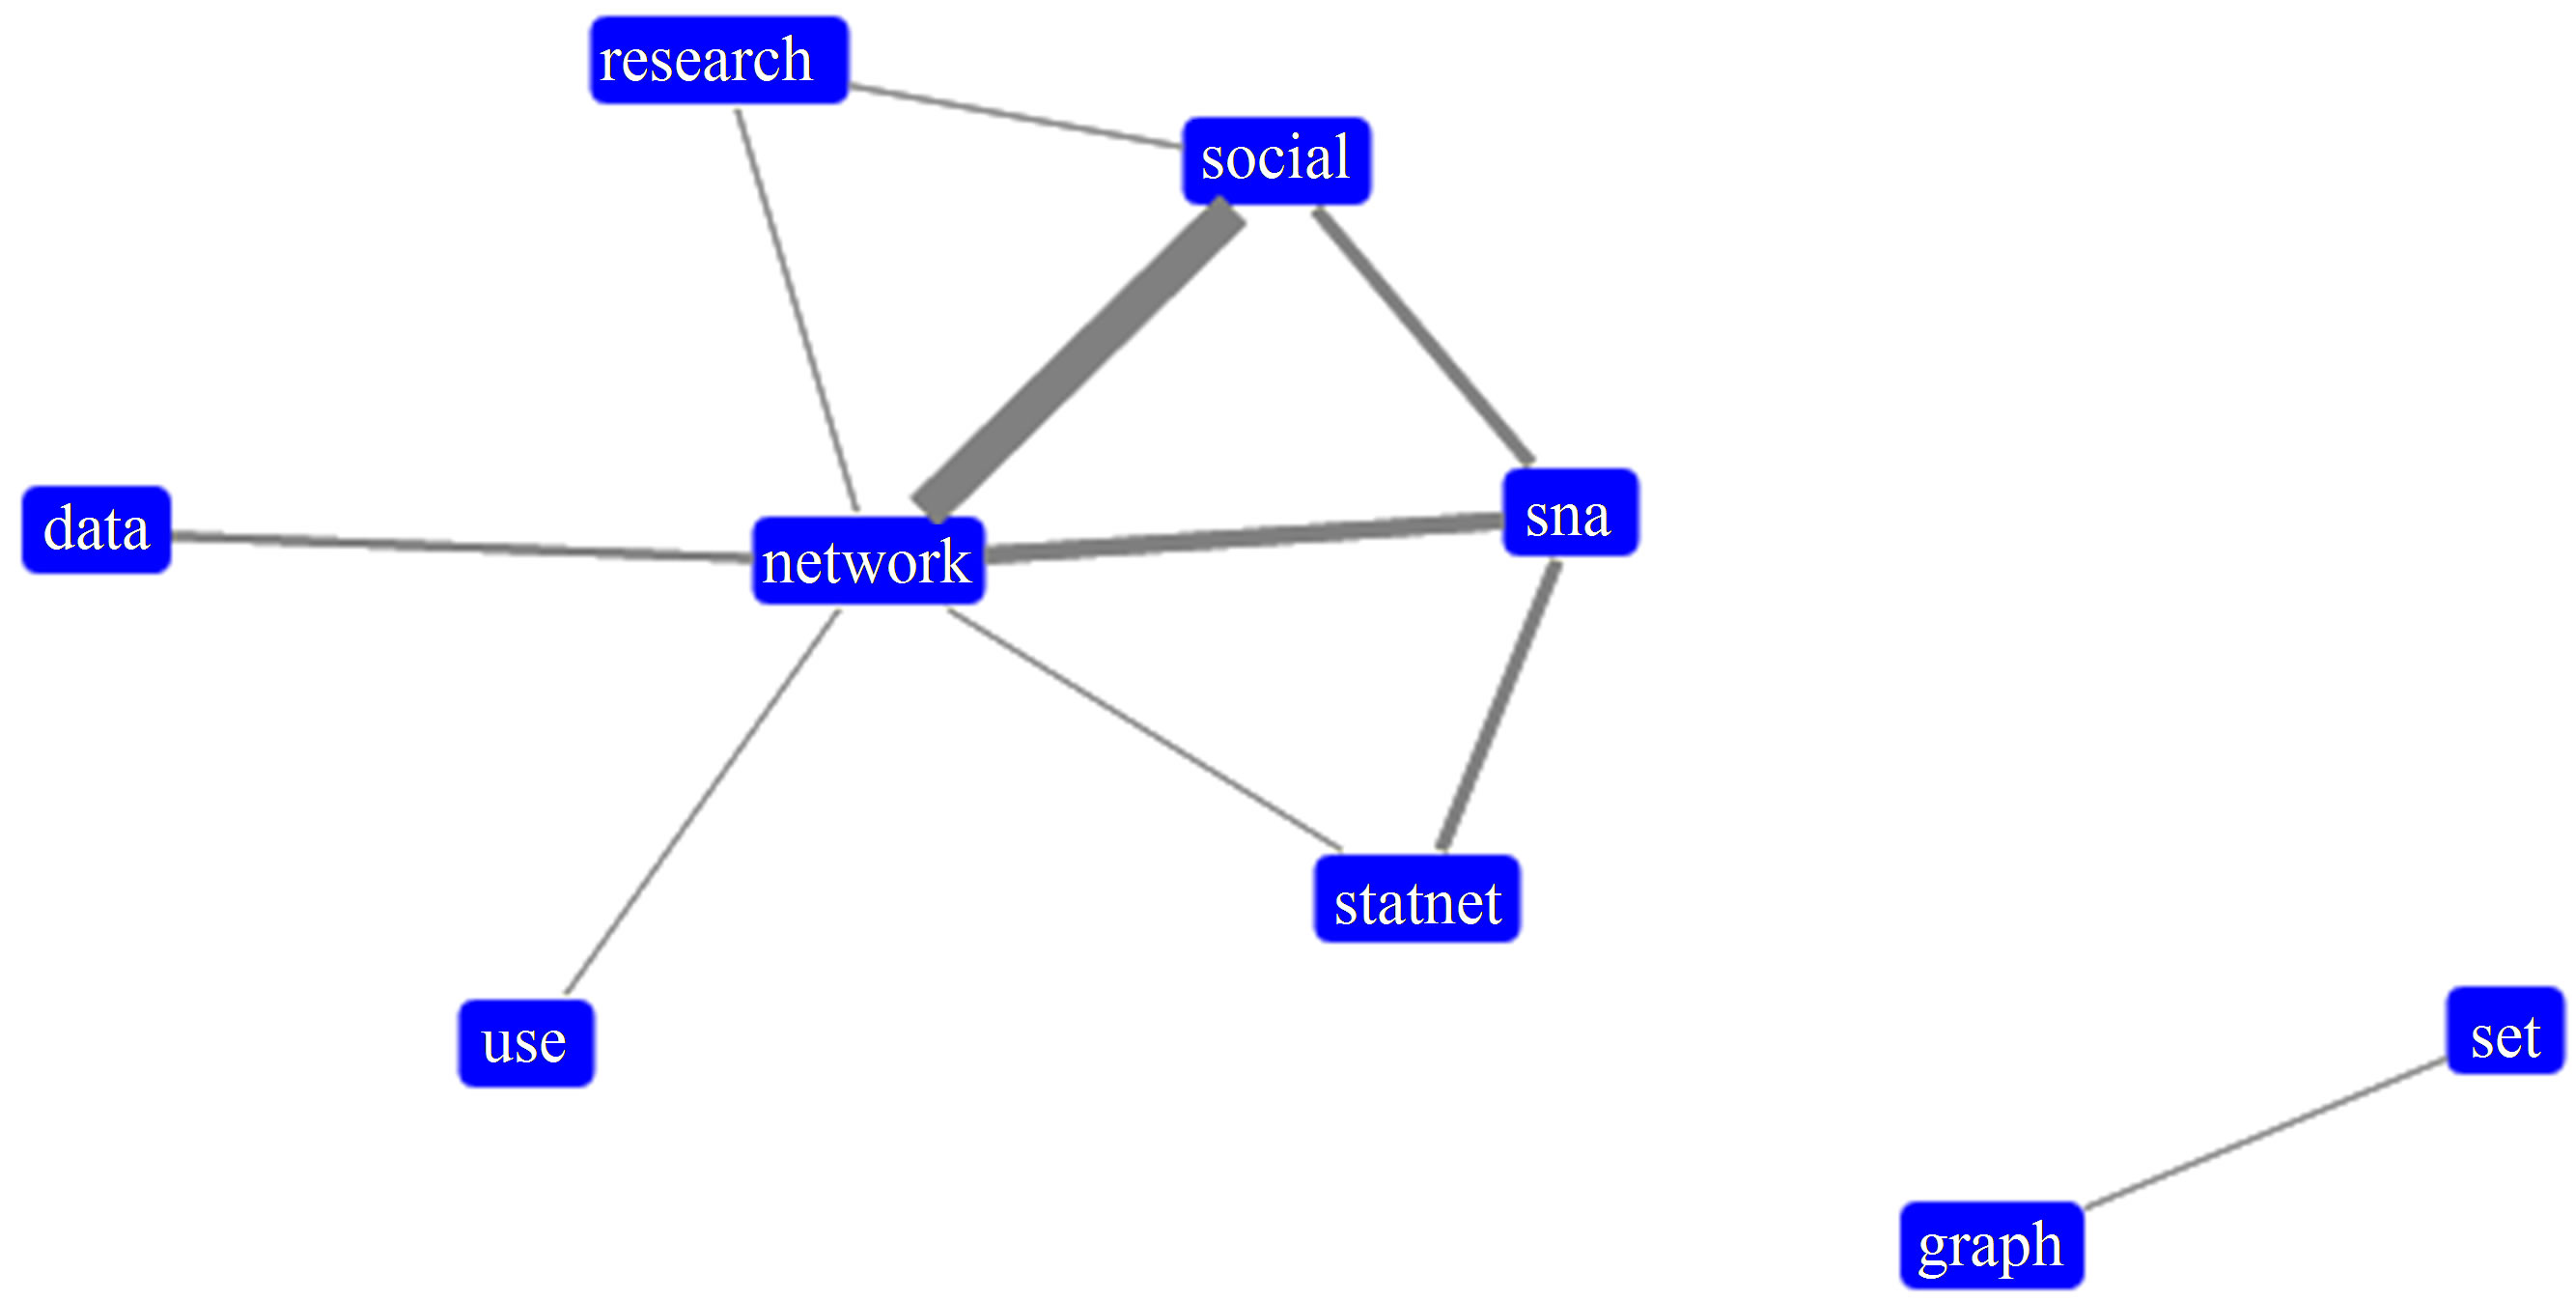
Figure 4. Graph created from document A.
Figure 5. Graph created from document B.
Figure 6. Graph created from document C.
Evaluating the results, it seems that the method may be used in documents of different lengths once the thresholds of word frequency and linkage force are adjusted. The text mining tasks of stemming and stop-word removing have a great impact on the outcome. Sentence fragmentation due to file conversion also affects the result and must be observed.
Although network metrics were not used, the graphs of words created may also be treated as such. That can bring new information about text structure. This will be an objective for future works.
REFERENCES
- M. Grobelnik and D. Mladenic, “Tutorial on Text Mining,” PASCAL Network of Excellence Workshop on Text Classification, 2004.
- IBM Research, “Many Eyes: Tag Cloud,” 2013. http://www-958.ibm.com/software/analytics/manyeyes/page/Tag_Cloud.html
- J. Feinberg, “Wordle—Beautiful Word Clouds,” 2013. http://www.wordle.net/
- J. D. Novak and A. J. Cañas, “The Theory Underlying Concept Maps and How to Construct Them,” Technical Report IHMC CmapTools 2006-01 Rev 01-2008, Florida Institute for Human and Machine Cognition, 2008.
- L. C. S. Silva and R. R. Sampaio, “Use of Graphs of Terms to Analyse Contents of Technical Documents,” Proceedings of the Brazilian Workshop on Social Network Analysis and Mining, XXXII Congress of the Brazilian Computer Society, Curitiba, 2012.
- H. P. Luhn, “The Automatic Creation of Literature Abstracts,” IBM Journal of Research and Development, Vol. 2, No. 2, 1958, pp. 159-165. http://dx.doi.org/10.1147/rd.22.0159
- M. A. Russell, “Mining the Social Web,” O’Reilly, 2011, pp. 256-257.
- S. M. Weiss, N. Indurkhya, T. Zhang and F. J. Damerau, “From Textual Information to Numerical Vectors,” In: Text Mining: Predictive Methods for Analysing Unstructured Information, Springer Verlag, 2005, pp. 15-44. http://dx.doi.org/10.1007/978-0-387-34555-0_2
- NumPy Developers, “Scientific Computing Tools for Python—Numpy,” 2013. http://www.numpy.org/
- NLTK Project, “Natural Language Toolkit—NLTK 2.0,” 2013. http://nltk.org/
- Samizdat Drafting Co., “HalfViz Graph Visualization Environment,” 2013. http://arborjs.org/halfviz/
- C. T. Butts, “Social Network Analysis with sna,” Journal of Statistical Software, Vol. 24, No. 6, 2008.
- R. Fielding, J. Gettys, J. Mogul, H. Frystyk, L. Masinter, P. Leach and T. Berners-Lee, “Hypertext Transfer Protocol—HTTP/1.1,” The Internet Society, 1999.