Journal of Water Resource and Protection
Vol. 2 No. 2 (2010) , Article ID: 1290 , 12 pages DOI:10.4236/jwarp.2010.22011
Assessment of Groundwater Quality in the Gaza Strip, Palestine Using GIS Mapping
1Institute of Earth Sciences, University of Heidelberg, Heidelberg, Germany
2Environmental Quality Authority, Department of GIS Mapping, Gaza, Palestine
E-mail: Basem.Shomar@geow.uni-heidelberg.de
Received November 4, 2009; revised November 23, 2009; accepted December 29, 2009
Keywords: Gaza, GIS, Groundwater quality
ABSTRACT
A Geographical Information System (GIS) tool was used to construct thematic maps for groundwater quality in the Gaza Strip. Environmental data were integrated and an overall picture about the spatial variation in the groundwater quality of the Gaza Strip was defined. The integrated spatial maps helped to refine information on land use, soil types, depth to groundwater table, environmental “hot spots”, and contaminant concentrations of the study area. The groundwater quality maps have been derived from the results of an eight-year monitoring program for major anions, cations and heavy metals. An environmental hot-spots map was derived from potential contaminating sources, showed direct and indirect influences on groundwater quality. The GIS maps showed not only contaminant distributions but also illustrated the need to improve the groundwater quality management methods. Several contaminants pose great problems in the water of Gaza. Integration of water data and GIS maps for all parameters revealed that there is probably no drinking water in Gaza according to the WHO standards. Moreover, the new maps of 2008 could be used as base-line for water planners and policy makers as well as guidelines for the Palestinian people to manage and protect their groundwater. Increased water demand from population and economic growth, environmental needs, land use changes, urbanization, groundwater mining, deterioration of water quality, pollution from local and diffuse sources, environmental hot-spots and impacts on public heath and ecosystems are all factors that can create a severe water quality crisis as well as water shortage problems.
1. Introduction
A Geographic Information System (GIS) is an important tool for integrating spatial data with other information. It allows one to analyze the integrated data and to represent the information spatially facilitating planning of resource development, environmental protection and scientific research [1–5]. This capability makes GIS a powerful tool for groundwater assessments. GIS not only provides tools for interpolating measured values of water quality parameters from specific locations, but also enables one to link water quality with land use, soil characteristics, and other relevant information. In addition, GIS provides sophisticated map-generation capabilities, useful in communicating results of data analysis [6–8]. Although GIS has been used to describe associations between water quality and both natural and anthropogenic activities in the world, in Palestine it has been applied in a limited fashion, but it has not been well implemented for planning, resource management and environmental protection at a national or regional level.
The Gaza Strip region is a fragile ecosystem suffering from increasing environmental assaults due to escalating population growth and limited availability of natural resources to support development. Groundwater is, perhaps, the most precious natural resource in the Gaza Strip as it is the only natural source of fresh water. Therefore, groundwater contamination can pose serious health and economic threats to the population that relies on this water for drinking, agriculture, and industry uses. The aquifer of Gaza is extremely susceptible to surface-derived contamination because of the high permeability of sands and gravels that compose the soil profile of Gaza [9,10]. It has already deteriorated in terms of quantity and quality as a result of over-exploitation and direct and indirect contamination [11–15].
The main objective of the current study is to use GIS to compare water quality data and related information collected during an eight-year monitoring program for groundwater quality in the Gaza Strip. A secondary objective is to portray the contaminant distribution in the groundwater of the Gaza Strip in easily viewed maps for use by the public and decision makers.
2. Study Area, Materials and Methods
2.1. Study Area
The Gaza Strip is one of the most densely populated areas in the world (4138 people per km2; [16]). For administrative purposes, the area has been divided into five regions: North, Gaza, Middle, Khan Younis and Rafah
(Figure 1). Approximately 85% of the population of the Gaza Strip drink from municipal groundwater wells and 15%, mostly in agricultural areas, use private wells to supply their drinking water [15].
The study area is part of the coastal zone in a transitional area between a temperate Mediterranean climate to the east and north and an arid climate of the Negev and Sinai deserts to the east and south. As a result, the Gaza Strip has a characteristic semi-arid climate. The hydrogeological features of the Gaza aquifer are well known. The coastal aquifer consists primarily of Pleistocene age

Figure 1. Gaza base map.
Kurkar Group deposits, including calcareous and silty sandstones, silts, clays, unconsolidated sands, and conglomerates. Near the coast, coastal clays extend about 2-5 km in land, and divide the aquifer sequence into three or four sub-aquifers, depending upon the location. Towards the east, the clays pinch out and the aquifer is largely unconfined [17]. Within the Gaza Strip, the total thickness of the Kurkar Group is about 100 m at the shore in the south, and about 200 m near Gaza city. At the eastern Gaza border, the saturated thickness is about 60-70 m in the north, and only a few meters in the south near Rafah. Local perched water conditions exist throughout the Gaza Strip due to the presence of shallow clays [18].
2.2. GIS Mapping
The GIS application was conducted according to Asadi et al. [6] and Carrera-Hernández and Gaskin [19] with modifications and changes to suit the study area of the Gaza Strip.
2.2.1. Thematic Maps
The base map data used for the study included digitized data sets originally developed by the Ministry of Planning, the Water Authority, and the Environmental Quality Authority in Palestine. The data sets were originally digitized from 1:20,000 scale topographic maps. The original digitized maps are registered to the National Grids-Palestinian Grid 1923. The study area matches these maps which cover the entire Gaza Strip area. Thematic maps including the base map (Figure 1) and network maps (Figures 3-20) were prepared from 1:20,000 scale topographic paper maps using AutoCAD and Arc/Info GIS software. All the maps were scanned and digitized to generate a digital output.
2.2.2. Water Quality Maps
The data used for the mapping water quality and other supporting maps were developed from the results of previously published studies [10,15,20–31]. Data for these studies were based on periodic fieldwork conducted by the Palestinian Water Authority for groundwater samples collected from predetermined locations of existing water wells in collaboration with Dr. Shomar who assisted with study design and was responsible for chemical analysis.
The sampling locations were integrated with the water data for the generation of spatial distribution maps of selected water quality parameters including electrical conductivity (EC), total dissolved solids (TDS), Cl-, F-, NO3-, SO42-, total hardness, Ca2+, Mg2+, Na+, K+, total Fe, total Cr, and total Zn. The water data were linked to the sampling locations using the basic geodatabase creation function of ArcGIS 9.2 software.
The present study used the Inverse Distance Weighted (IDW) method for spatial interpolation of water pollutants or other parameters. This method uses a defined or selected set of sample points for estimating the output grid cell value. It determines the cell values using a linearly weighted combination of a set of sample points and controls the significance of known points upon the interpolated values based upon their distance from the output point thereby generating a surface grid as well as thematic isolines. Important water quality parameters and their distribution patterns were studied in Gaza metropolis also with the help of cartographic techniques [19]. Thus, GIS enables us to present the cause and affect relationship visually.
The depth to water table (Figure 6) is based on the monitoring results of 500 groundwater wells. Data were obtained from both field surveys and databases of the Palestinian Water Authority.
3. Results
Owing to the large data set obtained from the analysis of 170 water samples for eight years, each having 27 parameters, this section focused on elements exceeding the World Health Organization (WHO) standards. Additionally, total Cr, Zn and Fe were presented to establish baseline values. Figures 7-20 showed the distribution of each parameter and the WHO standard. Maps showing land use, soil types, environmental hot-spots and socio-economic were included because these factors have direct and indirect impacts on groundwater quality.
3.1. Land Use
The area of the Gaza Strip is 363 km2 of which about
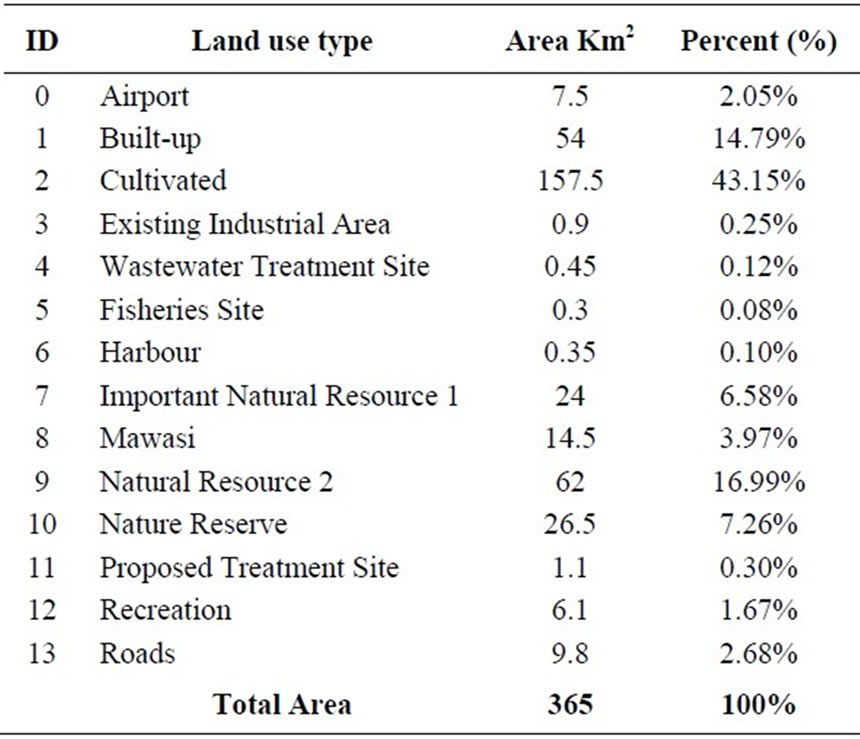
Table 1. Land use distribution in the Gaza Strip.
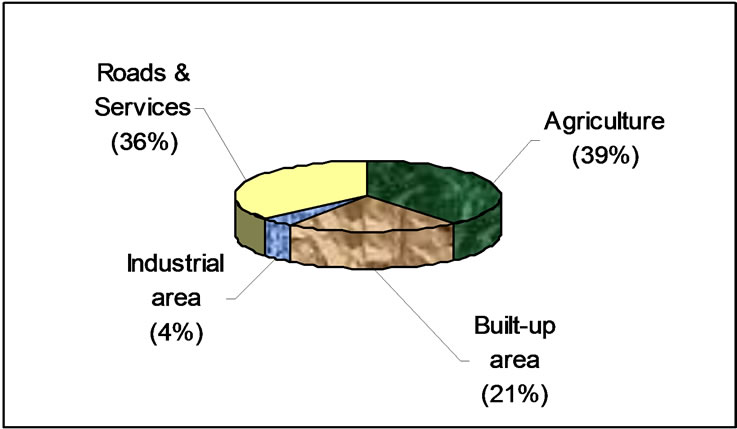
Figure 2. Major land use sectors in the Gaza Strip.
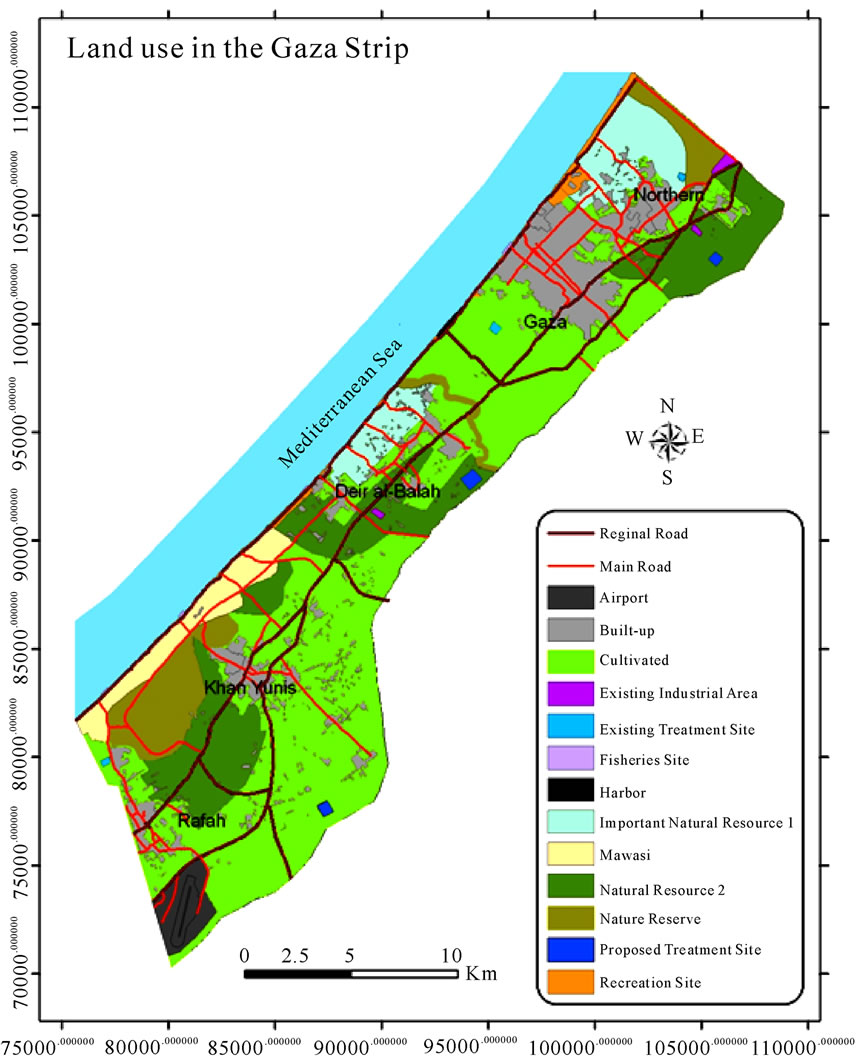
Figure 3. Land use in the Gaza Strip.
25% is urbanized. Table 1 and Figure 2 show the distribution of land use in the Gaza Strip based on estimated figures for 2008 and the available literature. About 40% of the land is being used for agriculture, most of which is in the eastern half of Gaza where population densities are low (Figure 3). The land use data were obtained from the analysis of aerial photographs taken in 2008. The industrial sector was discussed in detail in Shomar [31]. With an average population density of 4,091 people/km2, Gaza is one of the most densely populated areas in the world. About 80% live in the built-up areas shown on the map.
3.2. Environmental Hot Spots
In addition to the major pollution point sources of overloaded wastewater treatment plants, unprotected solid waste dumping sites and Wadi Gaza (Figure 4), hot spots appear sporadically in many locations due to Gaza’s inability to maintain adequate infrastructure. For example, frequent electricity outage or blackout causes paralysis of wastewater pumping stations and results in untreated wastewater infiltrating homes and streets. The lack of gasoline and diesel causes solid waste to accumulate in the streets without transportation to the dumping sites [31].
3.3. Soil Types
The Gaza Strip has several major soil types (Figure 5) including Arenosolic, Calcaric, Rhegosolic, and Calcaric Fluvisolic soils. Arenosolic (sandy) soils of dune accumulations are Regosols without a marked profile. The soils are moderately calcareous (5-8% CaCO3), with low organic matter, and are physically suitable for intensive horticulture. Calcaric Arenosols (loessy sandy soils) can be found some 5 km inland in the central and southern part of the Strip, in a zone along Khan Younis toward Rafah, parallel to the coast. This belt forms a transitional zone between the Arenosolic soils and the Calcaric (loess) soils. Typical Calcaric soils are found in the area between the city of Gaza and the Wadi Gaza and contain 8-12% CaCO3. Arenosolic Calcaric (sandy loess) soils are transitional soils, characterized by a lighter texture.
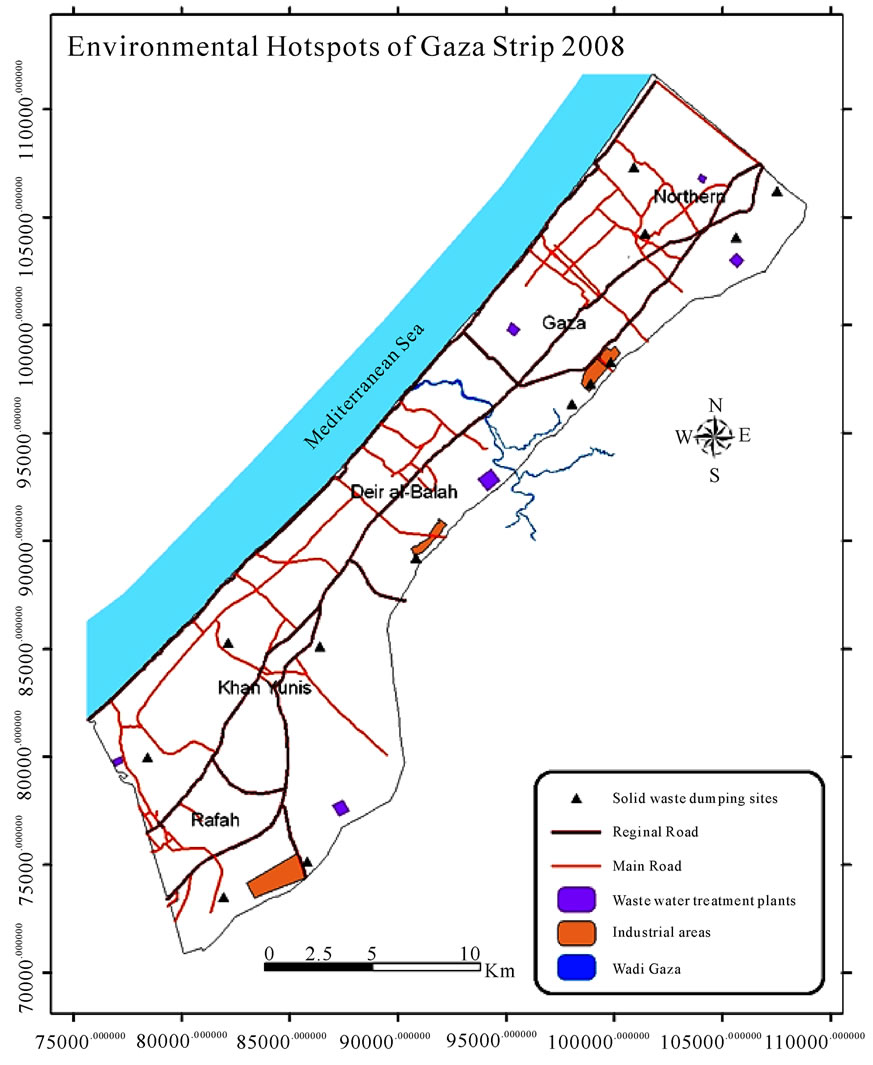
Figure 4. Environmental hot spots.
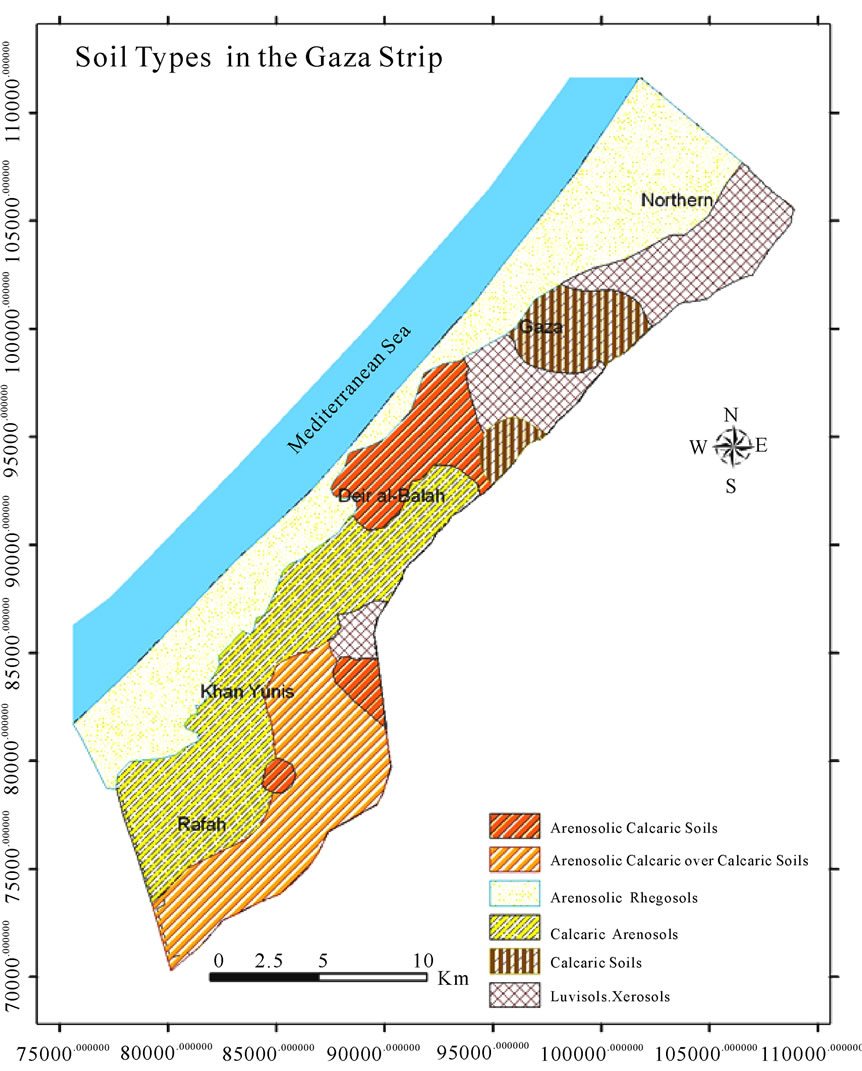
Figure 5. Soil types in the Gaza Strip.
These soils can be found in the depression between the Calcareous (Kurkar) ridges of Deir El Balah. Apparently, windblown sands have been mixed with Calcareous deposits. Deposition of these two types of windblown materials originating from different sources has occurred over time and more or less simultaneously. These soils have a rather uniform texture. Another transitional form is the Arenosols over Calcaric soils. These are loess or loessial soils (sandy clay loam) that have been covered by a layer (0.20-0.50 m) of dune sand. These soils can be found east of Rafah and Khan Younis. Fluvisols (alluvial) and Vertisols (grumosolic), which are dominated by loamy clay textures, are found on the slopes of the northern depressions between Beit Hanoun and Wadi Gaza. Drilling east of El Montar ridge revealed that alluvial deposits of about 25 m in thickness occur. At some depth, calcareous concentrations are present. The CaCO3 content can be approximately 15-20%. Some of the soils have been strongly eroded, and the reddish-brown subsoils may be exposed on the tops of ridges and along slopes. The alluvial sediments are underlain by a calcareous layer.
3.4. Water Table
The depth to water table (Figure 6) varies between few meters in the west (very closed to the sea) to about 120m at some locations in the east.
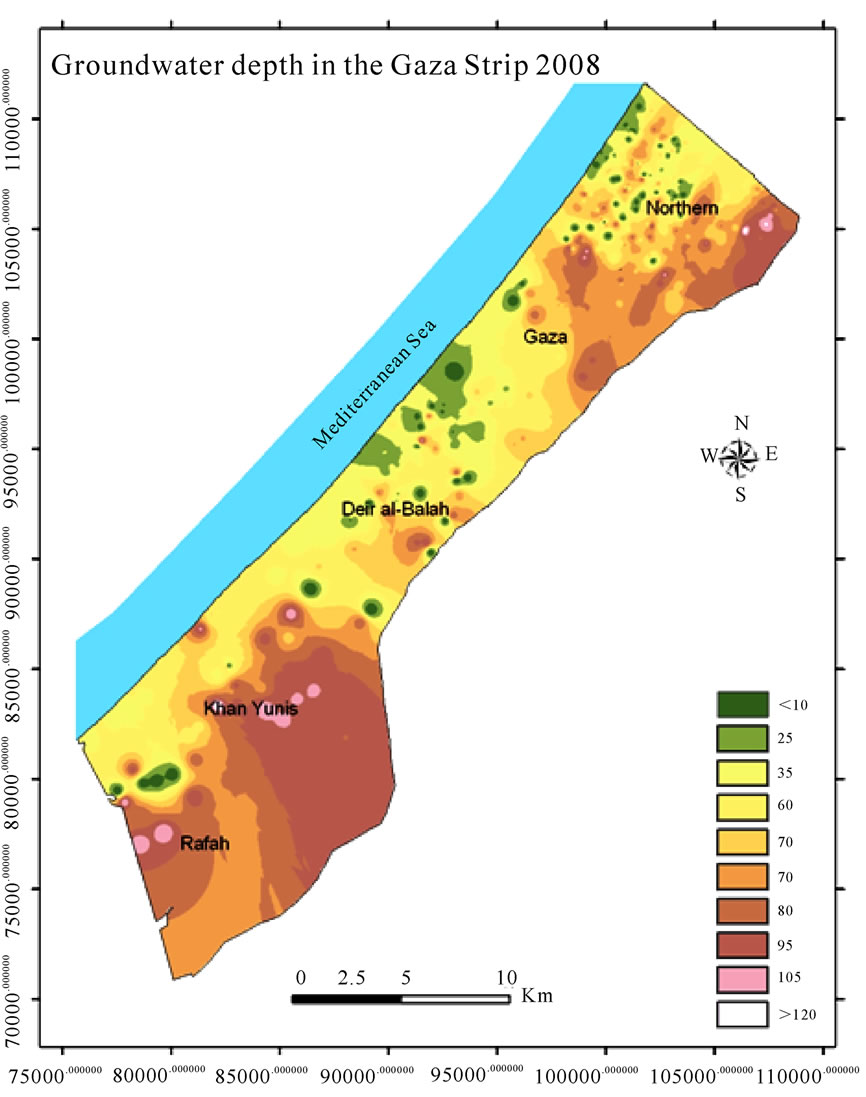
Figure 6. Groundwater depth in the Gaza Strip 2008.
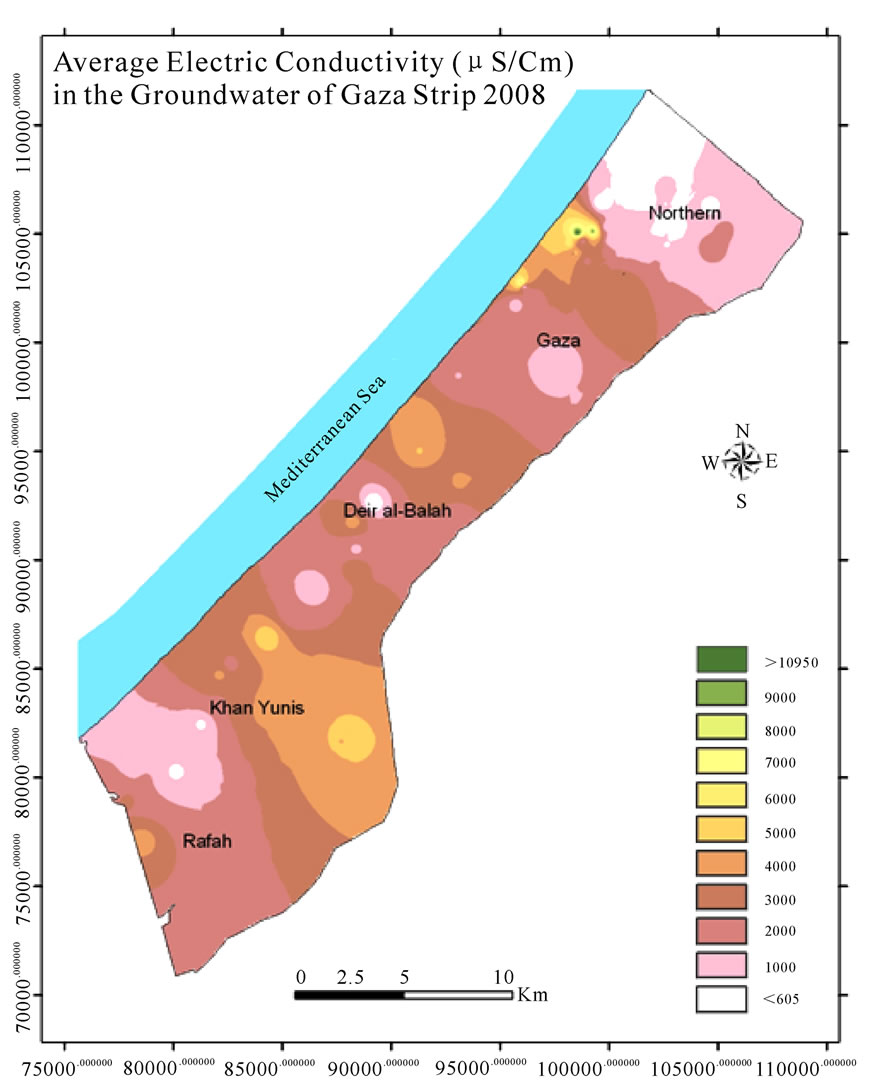
Figure 7. Electric conductivity in the groundwater of the Gaza Strip 2008.
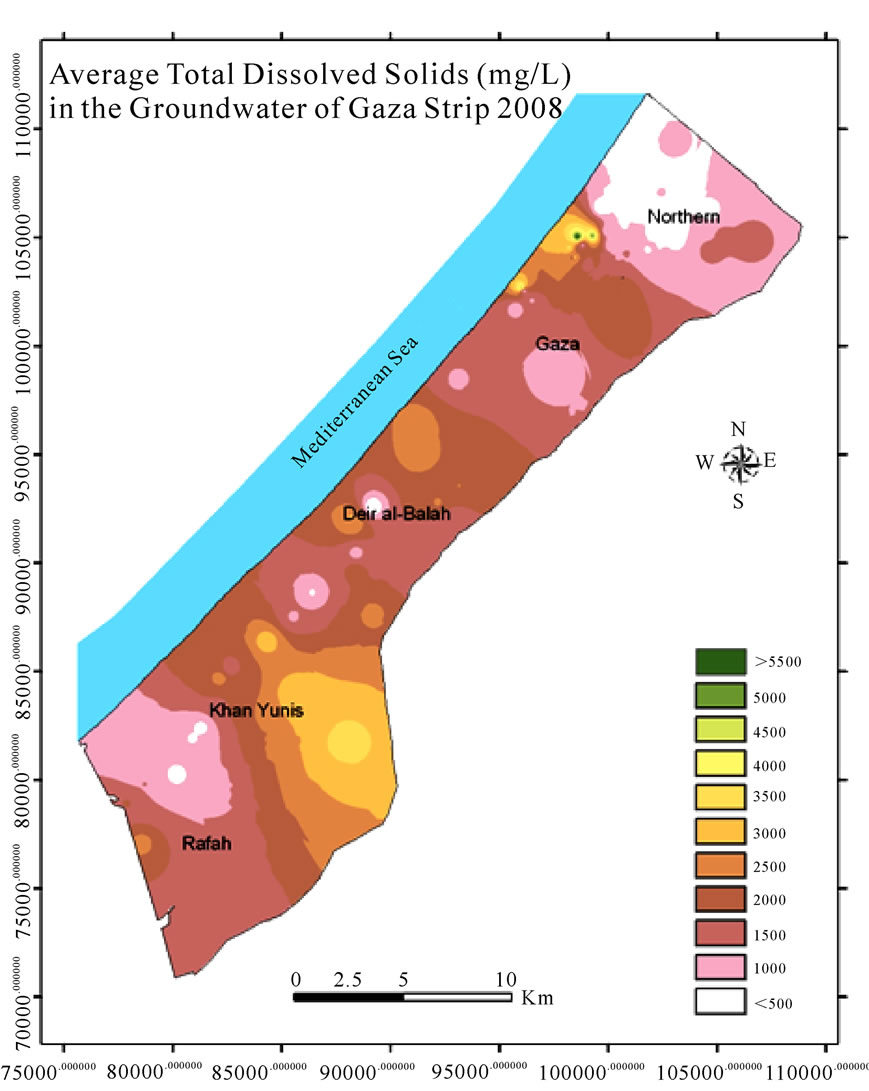
Figure 8. Total dissolved solids in the groundwater of the Gaza Strip 2008.
3.5. Electric Conductivity
With relatively small, localized exceptions, the EC of municipal wells increases from north to south (Figure 7). The lowest EC value was 1,198 µS/cm and the highest was about 3,800 µS/cm. The most deteriorated and salty water was in the eastern regions of Khan Younis and Rafah with an average EC in the private groundwater wells of 5,000 µS/cm.
3.6. Total Dissolved Solids
Figure 8 illustrates that groundwater in most of the Gaza Strip exceeds the WHO TDS standard, which is 1000 mg/L. The TDS and EC maps show similar patterns as both parameters indicate the concentration of dissolved solids in water. The high TDS value in the eastern parts of Khan Younis (3000-4000 mg/L) makes water in the area undrinkable. More than 50% of the sampled groundwater showed TDS of more than 2000 mg/L.
3.7. Anions (Chloride, Nitrate, Fluoride and Sulfate)
All wells in Gaza had at least one parameter of Cl-, NO3-, F- and SO42- exceeding the WHO standards of 250, 50, 1.5 and 250 mg/L, respectively. Chloride concentrations (Figure 9) corresponded to EC. The lowest value of Cl- at a municipal well was 35 mg/L whereas the highest value was 2652 mg/L for a well in Khan Younis. Water meeting the WHO Cl- standard was found in less than 5% of sample wells, primarily in the northern parts and scattered in more isolated areas in the rest of Gaza.
The map of nitrate (Figure 10) for the year 2008 confirms previous findings [29] that almost 90% of the groundwater wells of the Gaza Strip have NO3- concentrations two to eight times higher than the WHO standards.
Except for the north area, the average concentration of fluoride in the groundwater in the Gaza Strip (Figure 11) is higher than the WHO standards (which is 1.5 mg/L). The most fluoride contaminated areas are Khan Younis (average 2.7 mg/L) and Rafah (average 2 mg/L) and this is consistent with the previous study of Shomar et al. [21]. The F concentration increases from north to south.
Most of the wells in Gaza have SO42- concentrations exceeding the permissible WHO standard (Figure 12). The highest levels of SO42- were in Khan Younis and the southeast, where the average concentration is 380 mg/L.
3.8. Cations (Hardness, Calcium, Magnesium, Sodium and Potassium)
Most of the cations Ca2+, Mg2+, Na+ and K+ show concentrations higher than the WHO standards of 50, 30, 200 and 10 mg/L, respectively.
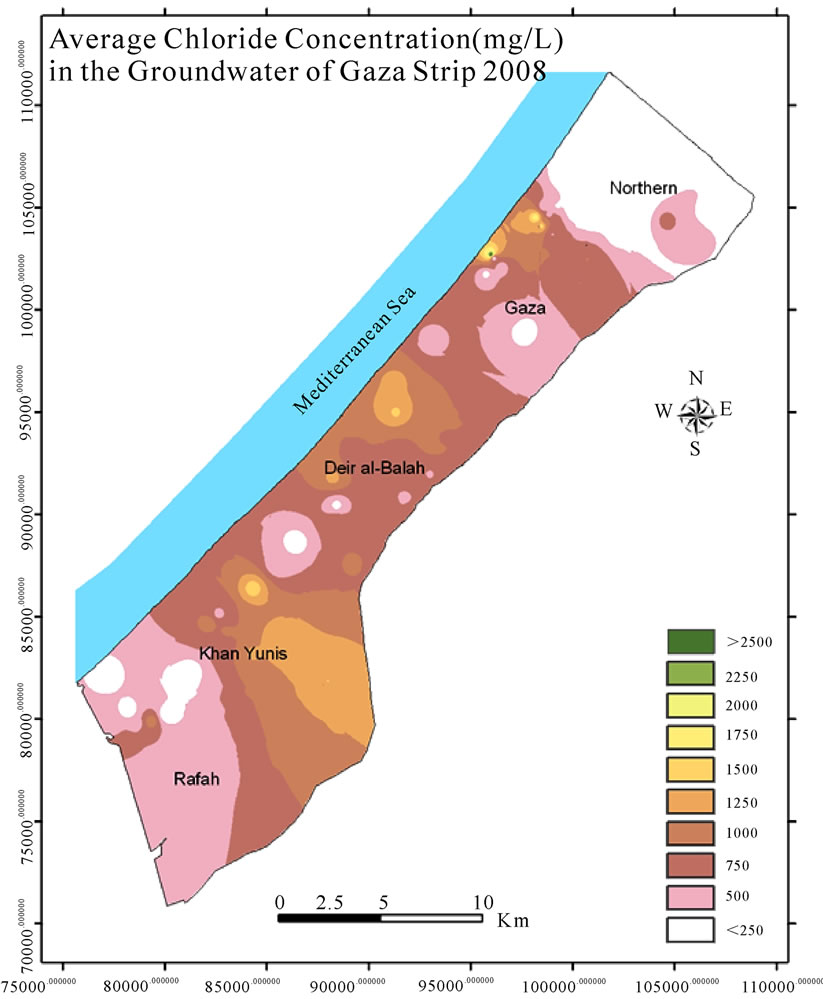
Figure 9. Chloride concentrations in the groundwater of the Gaza Strip 2008.
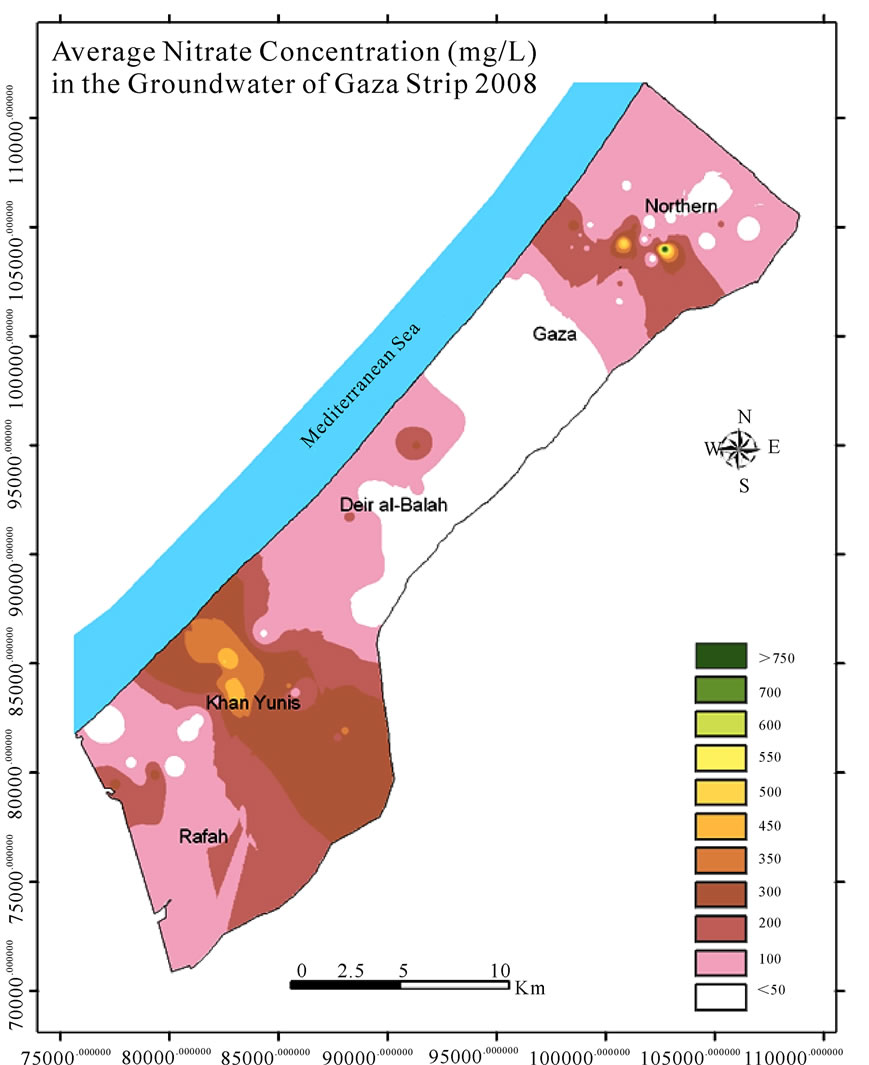
Figure 10. Nitrate concentrations in the groundwater of the Gaza Strip 2008.

Figure 11. Fluoride concentrations in the groundwater of the Gaza Strip 2008.
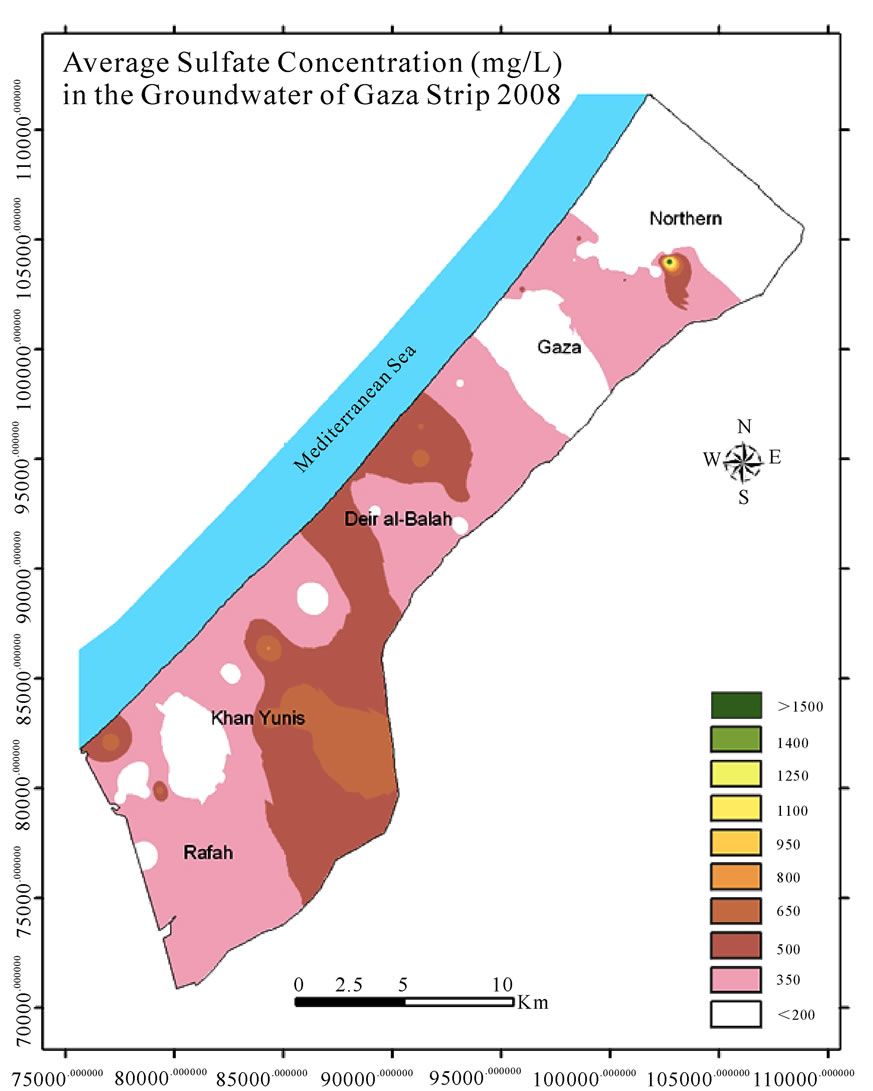
Figure 12. Sulfate concentrations in the groundwater of the Gaza Strip 2008.
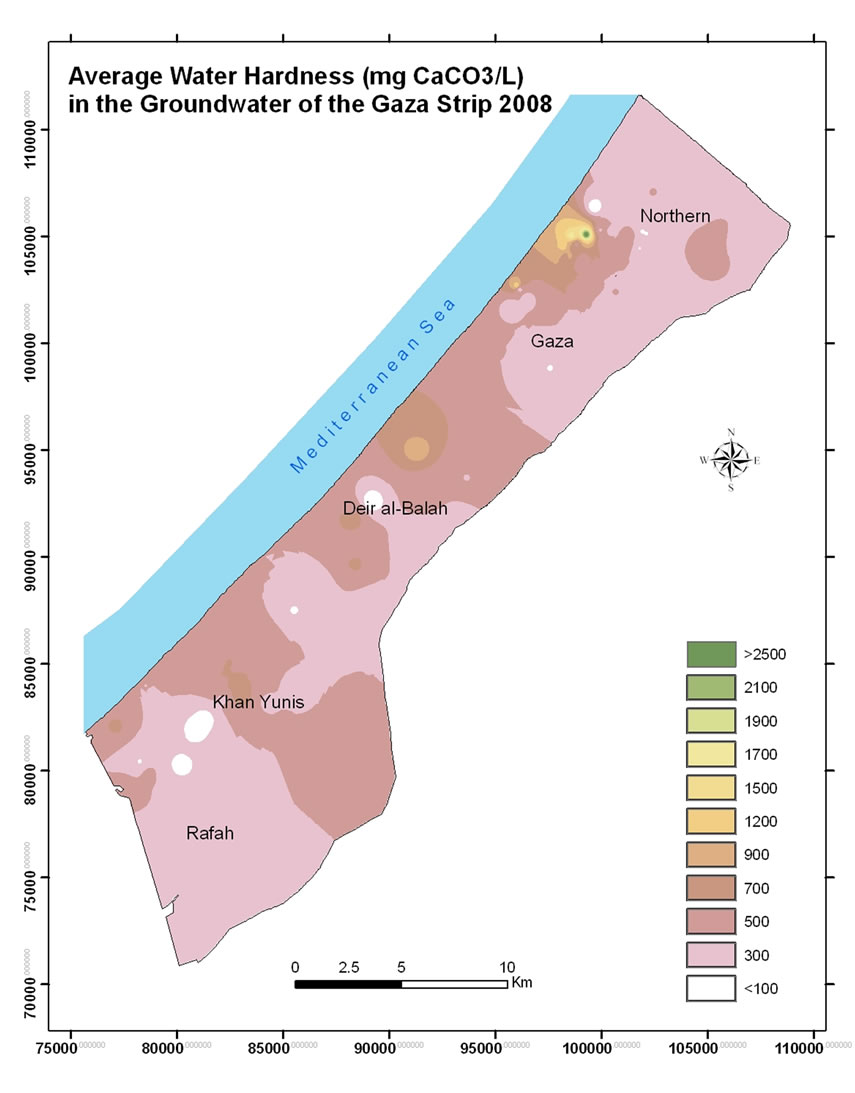
Figure 13. Groundwater hardness in the Gaza Strip 2008.
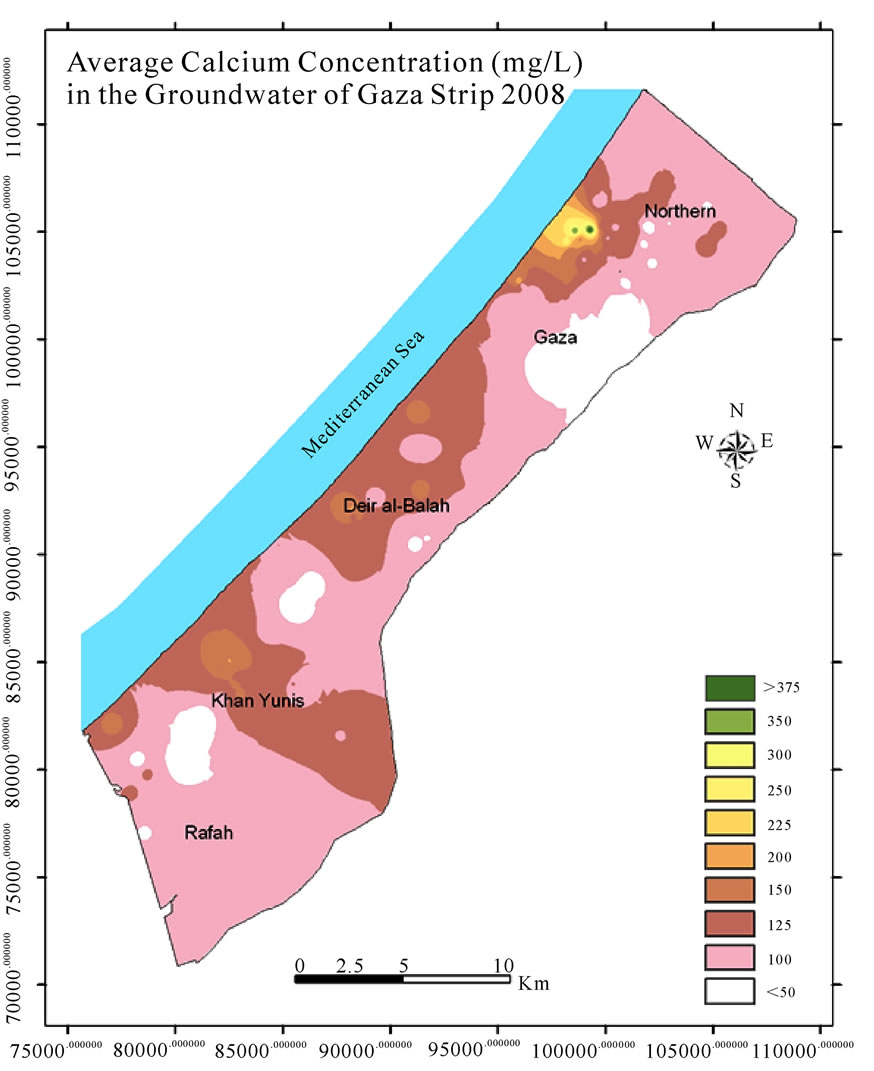
Figure 14. Calcium concentrations in the groundwater of the Gaza Strip 2008.
Dissolved calcium and magnesium in water are the two most common minerals that make water “hard”. Based on the water hardness classification of 0 to 60 mgCaCO3/L as soft, 61 to 120 mgCaCO3/L as moderately hard, 121 to 180 mgCaCO3/L as hard, and more than 180 mgCaCO3/L as very hard, most groundwater in Gaza is hard to very hard (Figure 13).
As water hardness is determined primarily by Ca2+ and Mg2+, not surprisingly, the areas with highest levels of Ca2+ and Mg2+ (Figures 14 and 15) also have the hardest water. The average concentration of Ca2+ was 93 mg/L while the average concentration of Mg2+ was 48 mg/L. Areas between Gaza and the northern region and middle region wells showed the highest levels of both Ca2+ and Mg2+ and the results were 262 and 128 mg/L, respectively.
The lowest Na+ levels were found in the north, and the highest levels were in the areas of Khan Younis and Rafah (Figure 16).
Most wells had average value of K+ that was less than 5 mg/L; however, few wells showed levels of K+ more than 15 mg/L (Figure 17).
3.9. Trace Elements (Fe, Cr and Zn)
Total concentrations of Fe, Cr and Zn were detected in all wells of the Gaza Strip at concentrations lower than

Figure 15. Magnesium concentrations in the groundwater of the Gaza Strip 2008.
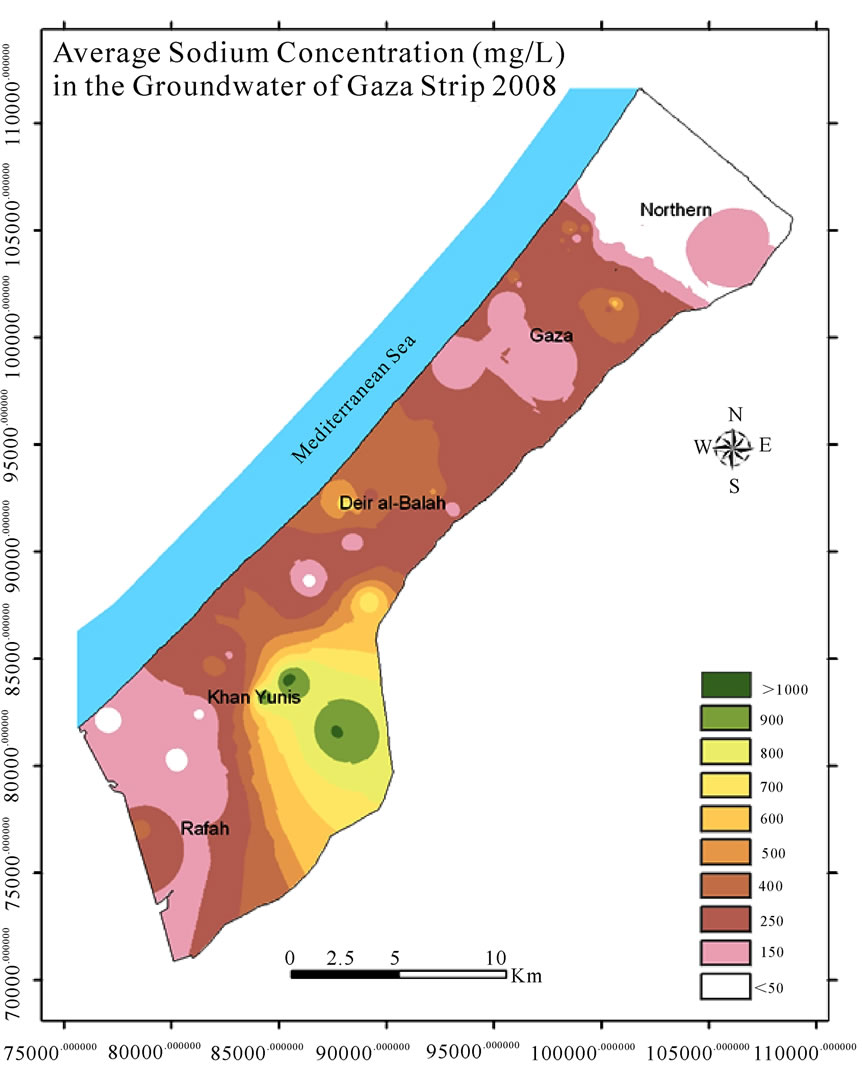
Figure 16. Sodium concentrations in the groundwater of the Gaza Strip 2008.
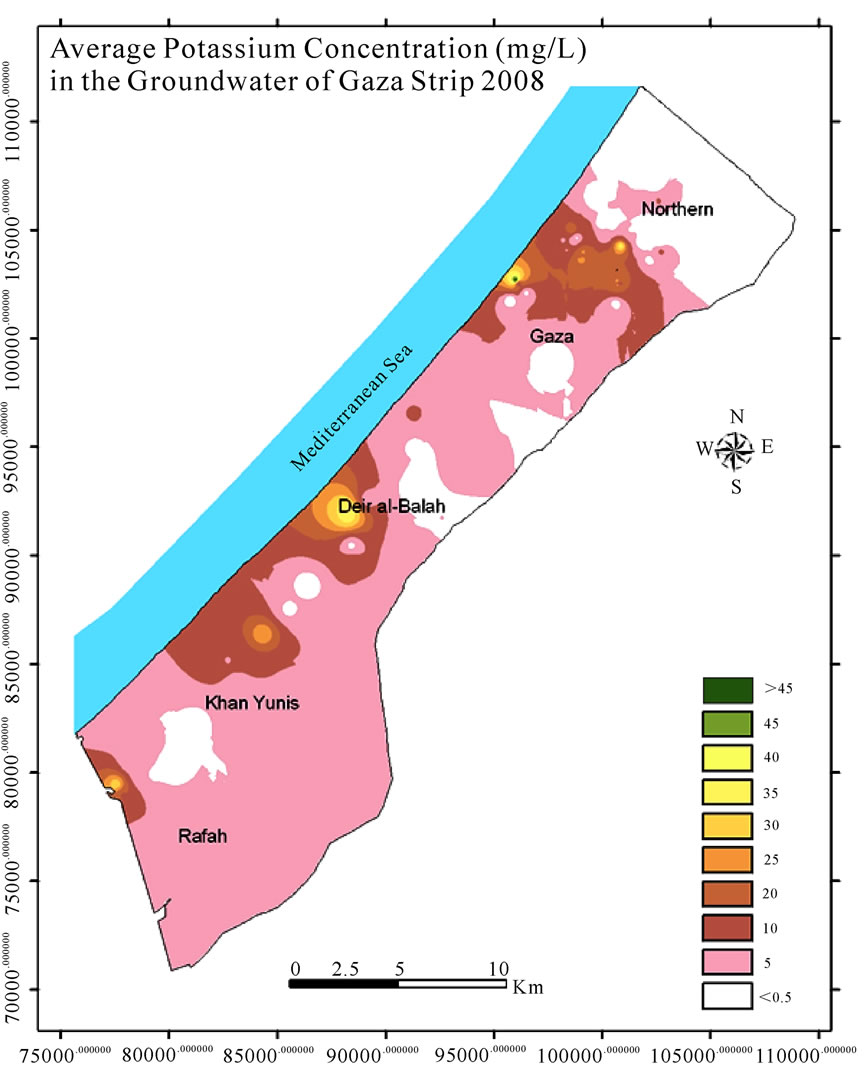
Figure 17. Potassium concentrations in the groundwater of the Gaza Strip 2008.
the WHO standards of 300, 50, and 3000 µg/L, respectively (Figures 18, 19 and 20). The average concentrations of Fe, Cr and Zn in the groundwater of Gaza were 30, 75 and 15 µg/L, respectively.
4. Discussions
Deterioration of water quality and water scarcity is perennial problems in the region. As these maps indicate, the problem is particularly acute in Gaza where all groundwater wells have at least one parameter exceeding the WHO standards and about 90% of wells have salinity exceeding the WHO standard of 250 mgCl/L. The Gaza aquifer is impacted by contaminants from seawater intrusion, wastewater, manure and natural occurrence [29,32,33]. As the maps illustrate, as one goes from north to south in Gaza, the water quality deteriorates with city of Rafah having the poorest water quality. The U.S. Census Bureau estimates that Gaza’s population is growing at about 4% per year making it among the fastest growing areas in the world [34]. The need for more water to meet the needs of the growing population, a dropping water table and significant challenges in maintaining and improving infrastructure for handling human wastes and managing agricultural and industrial pollutants sets the stage for continued deterioration.

Figure 18. Iron concentrations in the groundwater of the Gaza Strip 2008.
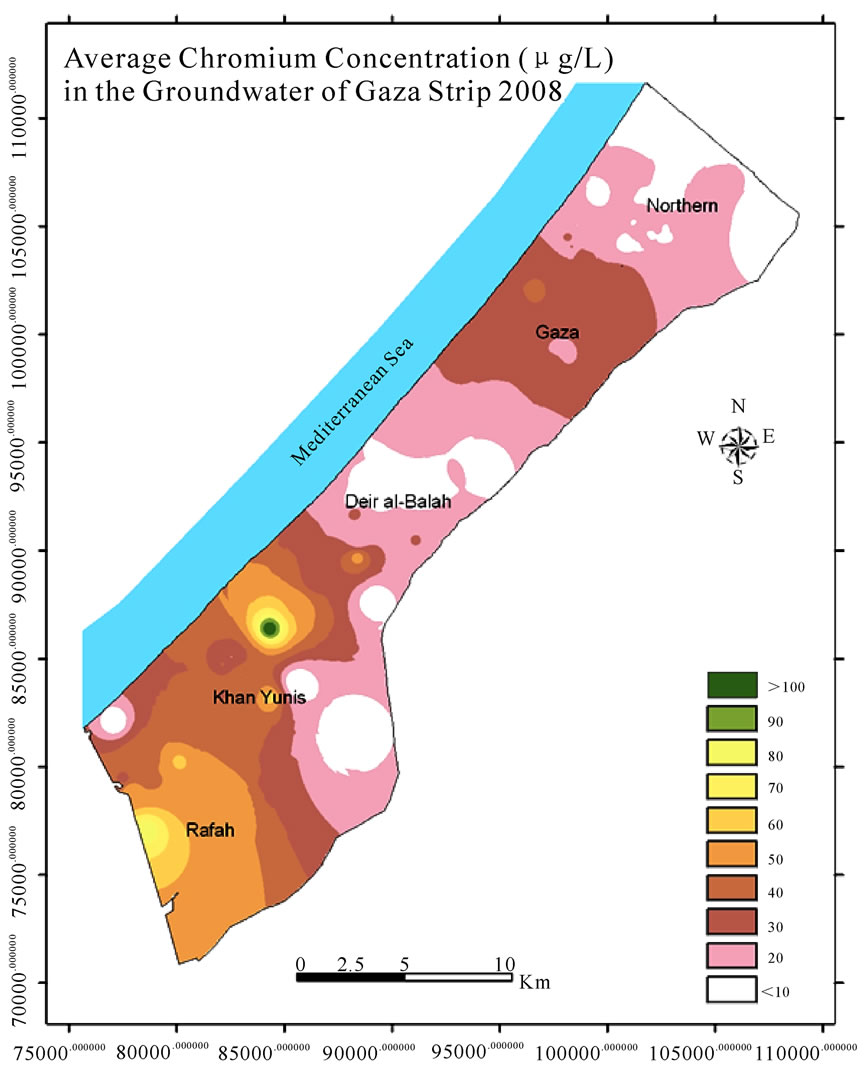
Figure 19. Chromium concentrations in the groundwater of the Gaza Strip 2008.
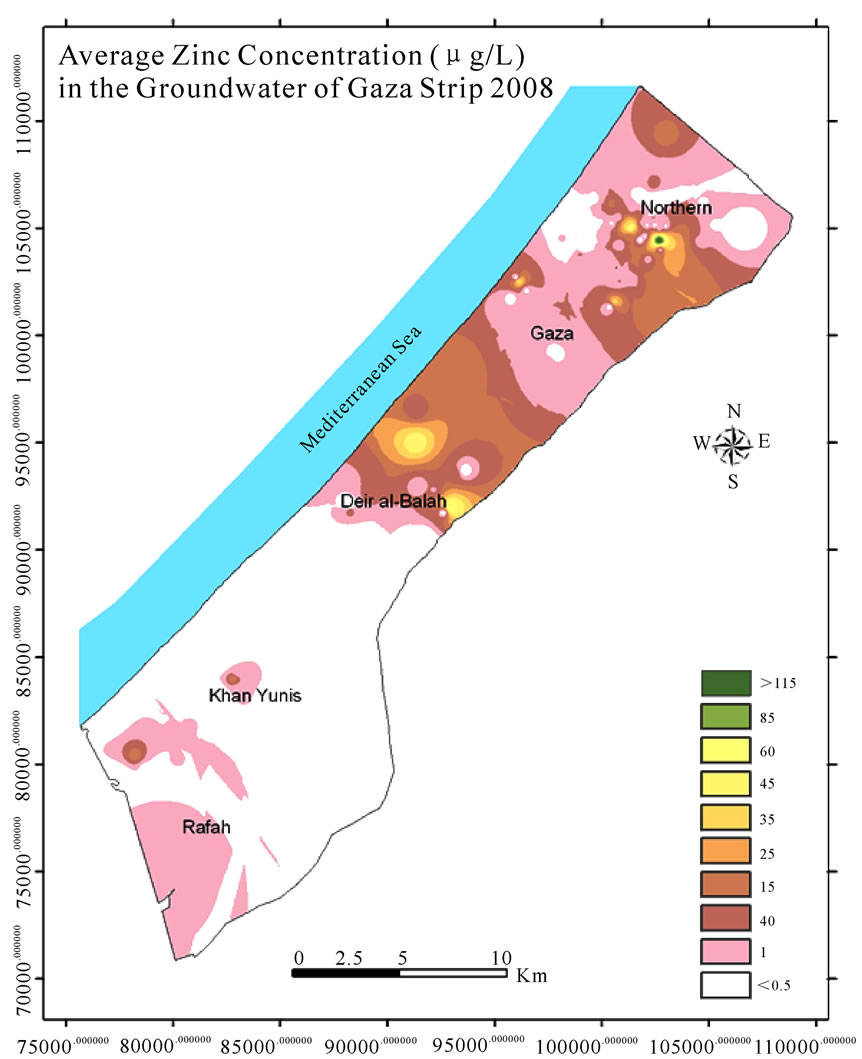
Figure 20. Zinc concentrations in the groundwater of the Gaza Strip 2008.
4.1. Land Use and Environmental Hot-Spots
The sand dunes in Gaza protect the coastal areas against the sea and have a natural water cleaning capacity. This protection, however, is diminishing due to sand being removed without permission and extensive sand quarrying practices in the Gaza Strip [13]. Currently, about 60-80% of the domestic wastewater is discharged into the environment without treatment at the source, after collection from cesspits, through the effluent of the sewer system or at the overloaded treatment plants. Gaza’s three wastewater treatment plants are outdated and overloaded with excess inflow of wastewater. For example, the largest, south of Gaza City, was designed to treat 42,000 cubic meters (CM) per day, the amount produced by 300,000 people, but now faces a daily inflow of more than 60,000 CM. As an emergency measure to prevent sewage from overflowing, barely treated wastewater is now piped to the coast, where the dark gray liquid flows along the beach. Additionally, 40% of Gazans are without access to a centralized sewage-disposal system contributing to the burgeoning cesspits. A 40-hectare lake of sewage that has formed in northern Gaza is a menace to people at the surface and to the aquifer beneath [35].
The treatment plants have been destroyed more than once as a result of the turbulent political situation. Beit Lahia wastewater treatment plant flooded in March 2007, killing several people, displacing thousands of people, and destroying homes and killing animals. Several groundwater wells in the areas surrounding the wastewater treatment plants have been closed completely due to the presence of faecal coliforms, detergents and elevated nitrate concentrations.
Solid wastes (including sludges) are disposed in dumping sites with no groundwater protection measures and elevated levels of several heavy metals were found in the agricultural wells in the eastern part of Gaza surrounding the central solid waste dumping site.
In the study of Shomar et al. [25], the water quality in the area of Wadi Gaza was seriously contaminated by several pollutants as the Wadi itself is currently polluted with wastewater and illegally dumped solid wastes.
4.2. Water Table and Groundwater Flow
Depth to water (Figure 6) indicates a regional groundwater flow direction from east to west. The most important source for recharge is the rainfall, which varies annually between 200 mm in the south and 400 mm in the north. Most of rainfall evaporates. The annual recharge varies between 20 and 40 MCM. Another 15 to 35 MCM laterally flows from the eastern boundaries of the Gaza Strip, while irrigation and leaky pipes are estimated to return 40 to 50 MCM, for a total annual recharge of 75 to 125 MCM [36]. The depth to water table generally shows a continuity of groundwater flow from east to west. Lateral inflow is important to the overall water balance in the Gaza Strip. The amounts of lateral inflow and outflow are subject to annual change due to varying hydrogeological parameters and human activities, such as rainfall and pumping [33]. However, average annual groundwater lateral inflow and outflow can be estimated based on different approaches. Since the groundwater level for the area of study is monitored monthly, a groundwater level contour map was created based on the data of the years 2006-2008.
4.3. Groundwater Quality
The groundwater aquifer’s only natural output is the eight MCM per year that should flow into the Mediterranean, providing a crucial barrier against the intrusion of seawater. Thus, if no more than about 100 MCM were tapped from the aquifer per year, it could last indefinitely. But Gaza’s 4000 wells remove as much as 160 MCM yearly. This estimated 60 MCM annual water deficit is why the water table is dropping rapidly and currently reaches 13 meters below sea level in some places. Saltwater from the Mediterranean, as well as deeper pockets of brine in the aquifer itself, flow in to fill the gap. As shown in Figure 9 (chloride concentrations), the saltwater intrusion is well under way in much of the region with “hot spots” in the coastal areas and to the south.
The occurrence of saline (brackish) water in both the south and east is most likely due to the fact that the annual rainfall in the south is lower than that in the north (200 and 400 mm, respectively). Also, the unconfined nature of parts of the aquifer in the Gaza Strip suggests an open system (unconfined) for the natural recharge, especially in the dunes area along the Mediterranean coast [32]. The other parts of the aquifer are of a confined to semi-confined nature [33]. Although the structural geology, which may play a significant role in this regard, is neither well documented nor well understood, hydrogeological barriers are assumed to be present, especially in the middle of the Gaza Strip. These barriers separate the two chemical facies in the north and south [37].
Since most of the wells do not meet all the WHO standards for drinking water, the water in Gaza is currently not suitable for drinking. The accelerating rate of saltwater intrusion [33] alone could make the Gaza aquifer unusable for agriculture, industrial and domestic nondrinking water uses within two or three decades. But there may be far less time available. The aquifer is also being contaminated with a cocktail of pollutants from Gaza’s sewage and agriculture [26,35]. Given the large numbers of groundwater pollutants, an integrated approach to managing water resources is essential. Such an approach would include conservation, land use regulation, and control of human waste and agricultural and industrial pollutants.
5. Conclusions
1) No groundwater in Gaza meets all WHO drinking water standards and is, therefore, not safe for human consumption.
2) Areas of high nitrate concentrations are found in the vicinity of wastewater discharging areas, solid waste dumping sites and Wadi Gaza. Chloride is elevated in the coastal areas as a result of seawater intrusion and in the eastern areas as a result of upcoming and over pumping. Areas naturally contaminated with high concentrations of F-, Ca2+, Mg2+ and SO42- occur as expected due to the underlying soil chemistry, geology and hydrogeology.
3) Integrating environmental and related data using GIS and using maps to illustrate areas of contamination can facilitate the development of an integrated approach toward groundwater protection in Gaza. Minimally, such an approach needs to include management of land use, wastewater and solid waste disposal, monitoring groundwater contamination, and regulating groundwater use.
4) Geography, politics, and war are conspiring to make the Gaza Strip a worst-case scenario for water-resource planners. Without immediate action, water that is currently unfit for human consumption will not be suitable for other uses likely.
6. Acknowledgments
This research was funded by Bundesministerium für Bildung und Forschung-BMBF, Germany through a project 02WT0534. The authors thank Prof. W. Shotyk, Prof. P. Outridge and Dr. Juliet VanEenwyk for their critical reading and comments on the manuscript. Special thanks to Mr. Naim Khatib for his support.
REFERENCES
- H. Assaf and M. Saadeh, “Assessing water quality management options in the Upper Litani Basin, Lebanon, using an integrated GIS-based decision support system,” Environmental Modeling & Software, Vol. 23, pp. 1327–1337, 2008.
- V. Merwade, A. Cook, and J. Coonrod, “GIS techniques for creating river terrain models for hydrodynamic modeling and flood inundation mapping,” Environmental Modeling & Software, Vol. 23, pp. 1300–1311, 2008.
- U. Walz, “Monitoring of landscape change and functions in Saxony (Eastern Germany): Methods and indicators,” Ecological Indicators, Vol. 8, pp. 807–817, 2008.
- I. Yilmaz, “A case study for mapping of spatial distribution of free surface heave in alluvial soils (Yalova, Turkey) by using GIS software,” Computers & Geosciences, Vol. 34, pp. 993–1004, 2008.
- C. Zhang, L. Luo, W. Xu, and V. Ledwith, “Use of local Moran’s I and GIS to identify pollution hot-spots of Pb in urban soils of Galway, Ireland,” Science of the Total Environment, Vol. 398, pp. 212–221, 2008.
- S. Asadi, P. Vuppala, and M. Anji Reddy, “Remote sensing and GIS techniques for evaluation of groundwater quality in municipal corporation of Hyderabad (Zone-V), India,” International Journal of Environmental Research and Public Health, Vol. 4, pp. 45–52, 2007.
- D. Ducci and G. Tranfaglia, “Effects of climate change on groundwater resources in Campania (Southern Italy),” Climate Change and Groundwater, Geological Society, Special Publications, London, Vol. 288, pp. 25–38, 2008.
- D. Ducci, G. De Masi, and G. Delli Priscoli, “Contamination risk of the Alburni Karst System (Southern Italy),” Engineering Geology, Vol. 99, pp. 109–120, 2008.
- A. Enshassi, “Environmental concerns for construction growth in Gaza Strip,” Building and Environment, Vol. 35, pp. 273–279, 2000.
- B. Shomar, A. Yahya, and G. Müller, “Occurrence of pesticides in the groundwater and the topsoil of the Gaza Strip,” Water Air Soil Pollution, Vol. 171, pp. 237–251, 2006.
- S. Abu Amr and M. Yassin, “Microbial contamination of the drinking water distribution system and its impact on human health in Khan Younis Governorate, Gaza Strip: Seven years of monitoring (2000–2006),” Public Health (in Press), 2008.
- K. Alsharif, E. Feroz, A. Klemer, and R. Raab, “Governance of water supply systems in the Palestinian Territories: A data envelopment analysis approach to the management of water resources,” Journal of Environmental Management, Vol. 87, pp. 80–94, 2008.
- GCMEPMP, “Gaza coastal and marine environmental protection and management plan,” Palestine: Ministry of Environmental Affairs, Jerusalem, pp. 1–112, 2001.
- L. Hamdan, M. Zarei, R. Chianelli, and E. Gardner, “Sustainable water and energy in Gaza Strip,” Renew Energy, Vol. 33, pp. 1137–1146, 2008.
- B. Shomar, “Groundwater of the Gaza Strip: Is it drinkable?” Environmental Geology, Vol. 50, pp. 743–751, 2006.
- PCBS, “Population, Housing and Establishment Census 2007,” Palestinian National Authority, Palestinian Central Bureau of Statistics, Ramallah, Palestine, 2007.
- Accessible at: http://www.pcbs.gov.ps/
- PEPA, “Gaza Environmental Profile,” Inventory of Resources: Part One, Gaza, Palestine: Palestinian Environmental Protection Authority, Gaza, Palestine, pp. 1–21, 1994.
- MEnA, “Palestinian Environmental Strategy-Main Report,” October. Gaza, Palestine: Ministry of Environmental Affairs, Gaza, Palestine, pp. 1–94, 2000.
- J. J. Carrera-Hernández and S. J. Gaskin, “The Basin of Mexico Hydrogeological Database (BMHDB): Implementation, queries and interaction with open source software,” Environmental Modeling & Software, Vol. 23, pp. 1271–1279, 2008.
- B. Shomar, A. Yahya, and G. Müller, “Potential use of treated wastewater and sludge in the agricultural sector of the Gaza Strip,” Journal of Clean Technologies and Environmental Policy, Vol. 6, pp. 128–137, 2004.
- B. Shomar, A. Yahya, G. Müller, S. Askar, and R. Sansur, “Fluorides in groundwater, soil and infused-black tea and the occurrence of dental fluorosis among school children of the Gaza Strip,” Journal of Water and Health, Vol. 2, pp. 23–36, 2004.
- B. Shomar, “Inorganic and organic environmental geochemical issues of the Gaza Strip-Palestine,” Shaker Verlag, ISBN 3-8322-3845-X, Aachen, Germany, 2005.
- B. Shomar, G. Müller, and A. Yahya, “Geochemical features of topsoils in the Gaza Strip: Natural occurrence and anthropogenic inputs,” Environmental Research, Vol. 98, pp. 372–382, 2005.
- B. Shomar, A. Yahya, and G. Müller, “Chemical characterization of soil and water from a wastewater treatment plant in Gaza,” Soil and Sediment Contamination, Vol. 14, pp. 309–327, 2005.
- B. Shomar, A. Yahya, and G. Müller, “Seasonal variations of chemical composition of water and bottom sediments in the wetland of Wadi Gaza, Gaza Strip,” Journal of Wetlands Ecology and Management, Vol. 13, pp. 419–431, 2005.
- B. Shomar, “Trace elements in major solid-pesticides used in the Gaza Strip,” Chemosphere, Vol. 65, pp. 898–905, 2006.
- B. Shomar, “Sources of Adsorbable Organic Halogens (AOX) in Sludge of Gaza,” Chemosphere, Vol. 69, pp. 1130–1135, 2007.
- B. Shomar, “Water and wastewater in the Gaza Strip: environmentally as hot as politically,” Zeitschrift für Geologische Wissenschaften, Vol. 35, pp. 165–176, 2007.
- B. Shomar, K. Osenbrück, and A. Yahya, “Elevated nitrate levels in the groundwater of the Gaza Strip: Distribution and sources,” Science of the Total Environment, Vol. 398, pp. 164–174, 2008.
- B. Shomar, “Sources and build up of Zn, Cd, Cr and Pb in the sludge of Gaza,” Environmental Monitoring and Assessment, Vol. 155, pp. 51–62, 2009.
- B. Shomar, “Gaza Strip: Politics and environment,” Water Policy (in Press), 2009.
- M. Al-Agha, “Hydrogeochemistry and carbonate saturation model of groundwater, Khan Younis Governorate-Gaza Strip, Palestine,” Environmental Geology, Vol. 47, pp. 898–906, 2005.
- H. Baalousha, “Using CRD method for quantification of groundwater recharge in the Gaza Strip, Palestine,” Environmental Geology, Vol. 48, pp. 889–900, 2005.
- USCB, “U.S. Census Bureau, International Data Base, 2008,” Accessible at: www.census.gov/ipc/www/idbnew. html
- J. Bohannon, “Running out of water and time: Geography, politics, and war combine to make the Gaza Strip a worst-case scenario for water-resource planners,” Science, Vol. 313, pp. 1085–1087, 2006.
- CAMP, “Site, Geotechnical and hydrogeological investigation at the infiltration basins of Gaza wastewater treatment plant,” Gaza Coastal Aquifer Management Program, Gaza, Palestine, 2002.
- M. AL-Agha and H. EL-Nakhal, “Hydrochemical facies of groundwater in the Gaza Strip, Palestine,” Hydrological Sciences, Vol. 49, pp. 359–371, 2004.