World Journal of Vaccines
Vol.4 No.3(2014), Article
ID:48503,3
pages
DOI:10.4236/wjv.2014.43012
Avoiding the Will O’ the Wisp: Challenges in Measuring High Levels of Immunization Coverage with Precision
David W. Brown1*, Anthony H. Burton2, Griffith Feeney3, Marta Gacic-Dobo2
1United Nations Children’s Fund, New York, USA
2World Health Organization, Geneva, Switzerland
3Scarsdale Solutions, New York, USA
Email: *dbrown@unicef.org
Copyright © 2014 by authors and Scientific Research Publishing Inc.
This work is licensed under the Creative Commons Attribution International License (CC BY).
http://creativecommons.org/licenses/by/4.0/


Received 26 May 2014; revised 25 June 2014; accepted 24 July 2014
ABSTRACT
There have been tremendous improvements in immunization coverage since the Expanded Programme on Immunization was launched. We highlight inherent challenges in measuring immunization coverage with precision as coverage levels increase due to the sensitivity of coverage to the accuracy of target population estimates. In fact, when comparing across groups at high levels of coverage, error in target population estimates can obscure differences in immunization coverage.
Keywords:Immunization, Vaccination, Coverage, Population, Precision

When the Expanded Programme on Immunization was launched in 1974, less than 5% of the world’s children were immunized during their first year of life against polio, diphtheria, tuberculosis, pertussis, measles and tetanus [1] . Since that time, the successes of the Expanded Programme on Immunization have led to tremendous improvements in immunization coverage. Below we highlight that, even in the presence of perfect recording and monitoring of the number of children vaccinated, there are inherent challenges in measuring immunization coverage with precision as coverage levels increase due to the sensitivity of coverage to the accuracy of target population estimates.
Immunization coverage levels are presented as the percentage of a target population that has been vaccinated. Estimated target populations, particularly projections of future population size, are complex computations and carry uncertainty, often the result of less reliable data on the current population size and birth and death rates [2] [3] . Target population estimates at the global and regional levels involve less uncertainty than that at a country level as errors at the country level tend to offset each other when aggregated [3] . Target population estimates for younger and older age groups are much less certain than that for middle age groups, often because of incorrect assumptions about fertility and/or mortality which if biased may have a greater impact at younger and older ages [3] . Incorrect assumptions about migratory patterns of populations are also a concern.
The Table 1 and Figure 1 below show the sensitivity of immunization coverage to errors in target population estimates with increasing levels of immunization coverage (Ceteris paribus). In doing so, it is assumed that recording and monitoring of the number of children vaccinated is perfect; that is, there is no error in the numerator. Column (2) shows the true target population numbers for a hypothetical population in six different settings (e.g., countries). The results of this exercise do not depend on population size, so this is fixed at 100 children in each location. Column (3) shows the range of estimates of the true target population corresponding to an error of 10%. Column (4) shows hypothetical numbers of children vaccinated to give the true coverage rates shown in Column (5). Column (6) shows the range of coverage estimates based on the number of children vaccinated in Column (4) and the range of target population estimates in Column (3).
A review of the Table 1 shows that when true coverage is 50% (Country C), for example, 50 of the 100 children in the target population are vaccinated, but coverage calculated from the estimated target population may be as low as 45% (50/110) or as high as 56% (50/90), the range shown in Column (6). Plots of the error ranges in Column (6) are displayed in the Figure 1 as vertical error bars (in blue colour) around the true cover

Table 1. Effect of errors in target population estimates on estimated immunization coverage levels.
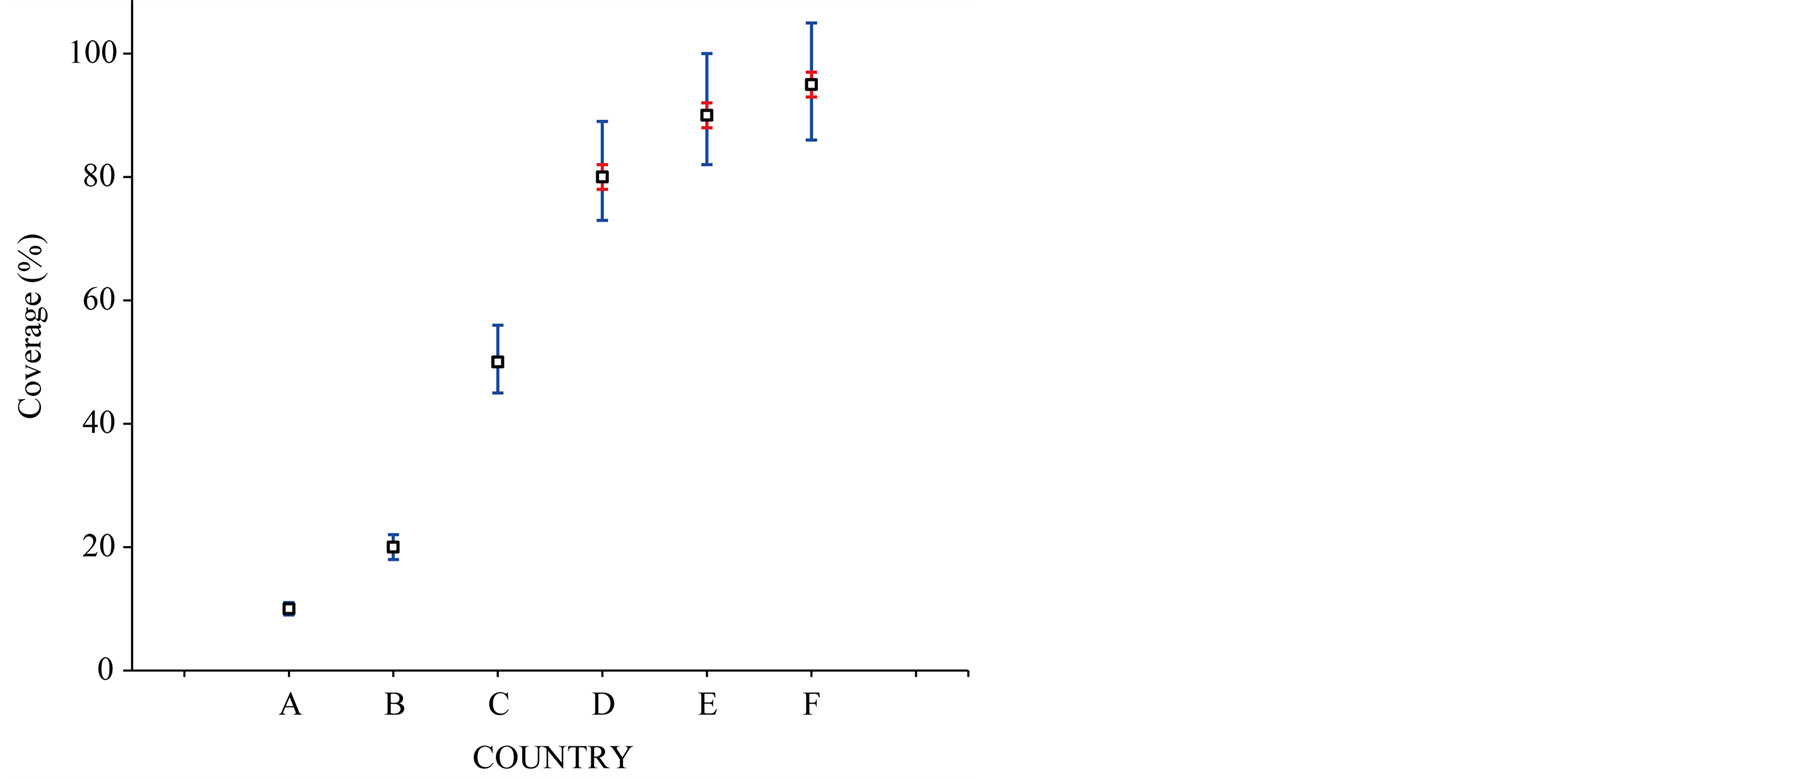
Figure 1. Effect of 10% error in target population estimates on estimated immunization coverage.
age estimate for each country. The error range in coverage, represented by the height of the error bars in Figure 1, increases steadily with increasing coverage levels. When one looks at the upward trend in coverage across countries in the Figure 1, coverage level increases from 10% to 20% which are not obscured by the error in the target population estimate. The same is true as coverage rises to 50% and then to 80%. However, at higher levels of coverage, such as when comparing coverage in Country D at 80% to that in Country E at 90%, the error in the target population estimate obscures the difference in immunization coverage. That is, estimated coverage for Country D might be as high as 89% (last column of Table 1), while estimated coverage for Country E might be as low as 82%.
How accurate must target population estimates be to reliably identify changing immunization coverage when coverage levels are high? In this example, target population estimates accurate to ±2% imply the estimated coverage errors shown by the second set of error bars (in red colour) in the Figure 1, shown for 80% (Country D), 90% (Country E) and 95% (Country F) coverage only. This second set of error bars is roughly equivalent, for the purpose of identifying changes in coverage, to the error bars shown for 10% (Country A) and 20% (Country B) coverage levels. Unfortunately, an expectation of attaining ±2% error or less in target population size at a country level, not to mention age-specific values (e.g., surviving infants), is likely unreasonable for many, if not most, countries.
The open and public debate around, and demand for “better” data on immunization system performance, particularly immunization coverage data, has never been greater in today’s cost conscious, resource constrained environment. The issue of immunization system related data quality is a frequent agenda item of global, regional and national immunization programme meetings, and it has been highlighted by the Strategic Advisory Group of Experts (SAGE) on Immunization (www.who.int/immunization/sage) as a critical issue restraining effective evaluation of global progress [1] . As pressures mount for further improvements in coverage beyond the 80% - 85% levels, as is being pursued as part of the Decade of Vaccines and Global Vaccine Action Plan [4] , and year-to-year changes in coverage are scrutinized ever more closely, avoiding the will o’ the wisp of high immunization coverage levels due to the inherent limitations noted above will require greater awareness and attention. Moreover, an improved understanding is necessary about the conditions under which the empirical input data were produced including assumptions made, variations in data completeness, and different sources of error that may exist (both random and systematic). As noted in a recent discussion on development statistics [5] , perhaps the demands for better data on immunization programme performance should be tempered, at least in some instances, by an appreciation for the inherent limitations of quantification.
Disclaimer
The findings and views expressed herein are those of the authors alone and do not necessarily reflect those of their respective institutions.
References
- Bland, J. and Clements, J. (1998) Protecting the World’s Children: The Story of WHO’s Immunization Programme. World Health Forum, 19, 162-173.
- Siegel, J.S. and Swanson, D.A. (2004) The Methods and Materials of Demography. 2nd Edition, Elsevier Science & Technology, San Francisco, USA.
- Population Reference Bureau. (2001) Understanding and Using Population Projections. Washington, DC. http://www.prb.org/pdf/UnderStndPopProj_Eng.pdf on 30 April 2014
- Global Vaccine Action Plan, 2011-2020. http://www.who.int/immunization/global_vaccine_action_plan/GVAP_doc_2011_2020/en/
- Jerven, M. (2013) Poor Numbers: How We Are Misled by African Development Statistics and What to Do about It. Cornell University Press, Ithaca, NY and London.
NOTES

*Corresponding author.