World Journal of Mechanics
Vol.08 No.06(2018), Article ID:85230,8 pages
10.4236/wjm.2018.86017
Fatigue Strength of Laser Welded Joints of PP and PC Components
Vlastimil Votrubec, Pavel Hisem, Lenka Vinšová, Gabriela Benešová
Department of Computations and Modelling, VÚTS, a.s., Liberec, Czech Republic

Copyright © 2018 by authors and Scientific Research Publishing Inc.
This work is licensed under the Creative Commons Attribution International License (CC BY 4.0).
http://creativecommons.org/licenses/by/4.0/


Received: April 2, 2018; Accepted: June 10, 2018; Published: June 13, 2018
ABSTRACT
The paper describes research of fatigue properties of laser welded joints of PP and PC reinforced composites. Welded specimens were tested on dynamic testing machine to obtain data for fatigue strength and fatigue life evaluation. Materials used for testing were PP and PC plastics filled with various amounts of glass fibers. Nine combinations of PP specimens and 6 combinations of PC specimens were welded and loaded on testing machine by fluctuating stress with constant stress ratio. Presented results include fatigue strength of welded joints and also the S-N curves based on experimental data and theory are derived.
Keywords:
Fatigue Strength, Welded Joints, Laser Welding, Reinforced Plastics

1. Introduction
The research of fatigue properties of welded joints is mainly aimed at metal materials. However, welding of plastics and composites is recently more frequent due to extensive growth of plastic welding applications. Fusion bonding of pure thermoplastics is well known and commonly applied welding process but the process parameters can’t be used for reinforced thermoplastics welding [1] [2] . There are several basic techniques of fusion bonding: frictional welding, ultrasonic welding [3], resistance welding [4], induction welding, infrared welding and laser welding.
Significant disadvantage of welded joints testing is missing standardized method. Therefore, sometimes the comparison of research results can be difficult. However, there exist commonly used methods for examining the weld joint strength from which the lap shear strength test is the most commonly chosen experimental setup [5] .
Fatigue behavior of reinforced composite welded joints is still object of research and the literature doesn’t cover this field fully [6] [7] . There is much blank space for studying and that is also a motivation. Besides the fatigue strength research, the object of interest was to survey the influence of filling of glass fibers on the welded joint strength.
In this paper, which follows on the older studies [8], the laser welded process is used to bond glass reinforced polypropylene (PP) and polycarbonate (PC). Fatigue strength of welded joints is measured by the lap shear strength test method. The composite materials, welding parameters and testing methods are described in the next paragraph. Next, the fatigue tests are evaluated, and results are discussed, and the S-N curves are derived. Finally, some conclusions are suggested.
2. Materials Welding and Methods
The inspected materials were multi-directional short glass fiber reinforced PP and PC. The volume ratio of the filler was 0%, 20% and 40% for PP plastics and 0%, 15% and 30% for PC plastics. The specimens for experimental tests were cut from the plate produced by injection molding.
Laser welding requires one material to be transparent so the light beam gets through to the non-transparent material working as an absorber of the light. Although jointing of two transparent composites is possible if special conditions are fulfilled, common method is adding of darkening absorbers additives, usually carbon black. These additives slightly change material properties. Here, the absorbing material is marked by letter A (absorber), the transparent material is marked by letter T (transparent). The term ahead of the letter T or A means the volume ratio of glass fiber in the composite (in percentage). In total 15 material combinations of 10 specimens for each combination were welded (Table 1). The combination with PC GF30T couldn’t be welded on the laser station due to unrealizable conditions.
The lap shear strength test was proposed as a tensile test of two welded overlapped pieces of material. Figure 1 shows the scheme of welded specimen. Dimensions of the welded bars were 120 × 20 × 2 mm, 1 mm continual wide weld was produced in the middle of 20 mm long overlap.
Specimens for cyclic tests were welded on laser station LM05/05P.W. Both parts were pressed to the base by a tool that consisted of four pneumatic cylinders

Table 1. Combinations of materials for shear tests. The letter T means transparent material, letter A means absorbing material and number after GF the volume fraction of glass fibers (in percentage).

Figure 1. The scheme of welded materials for shear test.
ensuring adequate contact pressure between the welded bars. A longitudinal hole in the middle of the tool let the laser beam through. Laser station ready to welding process is in Figure 2.
Settings of welding parameters were quite demanding because the weld joints need to be thin as the preliminary tests have shown that larger welds have higher strength than the material itself. The presence of glass fibers also complicated the welding process because the laser beam was dispersed by the fibers. Welding parameters were unique for each combination of welded materials to achieve a good weld joint. Nevertheless the weld area differs for each specimen and had to be evaluated after every single shear test. Examples of welded specimens are in Figure 2.
All tests were performed on a hydraulic Instron Electropuls E3000 testing machine. Cyclic loading frequency was set to 20 Hz, which is near to the maximal frequency that the machine can control for this method. The mean and amplitude value of cyclic loading was chosen to have constant stress ratio R = σmin/σmax = 0.1. The attempt was focused on fatigue strength measure at the two million cycles. Since the real weld area was unknown before the test it was difficult to estimate proper values. Therefore it happened that some specimens have broken early (if the weld area was smaller than expected) and some specimens not even after five million cycles (if the weld area was larger than expected).
3. Experiments
The input data to the testing machine were mean and amplitude values of loading force so the weld joint strength was calculated as a division of maximum loading force and measured weld area. The weld area was evaluated by tools of

Figure 2. Laser station with specimen attached in the tool ready to welding process (letter a), examples of separated parts of welded specimens after the static test under the microscope for PP GF00T-GF00A (letter b) and GF20T-GF40A (letter c) are on the right.
an image processing from an image obtained by a microscope. If the weld joint didn’t rupture during the test the specimen was broken on a static testing machine for subsequent weld area measurement.
The graphical representation of measured data in semi-logarithmical coordinates is in Figure 3. There are shown only six graphs due to saving the space. The present stress corresponds to a shear stress.
4. Discussion
It is obvious that the variance of measured values is large and interpretation of the tests is difficult. Direct determination of fatigues strength and life isn’t possible, even not according to the standards of similar problems. Here, the fatigue strength is defined for 2 million cycles where most of the tests were finished. The value of fatigue strength was given as an average of the minimal strength of disrupted specimens and the maximal strength of undamaged specimens. If undamaged specimens didn’t exist, the fatigue strength was assessed from the lowest measured strength. Table 2 summarized the static and fatigue strength of reinforced PP and PC weld joints. Two sets of measured PC combinations couldn’t be evaluated because of bad results of the tests.
Fatigue strength just as the static strength is similar for all combinations of welded PP and PC welded joints. The weld joint strength doesn’t depend on the volume ratio of the glass fibers. The fatigue strength is approximately half to the static strength and roughly 25% - 33% to the material tensile strength of PP. Also the fatigue strength of PP weld joints is twice higher than the fatigue strength of


Figure 3. Weld joint stress at specimens rupture after N cycles (orange), stress of intact specimen after the stopping the test (green) and static strength of weld joints (blue) for selected sets of material combinations. Four upper graphs relate to PP reinforced composites and two lower graphs relate to PC reinforced composites.
Table 2. Static and fatigue strength of reinforced PP and PC composites weld joints for cyclic shear loading with stress ratio R = 0.1.
PC weld joints although the tensile strength of PC is bigger than tensile strength of PP.
The amount of tests and their quality doesn’t allow to construct S-N curves using the linear regression method. However the S-N curves can be approximately described by analytical equation
(1)
where N is a number of cycles, Δσ is a range of loading stress and m is a tangent of the line in bi-logarithmical coordinates. Parameters m and C are usually empirically defined only for the most frequent materials, in other cases they need to be guessed.
Parameters of weld joints S-N curves were determined so that the curves went through the measured data and the evaluated fatigue strength in compliance with Table 2. In several cases the S-N curve is a constant function equal to fatigue strength value or it couldn’t be even created due to lack of relevant data. Parameters are shown in Table 3.
Small slope of S-N curves isn’t unexpected; this behavior is for composite materials typical. Large decrease of weld joint fatigue is quite unusual as the common drop of fatigue strength is about 10% [9] . Selected S-N curves graphs based on the Equation (1) and parameters stated in Table 3 are shown in Figure 4. The S-N curve is displayed in interval 104 - 107 cycles for PP composites and 105 - 106 cycles for PC composites.
5. Conclusion
The purpose of described work was research of fatigue properties of reinforced PP and PC welded joints with various volume ratios of glass fibers. A lot of cyclic tests on a testing machine were performed to obtain relevant data for determining fatigue strength and S-N curves. The results of shear tests prove that the fatigue strength of PP reinforced composite weld joints is approximately half to their static strength (one tenth for PC). The fatigue strength of weld joints reaches only one quarter of PP strength and one twentieth of PC strength. The presence of glass fibers inside the polymer matrix doesn’t increase neither the static strength, nor the fatigue strength of weld joints. The fatigue strength of PP
Table 3. Parameters of analytical S-N curves shown in Figure 4. The symbol * means that corresponding S-N curve is a constant function equal to the fatigue strength.


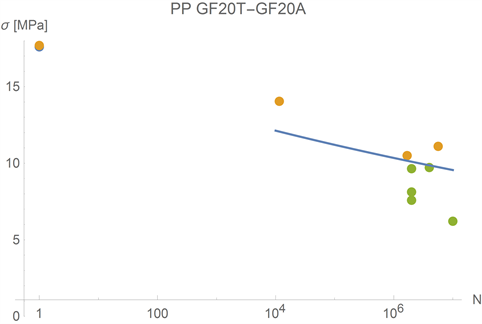


Figure 4. S-N curves of PP (four upper graphs) and PC (two lower graphs) composite weld joints for cyclic shear loading with stress ratio R = 0.1. Orange points mean the moment of the specimens rupture, green points mean the moment when the test was ended and the weld area measured, green points mean static strength of the weld joint.
weld joints is higher than the fatigue strength of PC weld joints despite the higher strength of PC plastics. The S-N curves were derived for designing weld joints. With regard to large variances of measured data and behavior of weld joints during the experiments, it is necessary to design the joints with major safety.
Acknowledgements
The publication was created with the support of the project LO1213―Excellent Engineering Research, the grantor―MŠMT, beneficiary-VÚTS, a.s., in support of the National Sustainability Program, with the financial contribution of the Ministry of Education, Youth and Sports of the Czech Republic.
Cite this paper
Votrubec, V., Hisem, P., Vinšová, L. and Benešová, G. (2018) Fatigue Strength of Laser Welded Joints of PP and PC Components. World Journal of Mechanics, 8, 219-226. https://doi.org/10.4236/wjm.2018.86017
References
- 1. Yousefpour, A., Hojjati, M. and Immarigeon, J.P. (2004) Fusion Bonding/Welding of Thermoplastic Composites. Journal of Thermoplastic Composite Materials, 17, 303-309.
- 2. Da Costa, A.P., et al. (2012) A Review of Welding Technologies for Thermoplastic Composites in Aerospace Applications. Journal of Aerospace Technology and Management, 4, 256-265. https://doi.org/10.5028/jatm.2012.040303912
- 3. Fernandez, I. and Bersee, H.E.N. (2010) Ultrasonic Welding of Advanced Thermoplastic Composites: An Investigation of Energy Directing Surfaces. Advances in Polymer Technology, 29, 112-121. https://doi.org/10.1002/adv.20178
- 4. Stavrov, D. and Bersee, H.E.N. (2005) Resistance Welding of Thermoplastic Composites—An Overview. Composites Part A—Applied Science and Manufacturing, 36, 39-54. https://doi.org/10.1016/S1359-835X(04)00182-4
- 5. Broughton, W.R., Mera, R.D. and Hinopoulos, G. (1999) Cyclic Fatigue Testing of Adhesive Joints. NPL Report CMMT(A) 191, National Physical Laboratory, UK.
- 6. De Baere, I., et al. (2012) Fatigue Behavior of Infrared Welded Joints in Fibre Reinforced Thermoplastics. Proceedings of 10th International Conference on Durability of Composite Systems, Ghent University, Ghent.https://biblio.ugent.be/publication/2988951
- 7. Dubé, M., et al. (2008) Fatigue Performance Characterization of Resistance-Welded Thermoplastic Composites. Composites Science and Technology, 68, 1759-1765.https://doi.org/10.1016/j.compscitech.2008.02.012
- 8. Votrubec, V., et al. (2017) Strength of Laser Welded Joints of Polypropylene Composites. IOP Conference Series: Materials Science and Engineering, 264.http://iopscience.iop.org/article/10.1088/1757-899X/264/1/012015
- 9. Gay, D. (2014) Composite Materials: Design and Applications. 3rd Edition, CRC Press, Boca Raton. https://www.crcpress.com/Composite-Materials-Design-and-Applications-Third-Edition/Gay/p/book/9781466584877#googlePreviewContainer