World Journal of Mechanics
Vol. 3 No. 3 (2013) , Article ID: 32591 , 7 pages DOI:10.4236/wjm.2013.33013
Three-Dimensional Stress Concentration Factor in Finite Width Plates with a Circular Hole
Coordenação dos Programas de Pós-Graduação de Engenharia, Post-Graduate School of Engineering, Federal University of Rio de Janeiro, Rio de Janeiro, Brazil
Email: murilo@oceanica.ufrj.br, julio@oceanica.ufrj.br, ggs@petrobras.com.br
Copyright © 2013 Murilo Augusto Vaz et al. This is an open access article distributed under the Creative Commons Attribution License, which permits unrestricted use, distribution, and reproduction in any medium, provided the original work is properly cited.
Received April 19, 2013; revised May 10, 2013; accepted May 20, 2013
Keywords: Stress Concentration Factor; Plates with Circular Hole; Finite Element Analysis
ABSTRACT
The three-dimensional stress concentration factor (SCF) at the edge of elliptical and circular holes in infinite plates under remote tension has been extensively investigated considering the variations of plate thickness, hole dimensions and material properties, such as the Poisson’s coefficient. This study employs three dimensional finite element modeling to numerically investigate the effect of plate width on the behavior of the SCF across the thickness of linear elastic isotropic plates with a through-the-thickness circular hole under remote tension. The problem is governed by two geometric non-dimensional parameters, i.e., the plate half-width to hole radius  and the plate thickness to hole radius
  ratios. It is shown that for thin plates the value of the SCF is nearly constant throughout the thickness for any plate width. As the plate thickness increases, the point of maximum SCF shifts from the plate middle plane and approaches the free surface. When the ratio of plate half-width to hole radius
  is greater than four, the maximum SCF was observed to approximate the theoretical value determined for infinite plates. When the plate width is reduced, the maximum SCF values significantly increase. A polynomial curve fitting was employed on the numerical results to generate empirical formulas for the maximum and surface SCFs as a function of
  and
and . These equations can be applied, with reasonable accuracy, to practical problems of structural strength and fatigue, for instance.
1. Introduction
Many applications in engineering employ components with a circular hole. In the specific case of perforated plates under cyclical load, the effect of stress concentration can propagate cracks and compromise their structural integrity. The stress concentration near a geometric discontinuity in a plate is frequently described by the stress concentration factor (K), defined as the ratio of the actual stress  acting on that region to the stress
  applied to the plate extremity.
Howland [1] studied the stress around the central hole on finite width plates, using bipolar coordinates and biharmonic functions. The solution is iterative, so accuracy may be successively improved and the results were compared with photo-elastic experiments. Timoshenko and Goodier [2] and Muskhelishvili [3] presented classical solutions for bi-dimensional analysis of stress concentration along the hole edges on infinite width plates.
Based on the Theory of Linear Elasticity for plane strain or stress problems, Koiter [4] demonstrated that when the diameter of a centered, through-the-thickness hole approaches the plate width, the ratio between the maximum stress at the hole edge and the average stress in the reduced section (σmax/σav) is in the limit equal to 2. Parks and Mendoza [5] employed experimental analysis with strain gages to study the behavior of plates when the ratio between the hole diameter and the plate width is equal to 0.98 and 0.99, and showed that σmax/σav approaches 2. Wahl [6] used a simple non-linear formulation, applied to small relations between the hole wall minimum thickness and the plate width and also showed that σmax/σav tends to 2 and it approaches 1 as the load is increased. Cook [7] employed a geometrically non-linear finite element model to analyze elastic plates with Young’s Modulus and Poisson’s coefficient respectively equal to 100 GPa and zero, and varied the remotely applied stress from zero to 1000 MPa and the ratio between the hole wall minimum thickness and the plate width from 10−2 to 10−6. The results indicated that σmax/σav decreases from 1.94 to 1 as the load intensity is increased. Pradhan [8] employed a plane stress state finite element model for isotropic and composite plates and showed that the maximum stress at the edge of a centered, through-the-thickness hole strongly depends on the material property. The compilation of the stress concentration factors published by Pilkey [9] is usually considered an important reference for design.
Fatigue analysis methods for cracks and other forms of stress concentration are generally developed using bidimensional (2D) models. However, when these models are applied to certain types of problems where the geometry or material properties may lead to accentuated tri-dimensional (3D) stress concentrations the results can be inaccurate, as demonstrated by Bellett et al. [10] and Bellett and Taylor [11]. A variation of the SCF through the wall thickness of infinite width plate with elliptic and circular holes in isotropic material under remote tensile stress has been systematically investigated using finite element methods by Altenhof and Zamani [12], She and Guo [13,14], Yu et al. [15] and Yang et al. [16]. These analyses show that the maximum value of stress concentration occurs near but not on the plate surface as the thickness increases and this effect is more significant for elliptic holes. Kubair and Bhanu-Chandar [17] employed a FEM to investigate the effect of inhomogeneous material properties on the SCF for plates with a central circular hole subject to a remote stress. The material is functionally graded, that is, its properties vary spatially. A parametric study indicated that the SCF reduces when the Modulus of Young is progressively increased towards the center of the hole and that the angular position of maximum stress on the plate surface is unaffected by the material inhomogeneity. More recently, Chao et al. [18] presented an analytical solution for the stress field at an infinity plate with reinforced elliptical hole subjected to an inclined uniform remote tensile stress. The material properties for the reinforcement material may differ from the plate properties, and the reinforcement layer is limited by two confocal ellipses. Rezaeepazhand and Jafari [19] carried out an analytical investigation for the stress distribution in isotropic plates with centered holes with different shapes, subjected to remote uniaxial tensile stress. In the parametric study circular, triangular, square and pentagon holes were considered, furthermore, the cut-out shape, bluntness and orientation were also taken into account. The analytical results were compared with FEM simulations and showed that the SCF for square holes are smaller than for a similar plate with circular holes and that triangular and pentagon holes yield higher SCFs.
The objective of this study is to evaluate the variation of the stress concentration factor through the thickness for isotropic plates, with through-the-thickness circular holes, subject to remote tensile stress and to investigate the effect of plate width on the results. A finite element model was elaborated with various widths and thicknesses to allow a comprehensive parametric evaluation of this variation.
2. Definition of Geometric Parameters
Figure 1 shows a plate with a through-the-thickness circular hole, submitted to uniaxial stress , where the geometric parameters used in this study can also be seen. The plate width, thickness and length are respectively equal to
 ,
,  and
and . The circular hole, located at the center of the plate, has a radius equal to
 . The fixed geometric parameters are r = 5 mm and H = 100 mm, therefore the ratio
  is equal to 20, which ensures that the stress is applied far enough from the hole. The dimensionless variable ratios employed in the analyses are:
  = 1.2, 1.4, 1.6, 1.8, 2.0, 2.2, 2.5, 3, 4, 5, 6, 10 and 20 and
  = 0.2, 1, 2, 3, 4, 5, 6, 10, 20 and 30, totaling 130 simulation cases. The results in the analyses are related to these dimensionless parameters in such a way that an ample range of plate widths and thicknesses is investigated. Nevertheless, whenever convenient the results will be only presented for a smaller set of data.
3. Numerical Analysis
To study the stress concentration distribution along the edge of a circular hole and plate thickness, the finite element program ANSYS® [20] was used to obtain the solutions of the models with the geometric relations previously presented. The element SOLID45, defined by eight nodes with three degrees of freedom at each node (translations in the x, y and z nodal directions) was employed. This element is appropriate for the analysis of solid structures (3D) and recommended for linear applications. To reduce processing time, a model representing only 1/8 of the plate was elaborated, taking advantage of
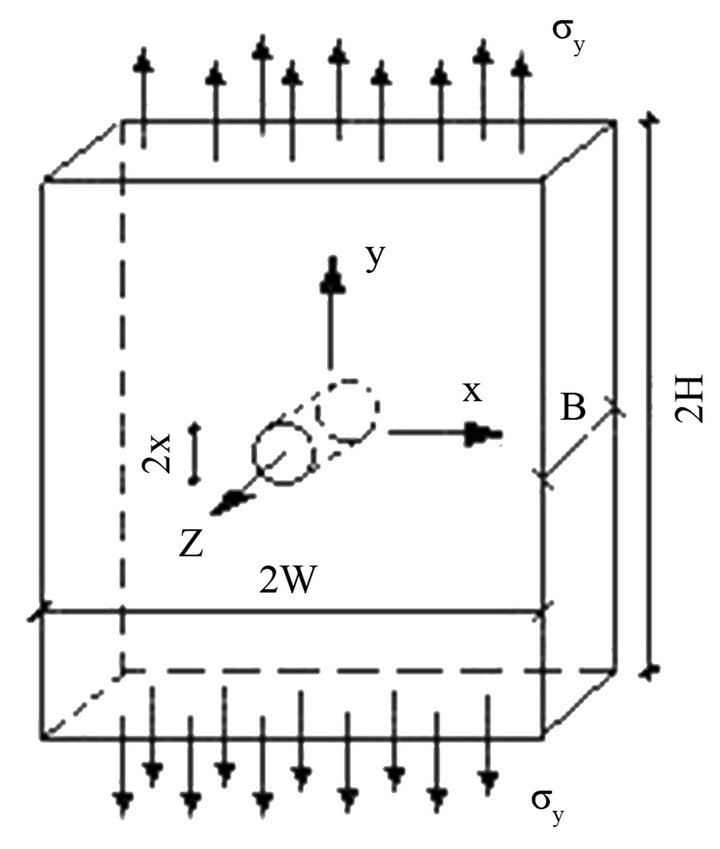
Figure 1. Dimensions of the plate with a circular hole and load.
the conditions of symmetry in the mid-planes, with the edge of the plate remaining free, as seen in Figure 2. In half-width , on mid-plane yz, the node degrees of freedom in the x direction were restricted. In half-length
 , on mid-plane xz, the node degrees of freedom in the y direction were also restricted. And, lastly, in halfthickness
 , on mid-plane xy, the node degrees of freedom in the z direction were restricted. The plate half-thickness was then divided in layers of elements, in such a way as to achieve a greater discretization in the region near the hole where a strong stress concentration needs to be captured, and elsewhere a regular mesh was devised ensuring that the aspect ratio of 1:20 in any element of the model was not violated. The elements along the half-thickness
  had a decreasing mesh, from the center to the free surface. Thus, the ratio of the nodal spacing
  varied between 1 and 8, see detail in Figure 2. The discretization adopted was obtained through mesh convergence tests for models with
  = 2 and 10, with the number of degrees of freedom varying between 13,680 and 292,158. Hence, it was possible to ensure the same mesh spacing around the hole edge for any values of
  and
and , with an error inferior to 1% in the values of maximum stress.
A longitudinal load was applied in the y direction through a tension load on the surface of the plate extremity, ensuring that stress did not exceed the yield stress for ordinary naval steel based on the ASTM A131 [21] standard.
The model was then considered geometrically and physically linear, bearing in mind that small displacements and an elastic linear regime were assumed. To represent the material parameters applied in the model, the Young modulus and the Poisson’s coefficient for steel were defined as 200 GPa and 0.333, respectively.
4. Results
Timoshenko and Goodier [2] employed the theory of elasticity for problems in two-dimension, using polar
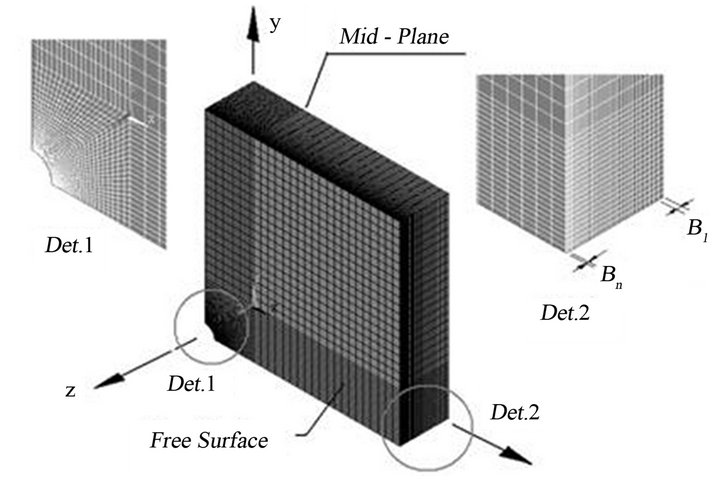
Figure 2. Constructive detail of the numerical model.
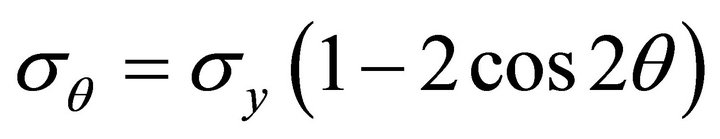
coordinates to demonstrate that the distribution of radial, shear and circumferential stresses in the area of a circular hole in the center of an infinite width plate, as shown in Figure 3, is given via the following expressions:
 (1)
(1)
 (2)
(2)
It is clear that the maximum value of  occurs on the plane of the transversal section to the plate passing through the center, i.e., when
  or
or . Thus the maximum stress is three times greater than the uniform tension
  applied in the plate extremities, in other words, the theoretical stress concentration factor
  is:
is:
 (3)
(3)
In Figures 4(a)-(c) the curves for various half-width to hole radius relations  are presented, which show the variation of the stress concentration factor at the hole edge
  along the plate thickness. The distance from the plate middle plane to the considered point is represented by the dimensionless parameter
 , where
  is this distance and
  the half-thickness, hence
 . Figures 4(a)-(c) show the curves for the ratios of thickness to the hole radius
  = 0.2, 4 and 30, respectively. The curves for
  = 1, 2, 3,
  = 5, 6 and 10 and
  are respectively similar to
  = 0.2, 4 and 30, hence to save space they are not shown here. Due to the overlay of the curves and the consequent line congestion on the bottom part of Figure 4, the curves corresponding to
  = 1.8, 2.2, 2.5, 3, 5, 6, 10 are likewise not shown.
The general interpretation for the behavior of the curves shown in Figures 4(a)-(c) indicates a significant increase in  with a decrease in
  for all cases, especially for the range of
  = 1.2 to 4. Fur-
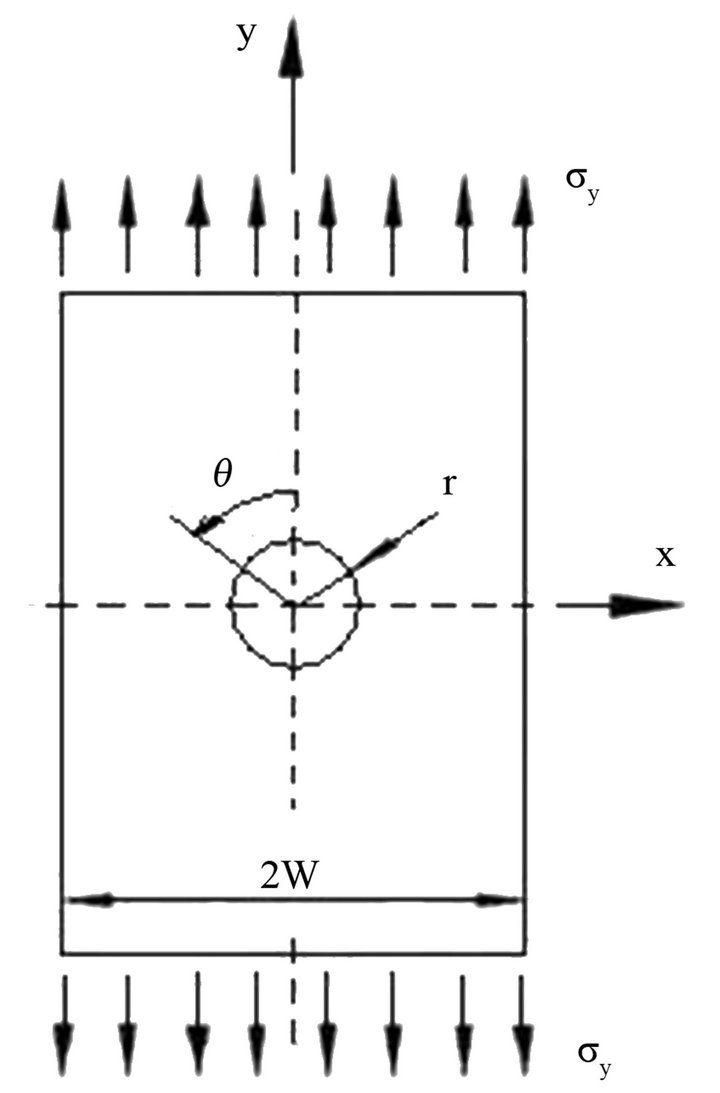
Figure 3. Plate with a centered hole under remote tension.
 (a)
(a)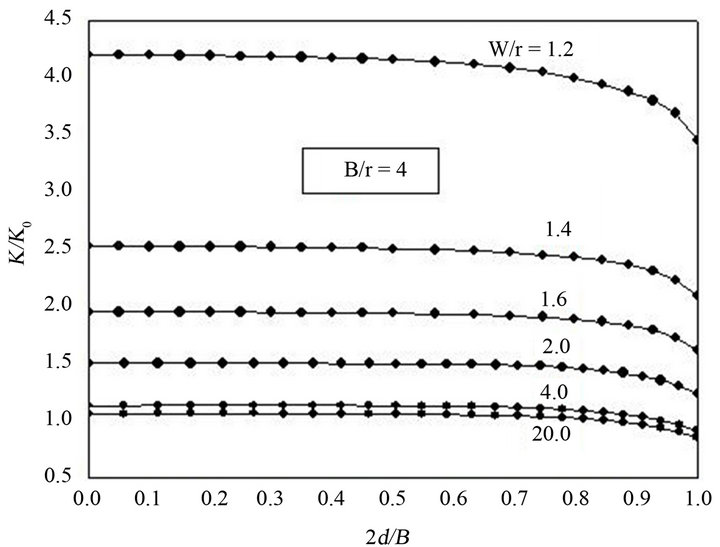 (b)
(b)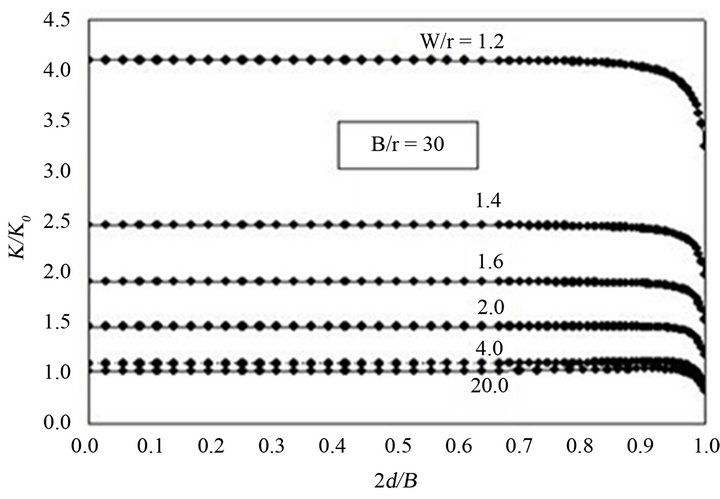 (c)
(c)
Figure 4. Distributions of stress concentrations for different relations of half-width to hole radius  along the distance to the mid-plane through half-thickness
 . (a)
. (a)  as a function of
  for
for  = 0.2; (b)
  as a function of
  for
for  = 4; (c)
  as a function of
  for
for  = 30.
= 30.
thermore, the maximum stress concentration factor for  = 1.2 is always greater than four times the theoretical 2D value for any of the
  relations. In Figure 4(a), when
 , the curves present profiles of stress concentration factors almost constant with thickness for the different values of
 . The curves of Figures 4(b) and (c), corresponding to
  = 4 and 30, respectively, demonstrate an almost constant function up to a specific distance from the middle plane, and from this point there is an accentuated decrease of
  towards the plate surface.
Figure 5 indicates a variation of the ratio of the distance to the middle plane  from the point of maximum stress concentration factor to the half-thickness of the plate
 , as a function of the ratio of the plate half-width to the hole radius
  with varying
  ratios.
For , the maximum stress concentration factors
  remain at the plate middle plane, that is,
  , for any
  value. When the ratio of thickness to the hole radius is greater than 3
  and the ratio plate half-width to the hole radius is greater than 2
 , the location of maximum stress concentration factor displaces from the middle plane and approaches, but it never reaches, the plate free surface. Besides, for every
  curve, beginning at a specific
  value, the position of the point of
  remains constant.
Figures 6(a) and (b) respectively demonstrate the ratios of maximum stress concentration  and the surface stress concentration
  to the 2D theoretical value
 , as a function of the
  ratio, when the ratio of plate half-width to the hole radius
  is varied.To avoid the accumulation of curves in the lower part of the graph and, thus, lose clear sight, the curves referring to
  = 4, 5, 6 and 10 are not shown.
Figure 5. Distance  as a function of
  for various values of
 .
.
 (a)
(a)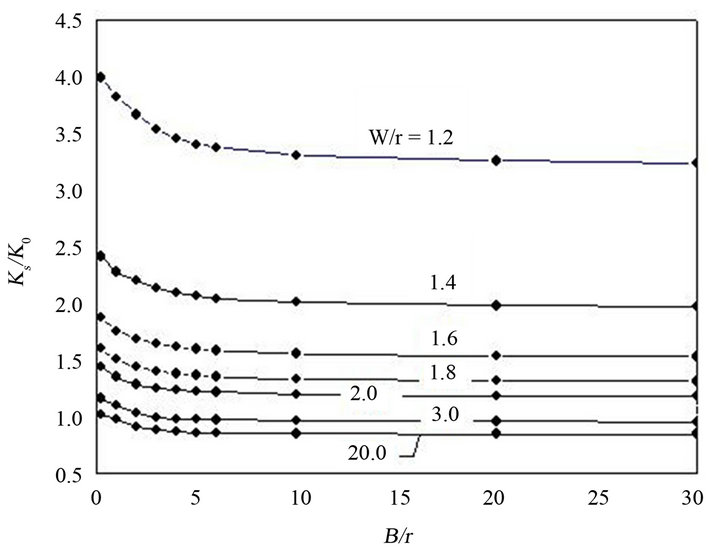 (b)
(b)
Figure 6. Variation of  and
and  as a function of
 . (a) Values for
  for several values of
 ; (b) Values for
  for several values of
 .
.
For all  ratios, the values of
  in Figure 6(a) initially increase and reach maximum values when
  is close to 2, and from this point, the curves begin to monotonously decrease and converge to almost constant values when
 . For the set of parameters investigated in this paper the largest
  value is 4.23, which occurs for
  and
and . It is worth noting that plates with a relatively large width, i.e., with the
  relation close to twenty, the
  values tend to 1, which is the expected value for an infinite width plate.
In Figure 6(b), the curves indicate that the  ratios decrease monotonically and converge to almost constant values for
 , approximately. The largest
  values vary from 3.99 to 0.998, corresponding to the ratios of
  = 1.2 and 20, respectively.
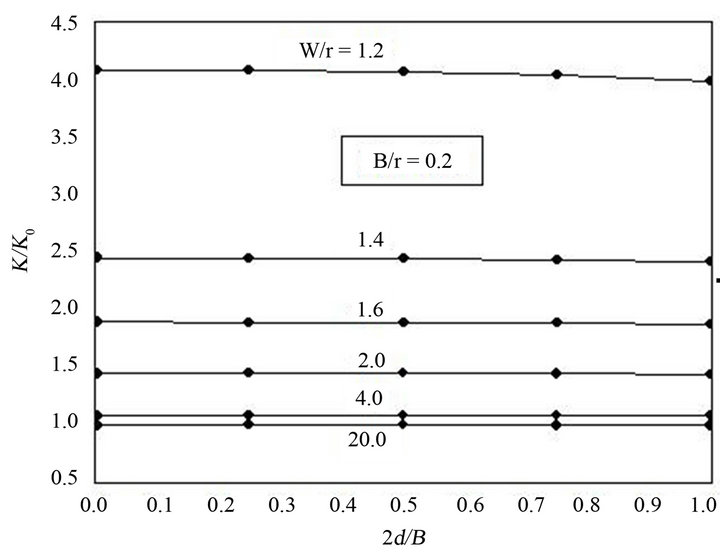
Figure 7 shows the relation between the maximum and surface stress concentration factors  as a function of the B/r ratio, for various
  ratios. To avoid overlaying, the curves for
  relations are not displayed. Figure 7 indicates that the values for the
  ratios are very close to one only for
 , and when the plate thickness is increased the ratio
  rapidly increases. Furthermore, these curves demonstrate that for ratios of
  the
the  values strongly decrease with
 . When
 , except for
 , the
, the  curves asymptotically converge to values close to 1.24.
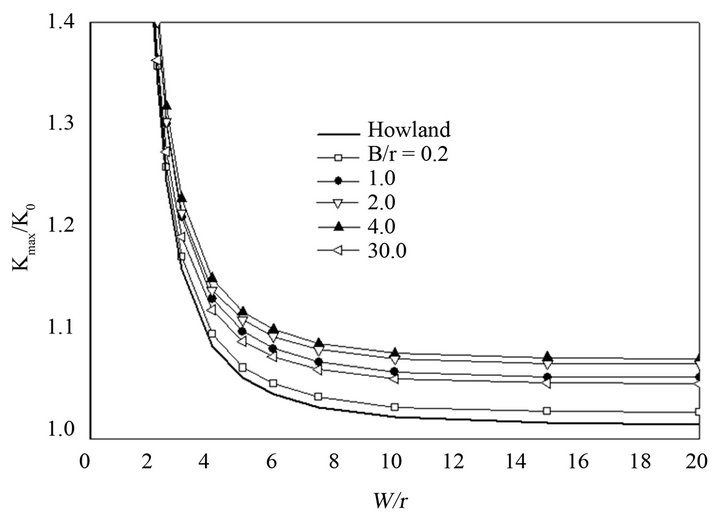
Figures 8(a) and (b) indicate, respectively,  and
and  ratios, as a function of
 , for various
  ratios. The curve obtained by Howland [1] is also included in this graph. The curves
  and
and  in the range
  practically blend together, so to improve visualization it was decided to trace only the curves for the ends of this interval.
When comparing the numeric values obtained for thin plates, typically represented herein by , with Howland’s [1] results, some small discrepancies are observed between the curves for
 , and better adherence for
 . This is expected because photoelastic measurements, in which Howland’s [1] equations were confronted, had been performed on plate surfaces.
It becomes evident in Figures 8(a) and (b) that Howland’s [1] results are valid only for plates with the  relation close to 0.2. Figure 8(a) indicates that Howland’s [1] curve underestimates
  for other
  relations. Figure 8(b) demonstrates that Howland’s [1] curve overestimates the
  values when B/r > 0.2.
5. Design Formulas
Due to the non-linear characteristics of the variables in-
Figure 7. Variation of  as a function of
  for several
  relations.
 (a)
(a)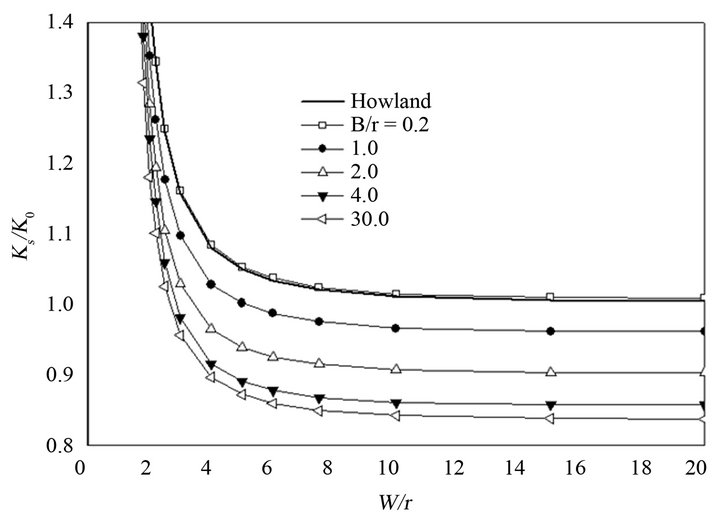 (b)
(b)
Figure 8. Variation of  and
and  as a function of
 . (a) Values of
  for several
  values; (b) Values of
  for several
  values.
volved, empirical formulas, obtained by a polynomial adjustment of the numerical results, are proposed. They are valid for ratios of plate half-width to hole radius of  and plate thickness to hole radius of
 .
.
The empirical formula for the  curves shown in Figure 8(a) can be expressed by:
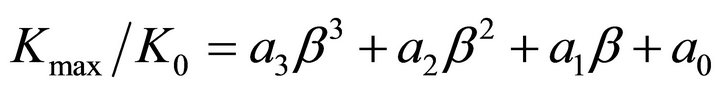 (4)
(4)
where:
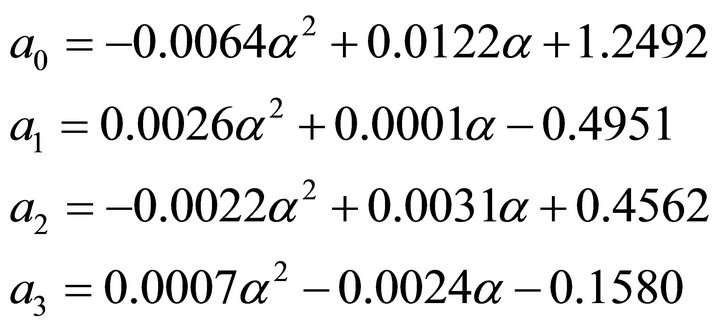
With parameters  and
and  respectively given by
  and
and .
.
For  displayed in Figure 8(b) the empirical formula is expressed by:
 (5)
(5)
where:
The maximum errors of the values obtained by Equations (4) and (5), when compared with the  and
and  corresponding values obtained by finite element analyses are less than 1.50% and 1.68%, respectively.
6. Conclusions
The present study presents the variation of the stress concentration factor through the thickness of linear elastic isotropic plate with through-the-thickness circular hole, subject to remote tensile stress and investigates the effect of plate width on the behaviour of the results. A finite element method was used to analyze the 3D plate solid structure, using an eight nodes element with three degrees of freedom per node, which is appropriate and recommended for use in linear applications. A strong influence of the ratio plate half-width to hole radius  on the stress concentration factor was observed during the analyses. The study demonstrated that with a fixed thickness to hole radius
  relation the behavior of the stress concentration factors presented similar characteristics for different
  relations, but at rather different
  levels.
The largest  observed for the set of geometric parameters investigated in this paper corresponds to the plate with
  and
and , and is equal to 4.23 times the stress concentration factor for the infinite width plate
 . The largest surface stress concentration factor
  also occurs in the plate with
  and
and , and is equal to 3.99. For values of the ratio
 , the point where
  occurs is independent of
  and is always on the plate middle surface. For plates with
  the distance from the point of
  to the mid-plane (dmax) depends on the
  and
and  ratios. When
  the value of the maximum stress concentration factor
  approximately tends to 24% greater than the surface stress concentration factor
 , for
, for . It was demonstrated that the
  curves versus
 , in the same way that the
  curves versus
 , for all
  ratios, present asymptotic behavior for
 . The
. The  curve versus
  numerically developed when
  presents small discrepancies when compared to Howland’s. For all other
  relations the
  are underestimated by Howland’s values. The
  curve versus
  developed numerically when
  presents good consonance with Howland’s prediction. However, for all other
  relations the
  are overestimated by Howland. The empirical formulas developed from the numerical results presented maximum errors for
  and
and  respectively equal to 1.50% and 1.68%.
7. Acknowledgements
The authors acknowledge the support of the National Council for Scientific and Technological Development (CNPq) for this work.
REFERENCES
- R. C. J. Howland, “On the Stresses in the Neighbourhood of a Circular Hole in a Strip under Tension,” Philosophical Transactions of the Royal Society of London, Vol. 229, 1930, pp. 49-86. doi:10.1098/rsta.1930.0002
- S. Timoshenko and J. N. Goodier, “Theory of Elasticity,” 2nd Edition, McGraw-Hill Book Company, New York, 1951.
- N. I. Muskhelishvili, “Some Basic Problems of the Mathematical Theory of Elasticity,” Groningen, 1953.
- W. T. Koiter, “An Elementary Solution of Two Stress Concentration Problems in the Neighborhood of a Hole,” Quarterly of Applied Mathematics, Vol. 15, 1957, pp. 303- 308.
- V. J. Parks and D. F. Mendoza, “Maximum Stress in a Tensile Strip with a Large Hole,” Experimental Mechanics, Vol. 15, No. 10, 1975, pp. 389-391. doi:10.1007/BF02319837
- A. M. Wahl, “Discussion of ‘Maximum Stress in a Tensile Strip with a Large Hole’,” Experimental Mechanics, Vol. 16, No. 11, 1976, pp. 439-440. doi:10.1007/BF02410352
- R. D. Cook, “Stresses in a Tensile Strip with a Large Circular Hole,” Computers & Structures, Vol. 24, No. 3, 1986, pp. 421-424. doi:10.1016/0045-7949(86)90319-6
- B. Pradhan, “Effect of Width and Axial to Transverse Elastic Stiffness Ratio on SCF in Uniaxially Loaded FRP Composite Plates Containing Circular Holes,” Fiber Science and Technology, Vol. 17, No. 4, 1982, pp. 245-254. doi:10.1016/0015-0568(82)90020-3
- W. D. Pilkey, “Peterson’s Stress Concentration Factors,” 2nd Edition, John Wiley & Sons, New York, 1997. doi:10.1002/9780470172674
- D. Bellett, D. Taylor, S. Marco, E. Mazzeo, J. Guillois and T. Pircher, “The Fatigue Behaviour of Three-Dimensional Stress Concentrations,” International Journal of Fatigue, Vol. 27, No. 3, 2005, pp. 207-221. doi:10.1016/j.ijfatigue.2004.07.006
- D. Bellett and D. Taylor, “The Effect of Crack Shape on Fatigue Limit of Three-Dimensional Stress Concentrations,” International Journal of Fatigue, Vol. 28, No. 2, 2006, pp. 114-123. doi:10.1016/j.ijfatigue.2005.04.010
- W. Altenhof, N. Zamani, W. North and B. Arnold, “Dynamic Stress Concentrations for an Axially Loaded Strut at Discontinuities Due to an Elliptical Hole or Double Circular Notches,” International Journal of Impact Engineering, Vol. 30, No. 3, 2004, pp. 255-274. doi:10.1016/S0734-743X(03)00068-X
- C. She and W. Guo, “Numerical Investigations of Maximum Stress Concentration at Elliptic Holes in Finite Thickness Piezoelectric Plates,” International Journal of Fatigue, Vol. 28, No. 4, 2006, pp. 438-445. doi:10.1016/j.ijfatigue.2005.06.046
- C. She and W. Guo, “Three-Dimensional Stress Concentrations at Elliptic Holes in Elastic Isotropic Plates Subjected to Tensile Stress,” International Journal of Fatigue, Vol. 29, No. 2, 2007, pp. 330-335. doi:10.1016/j.ijfatigue.2006.03.012
- P. Yu, W. Guo, C. She and J. Zhao, “The Influence of Poisson’s Ratio on Thickness-Dependent Stress Concentration at Elliptic Holes in Elastic Plates,” International Journal of Fatigue, Vol. 30, No. 1, 2007, pp. 165-171. doi:10.1016/j.ijfatigue.2007.02.007
- Z. Yang, C. B. Kim, C. Cho and H. G. Beom, “The Concentration of Stress and Strain in Finite Thickness Elastic Plate Containing a Circular Hole,” International Journal of Solids and Structures, Vol. 45, No. 3-4, 2008, pp. 713- 731. doi:10.1016/j.ijsolstr.2007.08.030
- D. V. Kubair and B. Bhanu-Chandar, “Stressconcentration Factor Due to a Circular Hole in Functionally Graded Panels under Uniaxial Tension,” International Journal of Mechanical Sciences, Vol. 50, No. 4, 2008, pp. 732-742. doi:10.1016/j.ijmecsci.2007.11.009
- C. K. Chao, L. M. Lu, C. K. Chen and F. M. Chen, “Analytical Solution for a Reinforcement Layer Bonded to a Elliptic Hole under a Remote Uniform Load,” International Journal of Solids and Structures, Vol. 46, No. 14- 15, 2009, pp. 2959-2965. doi:10.1016/j.ijsolstr.2009.03.025
- J. Rezaeepazhand and M. Jafari, “Stress Concentration in Metallic Plates with Special Shaped Cutout,” International Journal of Mechanical Sciences, Vol. 52, No. 1, 2010, pp. 96-102. doi:10.1016/j.ijmecsci.2009.10.013
- “ANSYS® User’s Manual.Structural Analysis Guide,” Release 10.0 Documentation, 2005.
- American Society for Testing Materials, “Standard Specification for Structural Steel for Ships,” A131/A131M, 2008.