World Journal of Condensed Matter Physics
Vol.09 No.01(2019), Article ID:90442,21 pages
10.4236/wjcmp.2019.91001
The Effect of Infrared Light’s Power on the Infrared Spectra of Thin Films
Giovanna Scarel1*, Eric C. Stevens2
1Department of Physics and Astronomy, James Madison University, Harrisonburg, VA, USA
2Department of Chemical and Biomolecular Engineering, North Carolina State University, Centennial Campus, Raleigh, NC, USA

Copyright © 2019 by author(s) and Scientific Research Publishing Inc.
This work is licensed under the Creative Commons Attribution International License (CC BY 4.0).
http://creativecommons.org/licenses/by/4.0/


Received: January 9, 2019; Accepted: January 31, 2019; Published: February 3, 2019
ABSTRACT
There are numerous evidences that a relationship exists between the average power P of electromagnetic waves and the mechanical motion of the objects interacting with them. We investigate the effects of infrared (IR) light’s average power P on the transmission Fourier transform infrared (FTIR) spectra of thin cubic Yb2O3 and rhombohedral LaAlO3 films deposited on silicon via atomic layer deposition. We find that different values of P of the IR light displace the minima of the absorption bands. This effect is reproducible in different sets of experiments and in different spectrometers. To interpret the experimental findings, we use the law of conservation of energy. We find a correlation among the energy of the IR waves and the number, moment of inertia, and vibrational/rotational frequency of the bonds involved in the vibrational or rotational motion. The law of conservation of energy unveils that larger values of P of the IR light and lower wavenumbers of the resonances involve a larger number of crystal bonds. One practical application of our approach is that it suggests a way to improve the sensitivity of the FTIR spectra of thin crystalline films in the far IR region.
Keywords:
Infrared, Power, Vibrational Spectroscopy, Atomic Layer Deposition

1. Introduction
Absorption of electromagnetic (EM) waves may generate mechanical motion [1] and vibrations [2] , at the molecular [1] [2] or nuclear [3] [4] levels. On the other hand, rotating objects can emit EM waves. For example, the magnetic fields on the sun’s surface rotate by some angles while generating solar flares with emission at a wavelength, e.g., 656.28 nm, which corresponds to the red Hα line [5] . Rotating galaxies seem to generate the [CII] line at wavelength 157.74 μm, which is in the microwave range of the EM spectrum [6] . Neutron star merger events radiate γ-rays plus radio waves [7] . Dust grains of variable size in space are expected to emit infrared (IR) light and microwaves in various types of interstellar environments [8] .
The magnitude of the average power P of the EM waves seems to play a key role in linking the magnitude of the mechanical motions to the properties of the EM waves generating them or caused by them. For example, in Thomson scattering a precise analytical expression exists between the power over area (i.e. the intensity ) of the absorbed laser beam with central frequency , and the kinetic energy ( ) and emission angle of the scattered electrons such that [3] [4] , where is a function of . In the neutron star merger event GW170817 it was recently discovered that the γ-ray plus radio wave afterglow signals and the dynamical ejecta are emitted in the form of a choked jet cocoon [7] . Researchers drew this conclusion after studying the flux densities, i.e. the energy versus time profiles or power, of the emitted radio waves [7] . On a smaller scale, vibrational spectra enabled the investigation of the absorption of IR light in the formation of urethane and polyurethane. The vibrational spectra unveiled that the addition of a vibrational excitation to thermal energy accelerated the reaction rate of formation [2] . From the information that the IR light was emitted with an energy per pulse of 3 μJ, repetition rate of 2 kHz, and wavelength of 2857 nm, we estimated that the average power of the laser was . At this value of P, approximately 1190 reactions producing urethane and 2976 reactions producing polyurethane were activated within one period of the illuminating IR light. Finally, at the nanoscale level, a linear relationship was found between the rotational frequency of an optically trapped dielectric particle and the power of the trapping laser [9] . According to the authors of Ref. [9] , however, the dominating torque transfer mechanism in this experiment is still unknown.
To understand the role of the light’s average power P in generating mechanical motion in light-matter interaction involving atoms in crystalline bonds, we consider the wave nature of light. Indeed, for light as a wave, the power over area (i.e. the intensity ) is the Poynting vector, and the amount of energy conserved in the interaction of light with matter is , where is the period of the of the light wave. These concepts and their consequences in various natural phenomena are discussed in Ref. [10] . In this article we specifically investigate the effects of the average power P on the transmission Fourier transform IR (FTIR) [11] spectra of thin crystalline cubic Yb2O3 and rhombohedral LaAlO3 films deposited on silicon (Si). We first present the method used to grow the thin films via atomic layer deposition (ALD) [12] [13] , and report the properties of the thin films. We then describe how we obtained the transmission FTIR spectra [11] of the thin films, focusing in particular on how we achieved the different values of the average power P (25 mW ± 5.2 μW, 16.4 mW ± 4.5 μW, 12.1 mW ± 5.1 μW, and 7.9 mW ± 4.9 μW). In the Result Section we show that different values of the average power P displace the location (in wavenumber, or frequency in units of THz) of the minima of the absorption bands in the FTIR spectra of the thin films. We ascribe this phenomenon to the fact that the average power P affects the vibrational energy of the crystalline structure of the thin films, , which, in turn, determines the location of the minima of the absorption bands in the FTIR spectra. In the Discussion Section we link the average power P to the location of the minima of the absorption bands observing that the moment of inertia I and the vibrational frequency of the vibrating bond depend on . In turn, is correlated to , the amount of energy conserved in the interaction of light with matter. Since represents the vibrational/rotational energy of the whole crystal structure involved in the interaction with the IR light, this energy depends on the number of the interested bonds. Therefore, using a model based on the law of conservation of energy [10] , and knowing P, , , and I, we estimate the number of the bonds involved in the interaction between the IR light and the thin crystalline films. To highlight the significance of our results we report the outcome of our literature search showing that other researchers acknowledged the existence of displacements in the minima of the absorption bands in FTIR spectra [14] . These authors, however, were not able to justify such displacements. We also found that the existence of a relationship among P, , , and I is acknowledged, e.g., in the motion of a dielectric particle optically trapped by a laser [9] . This finding not only supports our approach, but also underlines its innovative character in the field of FTIR spectroscopy. In the Conclusions Section we outline the significance of our study. First we highlight that , the number of bonds involved in the interaction between the IR light and the thin crystalline films, might represent a “classical” way (as opposed to the usual “quantum” way) to count the number of the quasi-particles usually called phonons, through the link among P, , , , I, and . As far as the practical application of our findings are concerned, our method suggests that, by increasing the power of the IR light, it should be possible to enhance the sensitivity of the FTIR spectra of thin crystalline films in the far IR region. Achieving this goal is possible due to the direct proportionality between moment of inertia and average power, i.e. , as we have found in our study. Applying our strategy, however, requires keeping in mind that such increase in sensitivity is accompanied by a slight shift in location of the minima of the absorption bands.
2. Experimental Methods
We analyzed two different types of thin oxide films using transmission FTIR spectroscopy at four average power levels of the IR light using two different spectrometers. In one of the two spectrometers the original power of the source was lowered using a polarizer and a copper mesh. The details of the materials used and measurements performed are as follows.
2.1. Thin Films
Uniform thin cubic Yb2O3 (500 nm, thick) and rhombohedral LaAlO3 films (550 nm thick) on Si were prepared via ALD [12] [13] with growth parameters and precursors described in Ref. [15] . The films exhibit remarkable stability [13] as they retain their characteristics over more than the year during which we collected and analyzed their transmission FTIR spectra. We assessed the crystallinity of the thin films using far-IR FTIR spectroscopy, as shown in Appendix 1.
2.2. FTIR Spectrometers
We investigated the effects of different levels of the IR light’s average power P on transmission FTIR spectra using a N2-purged Bruker Vertex 70 spectrometer with a Q301 globar source emitting at , and a N2 purged Nicolet Magna 6700 spectrometer with a globar source emitting at . On the Bruker Vertex 70 spectrometer we achieved and by inserting a copper mesh or polarizer (PIKE Technologies 090-1000 ZnSe polarizer), respectively, in the beam path on the sample holder in front of the thin film. For the measurements with the polarizer we selected p-polarization (or TM-polarization). We investigated the features of the thin cubic Yb2O3 and rhombohedral LaAlO3 films in the middle IR range (MIR, 350 ? 7,500 cm−1 wavenumber, 28,600 nm - 1300 nm wavelength or 95.33 fs - 4.33 fs period). In both spectrometers and in all measurements we selected a resolution of 4 cm−1 and collected the spectra with 100 scans. In both spectrometers, we positioned the thin film on a vertical transmission sample holder perpendicular to the IR beam. We explored only normal incidence transmission spectra because one of the two spectrometers is equipped with neither a reflection nor a rotating transmission accessory. The lack of a reflection accessory on one of the spectrometers prevented us from studying films on metal substrates, which do not enable transmission studies. We measured the spectra with the Bruker Vertex 70 spectrometer two days before measuring them with the Nicolet Magna 6700 spectrometer to allow time for the trip from Harrisonburg (VA) to Raleigh (NC) where the two spectrometers are located. We kept the samples sealed and protected during the transfer from one location to the other, and between all sets of measurements. The collected spectra exhibit excellent reproducibility demonstrating the high stability of the thin crystalline films we used in this research [13] . We discuss the effects of the choice of the Si substrate in Appendix 2 and Appendix 3.
2.3. Power Measurements
We measured the power of the IR light before all measurements using a power-meter sensor Coherent PowerMax RS PS19, sensitive to wavelength and average power ranges of 300 - 11,000 nm and 100 μW to 1 W, respectively. The absorption bands of interest in the examined thin films appear in the 470 - 950 cm−1 wavenumber range (or 10,526 - 21,276 nm wavelength range). For the absorption bands of the cubic Yb2O3 films, which appear in the 840 - 950 cm−1 wavenumber range (10,520 - 11,905 nm wavelength range), the IR light’s power estimation is within the range of sensitivity of the power sensor. On the other hand, the absorption bands of the rhombohedral LaAlO3 films appear in the 470 - 560 cm−1 wavenumber range (21,276 - 17,857 nm wavelength range), which is outside the operating range of the power sensor. Therefore, in the case of the rhombohedral LaAlO3 films the estimated power is affected by a systematic error. This systematic error, however, does not prevent us from evaluating the shifts of the minima in the absorption bands observed with either the Bruker Vertex 70 or the Nicolet Magna 6700 spectrometers.
3. Nomenclature
To simplify reading the Results and Discussion Sections, here we list the meaning of the most significant variables presented: P average power of the IR light, period of the IR light, vibrational energy of the crystalline structure of the thin films, the vibrational frequency of the vibrating bond, I moment of inertia of the vibrating bond, number of bonds involved in the interaction between the IR light and the thin crystalline films, mass of the atoms involved in each bond, and l lattice parameter of the film’s crystalline structure.
4. Results
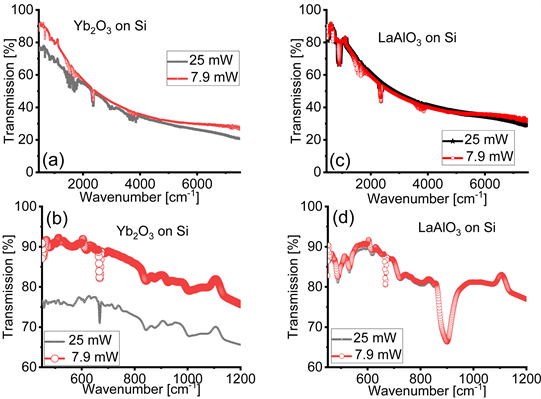
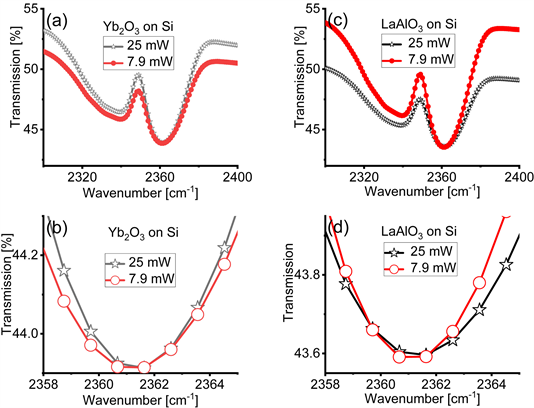
Figure 1 displays the transmission FTIR spectra of the cubic Yb2O3 films on Si and rhombohedral LaAlO3 films on Si collected with IR light’s average power and 25 mW. First, we observe that the transmission level is about 50 % lower for the spectra acquired with (panels (a) and (c)). Additionally, the absorption bands for both the Yb2O3 and LaAlO3 films on Si are deeper and better defined when collected with IR light at an average power (panels (b) and (d)). Furthermore, a careful inspection of Figure 1 indicates that the location of the minima of the absorption bands are different in the spectra obtained with the Bruker Vertex 70 ( ) and the Nicolet Magna 6700 ( ) spectrometers.
Figure 2 and Figure 3 compare the effects of different magnitudes of the average power P of the IR light on the FTIR spectra of the cubic Yb2O3 and the rhombohedral LaAlO3 films on Si, respectively. Differently than in Figure 1, to obtain Figure 2 and Figure 3 we changed the average power P of the IR light only on the Bruker Vertex 70 spectrometer by either inserting or omitting a copper mesh or a polarizer in the IR beam path. This method enabled us to achieve , and 25 mW. First, we note that Figure 2(a), for the cubic Yb2O3 films, and Figure 3(a), for the rhombohedral LaAlO3 films, show that the transmission levels vary only within 15% for three different average power magnitudes, while the depth of the absorption bands do not exhibit significant variations. We can thus speculate that the large variations in the transmission levels and the depth of the absorption bands in Figure 1 can be ascribed
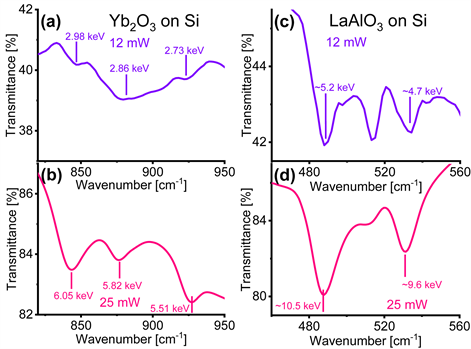
Figure 1. Transmission Fourier transform infrared (FTIR) spectra of cubic Yb2O3 films on Si acquired with infrared (IR) light’s power of (a) 12.1 mW and (b) 25 mW. FTIR spectra of rhombohedral LaAlO3 films on Si collected with IR light’s power of (c) 12.1 mW and (d) 25 mW. The values of are labelled in units of keV for the relevant absorption bands in all panels. These values are approximated for the case of the LaAlO3 films on Si in panels (c) and (d) since the spectral features appear in a range located at the edge of the sensitivity of the power sensor used in this research.
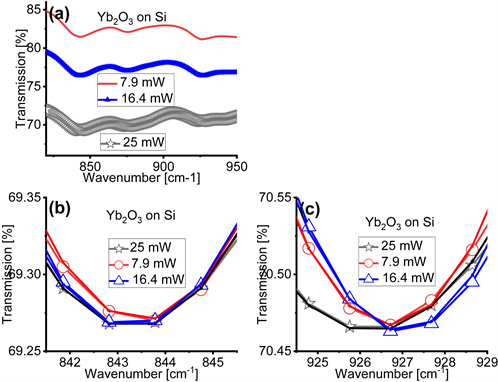
Figure 2. Transmission Fourier transform infrared (FTIR) spectra of cubic Yb2O3 films on Si acquired with infrared (IR) light’s power of 7.9 mW, 16.4 mW and 25 mW. Panel (a) shows the original transmission FTIR spectra in the wavenumber range where the relevant absorption bands appear. Panels (b) and (c) zoom into the location where the minima in the absorption bands of the FTIR spectra appear after offsetting the spectra so that they overlap. In panels (b) and (c) the experimental data are fitted by the hyperbolic secant function in Equation (1), which facilitates the precise determination of the location of the minima of the absorption bands, i.e. the parameter .
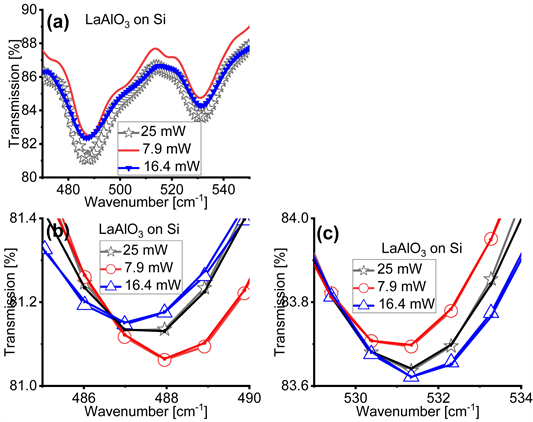
Figure 3. Transmission Fourier transform infrared (FTIR) spectra of rhombohedral LaAlO3 films on Si acquired with infrared (IR) light’s power of 7.9 mW, 16.4 mW and 25 mW. Panel (a) shows the original transmission FTIR spectra in the wavenumber range where the relevant absorption bands appear. Panels (b) and (c) zoom into the location where the minima in the absorption bands of the FTIR spectra appear after offsetting the spectra so that they overlap. In panels (b) and (c) the experimental data are fitted by the hyperbolic secant function in Equation (1), which facilitates the precise determination of the location of the minima of the absorption bands, i.e. the parameter .
to the specific spectrometer used. Then, by examining Figure 2(b), Figure 2(c), Figure 3(b) and Figure 3(c), we again find that the location of the minima in the absorption bands shifts in response to different magnitudes of the average power P, as reported in Table 2 and in agreement with the trends reported in Figure 1 and Table 1. We thus infer that the location of the minima of the absorption bands is indeed related to the average power P of the IR light. To carefully determine the location of the minima of the absorption bands, in Figure 2(b), Figure 2(c), Figure 3(b), and Figure 3(c) we fit the experimental transmission (T) versus wavenumber (w) spectra with a hyperbolic secant function:
, (1)
where is the starting transmission level, is the amplitude of the hyperbolic secant well, is the location of the minimum, and is the width of the hyperbolic secant well. We selected the hyperbolic secant function to fit the spectra because such a function overlaps the experimental data points and facilitates the process of locating the minimum of the well. The parameter , i.e. the location of the minimum of the hyperbolic secant well, is identified as and reported in Table 1 and Table 2 for the minima of the significant absorption

Table 1. For both the cubic Yb2O3 and the rhombohedral LaAlO3 lattices, we report the mass of the atoms involved in the relevant bonds [16] [17] , the lattice parameter l [18] [19] , and the vibrational frequency at which we find the minima of the absorption bands in Fourier transform infrared (FTIR) spectra obtained at average power P of 12.1 mW and 25 mW. For the rhombohedral LaAlO3 films we choose an average value of the lattice parameter l to simplify the calculations. The average vibrational frequencies , or the parameter in Equation (1), are determined from the minima in the absorption bands of the FTIR spectra in Figure 1 using Equation (1) as fitting function.
Table 2. For both the cubic Yb2O3 and the rhombohedral LaAlO3 lattices, we report the vibrational frequency at which we find the minima of the absorption bands in Fourier transform infrared (FTIR) spectra obtained at an average power P of 25 mW, 16.4 mW and 7.9 mW shown in Figure 2 for the Yb2O3 films and in Figure 3 for the LaAlO3 films. For simplicity, for the Yb2O3 films we display the values for only two out of the three relevant absorption bands. Also here, is the parameter in Equation (1).
bands identified in our thin films. An attentive examination of these tables suggests that the location of the minima of the absorption bands do not exhibit a monotonic trend with the magnitude of the average power P.
Figure 4 reports the FTIR spectra of the cubic Yb2O3 acquired on different days to assess the reproducibility of the location of the minima of the absorption bands. We observe that the location of the absorption bands at 843 cm−1 in Figure 4(a) and Figure 4(b), and 927 cm−1 in Figure 4(c) and Figure 4(d), are consistent in days 1 and 2. This finding enables us to conclude that, at a fixed magnitude of the average power P, the location of the absorption bands does not change, and helps us constraining to P the responsibility of the changes in the
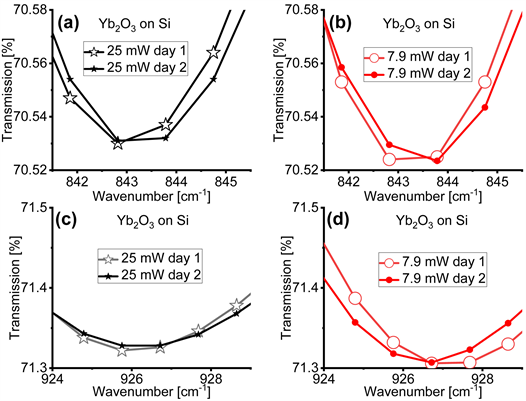
Figure 4. Fourier transform infrared (FTIR) spectra of cubic Yb2O3 films on Si acquired with infrared (IR) light’s power of 25 mW (panels (a) and (c)) and 7.9 mW (panels (b) and (d)) in two different days (day 1 and day 2) to assess the reproducibility of the location of the minima of the absorption bands. In Appendix 6 we show the same spectra for the rhombohedral LaAlO3 films on Si.
location of the minima of the absorption bands. Instead, to highlight that the displacement of the minima of the absorption bands occurs uniquely in crystalline films, in Appendix 4 we unveil that the displacements in the location of the absorption bands does not to affect the molecular vibrations. To achieve this conclusion, we examine, for example, the region of the carbon residues in the 2,500 cm−1 wavenumber region: here we do not observe any absorption band displacement. Finally, in Appendix 5 we rule out the possibility that sample heating causes the displacement of the location of the minima of the absorption bands.
In summary, our experimental FTIR spectra highlight two major effects induced by varying the magnitude of the average power P of the IR light: 1) the displacement of the minima of the absorption bands of the crystalline thin films and 2) the lack of a monotonic trend in the extent and direction of the displacements.
5. Discussion
We argue that the origin of the displacements and of their lack of a monotonic trend in extent and direction is linked to the magnitude of , where P is the average power and the period of the IR light. We start our argument by recalling that the energy is the amount of energy conserved in the interaction between the IR light and the thin crystalline films on Si [10] . The values of are labelled in units of keV for the relevant absorption bands in all panels of Figure 1. These values are larger for the absorption bands in the spectra collected with , i.e. for the larger values of P we used, and for the LaAlO3 films, i.e. for the larger values of the period or lower values of the wavenumber at which we detected in the absorption bands. We thus hypothesize that the energy transfers vibrational energy to the bonds of the thin crystalline films illuminated by the IR light. We correlate and through the law of conservation of energy as follows:
(2)
In Equation (2), is the moment of inertia of Yb-O [16] , La-Al or Al-O bonds [17] . The mass of the atoms involved in each bond is , and l is the lattice parameter [18] [19] . The values of and l are displayed in Table 1. For the rhombohedral LaAlO3 structure, which is non-cubic, we choose an average value for l, reported in Table 1. The values of the vibrational frequency of the bond derived as , i.e. the location of the minima of the absorption bands in the FTIR spectra in Figure 1, Figure 2, and Figure 3, appear in Table 1 and Table 2. We claim that Equation (2) explains the change with P of the values of , and believe that the complex interaction among the vibrations or rotations of the bonds illuminated by the IR light justifies the observation that these changes are not necessarily monotonic. This issue however requires further investigations.
Finally, in Equation (2), the number represents the number of bonds involved in a vibration. The need to introduce the number can be explained as follows. During the absorption of the IR light, when the average power P changes from 7.9 mW, to 12.1 mW, to 16.4 mW or to 25 mW or vice versa, the moment of inertia I does not change. Simultaneously, the magnitude of the vibrational frequency of each bond is constrained by the corresponding experimentally measured values. Therefore, a degree of freedom is required to match the energy absorbed from the IR light by the crystalline thin film, to the magnitude of the energy transferred from the IR light. The number is such a degree of freedom. Equation (2) suggests that larger values of P and increase the energy transferred from the IR light to the thin films and, by doing so, involve a larger number of bonds . This trend is confirmed by the estimated values of for both the cubic Yb2O3 and rhombohedral LaAlO3 films on Si reported in Table 3 and Table 4.
We can extract further consequences from Equation (2). One is that the direct proportionality between the moment of inertia I of each bond and the average power P of the IR light, i.e. , suggests that FTIR spectrometers with larger values of P than the current ones might generate spectra highly sensitive to the features of crystalline films with heavy atoms (low ) in the far IR region (smaller ). The second consequence is that Equation (2) might foster the understanding of phonon’s behavior in crystals. Indeed, the direct proportionality between the number of bonds and the average power, i.e. , suggests that the number of phonons increases with the average power of the IR light. Thus,
Table 3. Vibrational energy of the crystal lattices of cubic Yb2O3 and rhombohedral LaAlO3 at the minima of the absorption bands at vibrational frequencies , and the number of bonds involved in the vibrations at and 12.1 mW of the illuminating IR light over a surface area of ~1 cm2. The values of are extracted from Figure 1 and are the parameter in Equation (1).
Table 4. Vibrational energy of the crystal lattices of cubic Yb2O3 and rhombohedral LaAlO3 at the minima of the absorption bands at vibrational frequencies , and the number of bonds involved in the vibrations at , 16.4 mW and 7.9 mW of the illuminating IR light over a surface area of ~1 cm2. The values of , or the parameter in Equation (1), are extracted from Figure 2 for the Yb2O3 films and from Figure 3 for the LaAlO3 films. For simplicity for the Yb2O3 films we have chosen only two out of the three relevant absorption bands.
the number of phonons involved in the interaction between IR light and a thin crystalline film is constrained by the magnitude of the average power P of the IR light, not just by the scattering events occurring between phonons and imperfections in crystalline thin films.
Experimental results of other authors help us to assess the validity of Equation (2). We will present two examples: one from Faulkner et al. [20] , and another by Reimann et al. [9] .
Faulkner et al. [20] investigated the effects of a laser beam on the of He nano-droplets at 9 K. These authors used an IR laser with an average power P of ~80 mW, and observed a resonance at 2000 cm−1 (6 × 10¹³ Hz or 16.7 fs) with a ro-vibrational transition in a carbonyl sulphide (OCS) molecule accommodated in a He nano-droplet. Furthermore, the transfer of energy from the IR laser to the OCS molecule was observed to lead to the evaporation of ~400 He atoms in the nano-droplet. Using Equation (2) we estimate the energy transferred from the IR laser to the OCS molecule to be (or 8.3 keV). The OCS molecule uses this energy to initiate a ro-vibrational motion which, in turn, transfers an energy of ~3.3 × 10⁻¹⁸ J (or 20.8 eV) to each of the 400 He atoms in the nano-droplet for a 2000 cm−1 excited state. The 20.8 eV for each He atom is about 25 × 103 times larger than the 0.83 meV energy per atom estimated to enable the evaporation of the He atoms (P. L. Raston, James Madison University, oral communication, 2018). We justify this four orders of magnitude discrepancy between the evaporation energies per atom, 20.8 eV and 0.83 meV, by claiming that 20.8 eV for each He atom are needed to overcome the strong coupling among the He atoms in superfluid He nanoparticles at low temperature (9 K). On the other hand, the evaporation energy per He atom of 0.83 meV, estimated by the authors of Ref. [20] , seems very small. Indeed, for comparison, we recall that an energy of ~50 meV transmitted by visible light with to electrons in semiconductors is sufficient to cause each one of them to jump from shallow donor levels to the conduction band [21] . This amount of energy is small but consistent with the fact that the mass of one electron is about four orders of magnitude smaller than the mass of a He atom.
Reimann et al. [9] investigated the relationship between light’s power P and the rotational frequency of an optically trapped silica nanoparticle [9] . In their experiment, a laser beam illuminates a nanoparticle, transfers energy to it, and causes the nanoparticle to rotate. From Equation (2), we estimate that, with a laser beam with wavelength 1565 nm ( ) and average power P of 200 mW [9] , the energy transferred to the nanoparticle is . To induce nanoparticle to rotate with rotational frequency at a pressure of 1.1 × 10⁻⁵ mbar, this value of requires a moment of inertia . From this value of I, and knowing that the spherical nanoparticle’s radius is 50 nm [9] , we infer that the mass of one silica nanoparticle is 0.968 × 10⁻¹⁸ kg, which implies a density of 1.85 × 10³ kg/m3. Such a density is only 3.7 times the published value of 0.49 × 10³ kg/m3 [22] . This finding suggests that is a good estimate of the energy transferred from the IR light to the nanoparticle. This finding also enables us to exploit Equation (2) to obtain the rotational frequency versus average power P in the case of at a pressure of ~1.1 × 10⁻⁵ mbar, and . The result is reported in Figure 5, which
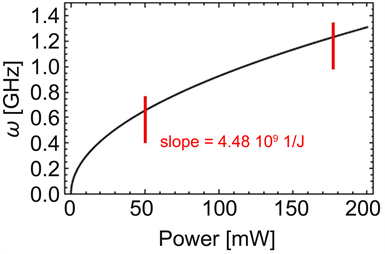
Figure 5. Rotational frequency of a nanoparticle versus average power P of the IR light obtained using Equation (2) with average power 200 mW at a wavelength of 1565 nm ( ) from Ref. [9] , , , and , a for nanoparticles at a pressure of 1.1 × 10⁻⁵ mbar. The rotational frequency increases almost linearly with P at a “slope” of 4.48 × 10⁹ J−1 between the two bars. This finding is in good agreement with Ref. [9] , which reports a “slope” of 0.3 × 10⁹ J−1 at a pressure of 1 × 10⁻⁴ mbar.
shows that the rotational frequency increases almost linearly with the average power P between the two bars with a “slope” of 4.48 × 10⁹ J−1. This finding is in good agreement with the “slope” of 0.3 × 10⁹ J−1 at a pressure of 1 × 10⁻⁴ mbar found in Ref. [9] . This result reveals the relationship between P and of an optically trapped silica nanoparticle [9] , and pictures the torque transfer mechanism involved in this experiment as an effect of the law of conservation of energy.
6. Conclusions
Our work proposes a case in which the magnitude of the average power P of an electromagnetic (EM) wave, together with its period , may be correlated with the magnitude of the mechanical motions that either generate the EM waves or are generated by them. Using Fourier transform infrared (IR) spectra of thin films we have shown that the average power P of the IR light affects the mechanical motion, in the form of rotation or vibration, of the bonds involved. We explain the phenomenon by linking, through the law of conservation of energy, the value of the energy , where is the period of the IR light, to the vibrational frequency , the number , and the moment of inertia I of the rotating or vibrating bonds affected by the illumination under the IR light. From a practical point of view, this finding highlights the possibility of manufacturing IR spectrometers adopting sources of IR light with larger average power P than those currently used. Such a strategy would enable maximizing the sensitivity of the Fourier transform IR spectra of crystalline films with heavy atoms in the far IR region. The users of spectrometers with higher power IR light sources should however be aware of the shifts in location of the minima of the absorption bands arising with changing P. From a more speculative point of view, our finding highlights that, as the magnitude of increases, so does the number of the crystal bonds involved in rotational or vibrational motions. The number represents a “classical” way (as opposed to the “quantum” way) to count the number of the quasi-particles usually called phonons through the direct relationship between the energy with the vibrational frequency and the moment of inertia I of the rotating or vibrating bonds affected by the illumination under the IR light. Thus, since the number can be viewed as the number of phonons in a crystal lattice, we conclude that the number of phonons is constrained by the average power P and the period of the IR light impinging on a thin crystalline film, not only by phonon scattering phenomena.
Finally, in the context of the current scientific literature our findings are relevant because they either justify results otherwise not explained, or agree with other reports. For instance, our results justify the displacement in the minima of the absorption bands in Fourier transform IR spectra detected but not explained by other authors [14] . In addition, our model based on the law of conservation of energy agrees qualitatively and/or quantitatively with results presented in the current literature regarding Thomson scattering [3] [4] , neutron star merger events [7] , vibrational spectroscopy [2] [20] and optical manipulation of nanoparticles [9] .
Acknowledgements
This work was supported by the U.S. Office of Naval Research (ONR) awards # N000141410378 and N000141512158, the JMU 4-VA Consortium (2016-2017), the JMU Center for Materials Science, and the JMU Department of Physics and Astronomy. The authors thank Prof. Gregory N. Parsons (NCSU) and Dr. John C. Zimmerman (JMU) for fruitful discussions.
Conflicts of Interest
The authors declare no conflicts of interest regarding the publication of this paper.
Cite this paper
Scarel, G. and Stevens, E.C. (2019) The Effect of Infrared Light’s Power on the Infrared Spectra of Thin Films. World Journal of Condensed Matter Physics, 9, 1-21. https://doi.org/10.4236/wjcmp.2019.91001
References
- 1. Garcia-López, V., Chen, F., Nilawski, L.G., Duret, G., Aliyan, A., Kolomeisky, A.B., Robinson, J.T., Wang, G., Pal, R. and Tour, J.M. (2017) Molecular Machines Open Cell Membranes. Nature, 548, 567-572. https://doi.org/10.1038/nature23657
- 2. Stensitzki, T., Yang, Y., Kozich, V., Ahmed, A.A., Kossl, F., Kühn, O. and Heyne, K. (2018) Acceleration of a Ground-State Reaction by Selective Femtosecond-Infrared-Laser-Pulse Excitation. Nature Chemistry, 10, 126-131. https://doi.org/10.1038/nchem.2909
- 3. Yan, W., Fruhling, C., Golovin, G., Heden, D., Luo, J., Zhang, P., Zhao, B., Zhang, J., Liu, C., Chen, M., Chen, S., Banerjee, S. and Umstadter, D. (2017) High-Order Multiphoton Thomson Scattering. Nature Photonics, 11, 514-520. https://doi.org/10.1038/nphoton.2017.100
- 4. Har-Shemesh, O. and Di Piazza, A. (2012) Peak Intensity Measurement of Relativistic Lasers via Nonlinear Thomson Scattering. Optics Letters, 37, 1352-1534. https://doi.org/10.1364/OL.37.001352
- 5. Xu, Y., Cao, W., Ahn, K., Jing, J., Chae, J., Huang, N., Deng, N., Gary, D.E. and Wang, H. (2018) Transient Rotation of Photospheric Vector Magnetic Fields Associated with Solar Flare. Nature Communications, 9, 1-8. https://doi.org/10.1038/s41467-017-02509-w
- 6. Smit, R., Bouwens, R.J., Carniani, S., Oesch, P.A., Labbé, I., Illingworth, G.D., Van Der Werf, P., Bradley, L.D., Gonzalez, V., Hodge, J.A., Holwerda, B.W., Maiolino, R. and Zheng, W. (2018) Rotation in [CII]-Emitting Gas in Two Galaxies at a Redshift of 6.8. Nature, 553, 178-181. https://doi.org/10.1038/nature24631
- 7. Mooley, K.P., Nakar, E., Hotokezaka, K., Hallinan, G., Corsi, A., Frail, D.A., Horesh, A., Murphy, T., Lenc, E., Kaplan, D.L., De, K., Dobie, D., Chandra, P., Deller, A., Gottlieb, O., Kasliwal, M.M., Kulkarni, S.R., Myers, S.T., Nissanke, S., Piran, T., Lynch, C., Bhalerao, V., Bourke, S., Bannister, K.W. and Singer, L.P. (2018) A Mildly Relativistic Wide-Angle Outflow in the Neutron-Star Merger Event GW170817. Nature, 554, 207-210. https://doi.org/10.1038/nature25452
- 8. Draine, B.T. and Lazarian, A. (1998) Electric Dipole Radiation from Spinning Dust Grains. The Astrophysical Journal, 508, 157-179. https://doi.org/10.1086/306387
- 9. Reimann, R., Doderer, M., Hebestreit, E.E., Diehl, R., Frimmer, M., Windey, D., Tebbenjohanns, F. and Novotny, L. (2018) GHz Rotation of an Optically Trapped Nanoparticle in Vacuum. Physical Review Letters, 121, 1-5.
- 10. Boone, D.E., Jackson, C.H., Swecker, A.T., Hergenrather, J.S., Wenger, K.S., Kokhan, O., Terzic, B., Melnikov, I., Ivanov, I.N., Stevens, E.C. and Scarel, G. (2018) Probing the Wave Nature of Light-Matter Interaction. World Journal of Condensed Matter Physics, 8, 62-89. https://doi.org/10.4236/wjcmp.2018.82005
- 11. Griffiths, P.R. and de Haseth, J.A. (2007) Fourier Transform Infrared Spectrometry. John Wiley & Sons, Hoboken, NJ.
- 12. Parsons, G.N., George, S.M. and Knetz, M. (2011) Progress and Future Directions for Atomic Layer Deposition and ALD-Based Chemistry. MRS Bulletin, 36, 865-871. https://doi.org/10.1557/mrs.2011.238
- 13. Scarel, G., Svane, A. and Fanciulli, M. (2007) Rare Earth Oxide Thin Films: Growth, Characterization, and Applications. In: Fanciulli, M. and Scarel, G., Eds., Topics in Applied Physics, Springer Verlag, Heidelberg, Vol. 106.
- 14. Scarel, G., Hirschmugl, C.J., Yakovlev, V.V., Sorbello, R.S., Aita, C.R., Tanaka, H. and Hisano, K. (2002) Infrared Response of Vitreous Titanium Dioxide Films with Anatase Short-Range Order. Journal of Applied Physics, 91, 1118-1128. https://doi.org/10.1063/1.1427430
- 15. Malvestuto, M., Scarel, G., Wiemer, C., Fanciulli, M. and D’Acapito, F. (2006) X-Ray Absorption Spectroscopy Study of Yb2O3 and Lu2O3 Thin Films Deposited on Si(100) by Atomic Layer Deposition. Nuclear Instruments and Methods in Physics Research Section B, 246, 90-95. https://doi.org/10.1016/j.nimb.2005.12.020
- 16. Pavlik III, A., Ushakov, S.V., Navrotsky, A., Benmore, C.J. and Weber, R.J.K. (2017) Structure and Thermal Expansion of Lu2O3 and Yb2O3 up to the Melting Points. Journal of Nuclear Materials, 495, 385-391.
- 17. Sanz-Ortiz, M.N., Rodríguez, F., Rodríguez, J. and Demazeau, G. (2011) Optical and Magnetic Characterisation of Co3+ and Ni3+ in LaAlO3: Interplay between the Spin State and Jahn-Teller Effect. Journal of Physics: Condensed Matter, 23, Article ID: 415501. https://doi.org/10.1088/0953-8984/23/41/415501
- 18. Adachi, G.-Y. and Imanaka, N. (1998) The Binary Rare Earth Oxides. Chemical Reviews, 98, 1479-1514.
- 19. Zaho, J., Angel, R.J. and Ross, N.L. (2011) The Structural Variation of Rhombohedral LaAlO3 Perovskite under Non-Hydrostatic Stress Fields in a Diamond-Anvil Cell. Journal of Physics: Condensed Matter, 23, Article ID: 175901.
- 20. Faulkner, T., Miller, I. and Raston, P.L. (2018) Quantum Cascade Laser Spectroscopy of OCS Isotopologues in 4He Nanodroplets: A Test of Adiabatic Following for a Heavy Rotor. The Journal of Chemical Physics, 148, Article ID: 044308. https://doi.org/10.1063/1.5009908
- 21. Sarker, B.K., Cazalas, E., Chung, T.-F., Childres, I., Jovanovic, I. and Chen, Y.P. (2017) Position-Dependent and Millimetre-Range Photodetection in Phototransistors with Micrometre-Scale Graphene on SiC. Nature Nanotechnology, 12, 668-674.
- 22. Kimoto, S., Dick, W.D., Syedain, Z., Pui, D.Y.H. and Roberts, D.L. (2014) Effective Density of Silica Nanoparticle Size Standards. 2014 International Aerosol Conference, Busan, 28 August-2 September 2014.
- 23. Scarel, G., Bonera, E., Wiemer, C., Tallarida, G., Spiga, S., Fanciulli, M., Fedushkin, I.L., Schumann, H., Lebedinskii, Y. and Zenkevich, A. (2004) Atomic-Layer Deposition of Lu2O3. Applied Physics Letters, 85, 630-632.
- 24. Bonera, E., Scarel, G., Fanciulli, M., Delugas, P. and Fiorentini, V. (2005) Dielectric Properties of High-k Oxides: Theory and Experiment for Lu2O3. Physical Review Letters, 94, Article ID: 027602.
- 25. Gordon, A.L. and Scarel, G. (2018) Interaction in the Steady State between Electromagnetic Waves and Matter. World Journal of Condensed Matter Physics, 8, 171-183.
- 26. St. John, T.C., Marinelli, Z.J., Kaczmar, J.M., Given, R.P., Wenger, K.S., Utter, B.C. and Scarel, G. (2016) Conversion of Infrared Light into Usable Energy. Proceedings of SPIE, 9927, 99270C.
Appendix 1. Crystallinity of the Thin Films
We studied the crystallinity of the thin films on silicon using Fourier transform infrared (FTIR) spectroscopy in the far infrared (IR) region at 0˚ and 70˚ angle of incidence. Figure A1(a) shows the far-IR FTIR spectra of cubic structure of the Yb2O3 films [23] [24] . Figure A1(b) reports the rhombohedral structure of the far-IR FTIR spectra of LaAlO3 films on Si: this result is reported in G. Scarel, C. Wiemer, S. Spiga, M. Fanciulli, A. Zenkevich and Y. Lebedinskii, MDM National Laboratory―Italy, unpublished results, 2007.
Appendix 2. Wide FTIR Spectra with Double Side Polished Si Substrate
For the measurements presented in the main text we used single side polished Si as substrate for the thin films and double side polished Si as reference for the FTIR measurements. In Figure A2 we show the spectra on a larger wavenumber range compared to the range used in Figure 2(a) and Figure 3(a) of the main text. Figure A2(a) and Figure A2(b) show the original FTIR spectra of cubic Yb2O3 films on Si acquired with IR light’s power of 7.9 mW and 25 mW over a broad (a) and a more restricted (b) spectral range. The restricted range is closer to the far-IR region where the typical absorption bands of cubic Yb2O3 are found. Panels (c) and (d) show the original transmission FTIR spectra of rhombohedral LaAlO3 films on Si acquired with IR light’s power of 7.9 mW and 25 mW. Also in this case the restricted spectral range in panel (d) is closer to the far-IR region where the typical absorption bands of rhombohedral LaAlO3 are found.
Appendix 3. Wide FTIR Spectra with Single Side Polished Si Substrate
For comparison, we performed some measurements with single side Si a reference. This Si reference is similar to the Si substrate on which the thin films were deposited. We call this substrate as Si(2). Figure A3(a) and Figure A3(b) show the original FTIR spectra of cubic Yb2O3 films on Si(2) acquired with IR light’s power of 16.4 mW and 25 mW over a broad (a) and a more restricted (b) spectral range closer to the far-IR region where the absorption bands of cubic Yb2O3 are found. The background is different compared to the one in Figure A2(a)

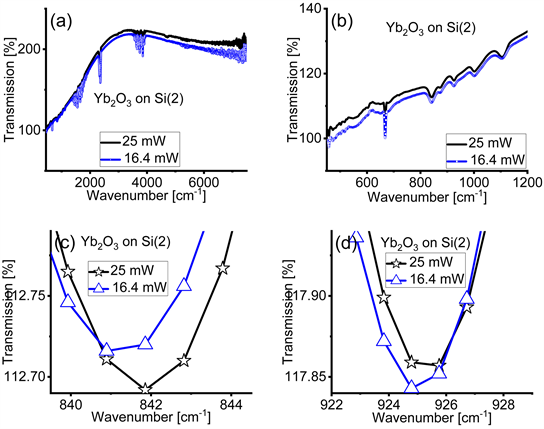
and Figure A2(b), however the absorption bands are the same. Panels (c) and (d) zoom into the range of the absorption bands of the Yb2O3 films. These absorption bands are the same as in Figure 2(b) and Figure 2(c) in the main text. We observe a displacement of the absorption bands with the different value of average power of the IR light. All the absorption bands are slightly shifted toward lower wavenumbers with Si(2). We conclude that the displacements of the absorption bands do not depend on the Si used as reference.
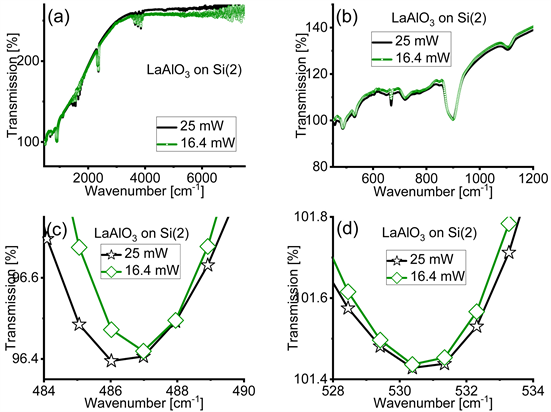
Figure A4(a) and Figure A4(b) show the original FTIR spectra of rhombohedral LaAlO3 films on Si(2) acquired with IR light’s power of 16.4 mW and 25 mW over a broad (a) and a more restricted (b) spectral range closer to the far-IR region where the absorption bands of rhombohedral LaAlO3 are found. The background is different compared to the one in Figure A2(c) and Figure A2(d), however the absorption bands are the same. Panels (c) and (d) zoom into the range of the absorption bands of the LaAlO3 films. These absorption bands are the same as in Figure 3(b) and Figure 3(c) in the main text. We observe a displacement of the absorption bands with the different value of average power of the IR light. All the absorption bands are slightly shifted toward lower wavenumbers with Si(2).
Appendix 4. Can We Find Displacements in the Location of the Absorption Bands of the Molecular Vibrations?
We tested whether molecular vibrations are affected by the power of the IR light using the same spectra we obtained for the measurements discussed in the main text collected with the Bruker spectrometer with IR light at average power P = 7.9 mW and P = 25 mW for Yb2O3 films on Si and LaAlO3 films on Si. The relevant results are shown in Figure A5. In panels (a) and (c) we zoom into the 2,500 cm−1 region where carbon residues are found. A close inspection in the 2,361 cm−1 region in panels (b) and (d) indicates no displacement in the location of the minima for the two different values of the average power. We notice however different depth in the absorption bands and ascribe the effect to the slight different purge time before collecting the spectra. Because of this finding we infer
that molecular vibrations are not affected by the values of the IR light power as the crystalline bonds. A more focused research on the effects of the power of the IR light on molecules would be necessary understand the issue in a more complete manner.
Appendix 5. Can We Find Displacements in the Location of the Minima of the Absorption Bands Due to Sample Heating?
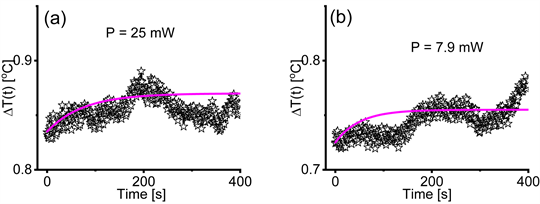
We performed temperature measurements by placing a thermocouple on the sample exactly where the IR beam hits the sample. In Figure A6(a) we show the jump in temperature observed on a sample in the first 400 seconds after starting the illumination with the 25 mW IR beam of the Bruker spectrometer. The amplitude of the jump is 0.035˚C. In Figure A6(b) we show the jump in temperature observed on a sample in the first 400 seconds after starting the illumination with the 7.9 mW IR beam of the Bruker spectrometer with the polarizer in the IR beam path. The amplitude of the jump is 0.03˚C. We consider the 0.035˚C and 0.03˚C differences in amplitude of the temperature jumps as negligible and therefore ineffective in causing the displacements in the location of the minima of the absorption bands. The results of the temperature measurements, summarized in Figure A6, are partly included in Refs. [10] [25] and [26] .
Appendix 6. Assessment of the Reproducibility of the Location of the Minima of the Absorption Bands for the Rhombohedral LaAlO3 Films on Si.
In Figure A7 we show the FTIR spectra of the rhombohedral LaAlO3 films on Si acquired with IR light’s power of 25 mW (panels (a) and (c)) and 7.9 mW (panels
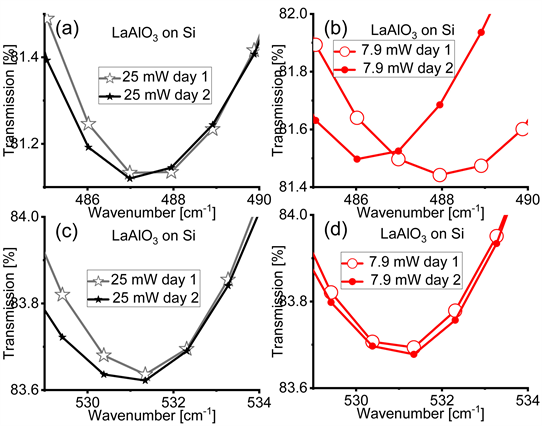
(b) and (d)) in two different days (day 1 and day 2). Most of the absorption bands do not change their location in different days. However a significant displacement is observed in the far-IR region for the low power case. We ascribe the effect to a random interaction among the vibrations or rotations of the bonds.