World Journal of Condensed Matter Physics
Vol.2 No.1(2012), Article ID:17625,4 pages DOI:10.4236/wjcmp.2012.21001
Impedance Spectroscopy of Concentrated Zirconia Nanopowder Dispersed Systems Experimental Technique
![]()
Donetsk O. O. Galkin Institute for Physics and Engineering, Donetsk, Ukraine.
Email: matscidep@aim.com
Received August 23rd, 2011; revised September 28th, 2011; accepted October 5th, 2011
Keywords: Impedance Spectroscopy; Nanopowder Dispersed Systems; Zirconia Dioxide; Low-Energy Action
ABSTRACT
We propose an experimental spectroscopy method for investigating the electrical characteristics of concentrated nanopowder dispersed systems based on compacted ZrO2. The technique is based on measurement of electrochemical impedance of the compacts. A possibility is shown for using the technique to study the processes of structure formation in nanopowder dispersed systems. It is shown that the technique is quite sensitive to detect subtle effects due to the chemical composition of the reactants from which the dispersed phase has been synthesized and external electromagnetic fields. In particular, it has been determined that the powders produced by chemical deposition possess conductivity by nanoparticle volume which is several order of magnitude lower than that for powders obtained from the chloride feedstock. It has been revealed that exposure to weak (H = 105 A/m - 106 A/m) pulsed magnetic fields leads to a redistribution of free charge carriers between volume and surface of the nanoparticles.
1. Introduction
At the present stage of scientific and technological development of methods for spectroscopy of electrochemical impedance (SEI), based on analysis of the response of the electrochemical system to disturbing action, such as an electrical signal, are becoming increasingly important in fundamental and applied physical research. With such a relatively low-cost measurement and experimental data processing, they help in visualizing and accurate assessing a wide range of electrical/electrochemical processes in the condensed disperse systems with different states of aggregation phase [1-6], and in getting an extensive information on surface and volume properties of the structural elements of the object. The main objective of impedance study in electrochemical and solid-state systems is to obtain information about the electrode processes, i.e. processes, occurring at the electrode/electrolyte interface [7,8].
At the present time, the SEI is usually applied to study heterogeneous disperse systems with solid-phase dispersion medium. Basically to detect the contribution of ionic and electronic components to the total conductivity of the solid ion electrolytes to separate the contribution of intragranular and intergranular conductivity in polycrystalline materials (ceramics), as well as to study the processes at the metal oxide interfaces [1]. However, with the appropriate mathematical tools, a number of scientific and technological problems for object of a different structural organization can be solved by the SEI method exclusively. The electrophysical properties of polymers, liquid dispersible systems and biological objects have been studied extensively [9-13].
Subject to the state of aggregation phase proximity of the nanopowder compacts and dispersed nanopowders (according to the classification of dispersed systems by the state of aggregation phase compacts nanopowder disperse systems with a high concentration of the dispersed phase in this case, the gaseous dispersion medium), there are reasons to suppose that nanopowder compacts as SEI objects with certain assumptions (in view change of in the number of compaction properties of nanoparticles affect the electrical properties of dispersed systems, in particular, the change of the phase composition of nanoparticles, their surface chemical activity etc.) also can be used to characterize the electrical/electrochemical properties of the constituent powders [14,15]. Thus, it becomes possible to study the kinetic of mass transfer of physicochemical relaxation processes, activated at the surface of nanopowder particles due to external influences in the range of room temperature, and the corresponding evolution of structural and energy characteristics of dispersive system with a high degree of accuracy in real-time.
According to [16] a promising direction towards the creation of “ceramic steel”, combining toughness and high ductility of ceramics caused by the size factor in changing the mechanism of deformation of the material is the application of energy such as a weak pulsed magnetic fields (PMF) that can change the surface potential relief of low-magnetic nanoparticles and have an activating effect on the nanopowder dispersed system as a whole. Despite the large number of clearly identified macroscopic effects, fix directly (in situ) the PMF initiated changes in the physical properties of nanoparticles it is almost impossible, even by modern methodological basis. Development of methodology and study of the electrical response nanopowder dispersed system to weak external effects of electromagnetic nature is currently an urgent task.
Development of a technique that allows investigating the influence of weak pulsed magnetic fields and other factors on the processes of structure formation in nanopowder dispersed systems was the main objective of this work.
The design goals were to investigate the possibility of using nanopowder compacts as auxiliary objects to the study by the method of SEI, the electrochemical/electrical properties of oxide nanoparticles, to develop appropriate techniques, including the calculation of the experimental data and to identificaty the effect on the defect subsystem of the nanoparticles and the structuralenergy state of nanopowder dispersed system preparation conditions, in particular, the chemical composition of precursors and weak electromagnetic fields.
2. Experimental Technique
As an object of investigation we use a compact of nanopowder ZrO2+3 mol% Y2O3, obtained by co-precipitation and crystallized at the annealing temperature of 400˚C for 2 hours [17].
Tablets (diameter d = 2 mm, height h = 4 mm) were compacted by HHP, P = 500 MPa. The pressed material was molted by uniaxial pressure, P = 40 MPa, indoors. To solve the problems of samples, several groups were studied in pairs. Half of the samples in the groups was used as a control series, while the second one had a deviation from the norm, for example, was subjected to external action of PMF. We used exponentially growing weak pulses (H = 105 A/m - 106 A/m) of the magnetic field. To study the effect of chemical prehistory on the electrochemical properties of concentrated nanopowder dispersed systems (CNDS) we used powders of one (mentioned above) composition obtained in one laboratory, but from different raw materials, in particular, from nitrogen oxide (N-samples), and the zirconium chlorine oxide (Cl-samples) (nitrate and chloride chemical engineering, respecttively). In order to investigate the time dependence, as well as the influence of external physical conditions (change in temperature and air humidity) on the electrical properties of the compact the spectra were periodically taken for several weeks.
SEI measurement were made indoors (18˚C, 9˚C) in an automatic mode by a precision virtual Measurer-analyzer of impedance parameters of type 2B-1 [18,19]. The frequency dependence of the imaginary ImZ (ω) and real ReZ (ω) components of the complex impedance Z (ω) in the frequency range 500 Hz - 1 MHz. For each point the measurement time were recorded t = 5 s.
The model and experimental impedance spectra were fitting using a computer program, published on the website of the European Internet Center of impedance spectroscopy [20,21].
To ensure linearity of the studied of the electrochemical system, the amplitude of the signal voltage applied to the sample was limited by 50 mV.
Carbon contacts were prepared by mechanical application of graphite to the surface of the samples.
SEI Meter and Its Operating Principle
Тhe converter is a separate unit to be connected to a serial port (RS-232) IBM-compatible personal computer (PC) and allows you to measure the parameters of the impedance (capacitance C, inductance L, resistance R, conductance G, the tangent of loss angle, quality Q, time constant, the modulus |Z|, phase angle, etc.), as well as nonelectrical quantities determined by the above parameters and the electrical equivalent circuit of the object of research.
The meter consists of a sinusoidal signal feeding the metering circuit (G), a unit of conversion impedance (UCI) to the complex voltage, phase analog-digital converter (PADC), in which the synphased and quadrature signal components were separated, a computer (PC), controlling the work of all units and were recording the measurement results into Excel files, as well as plots of hodograph (Figure 1).
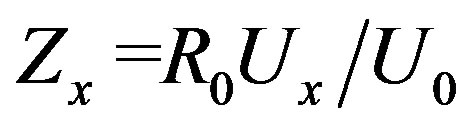
The Impedance Meter measures two complex voltages: the voltage Ux on the sample and voltage U0 on a resistive model connected in series with the sample with value of R0, proportional to the current Ix = U0/R0 through the sample.
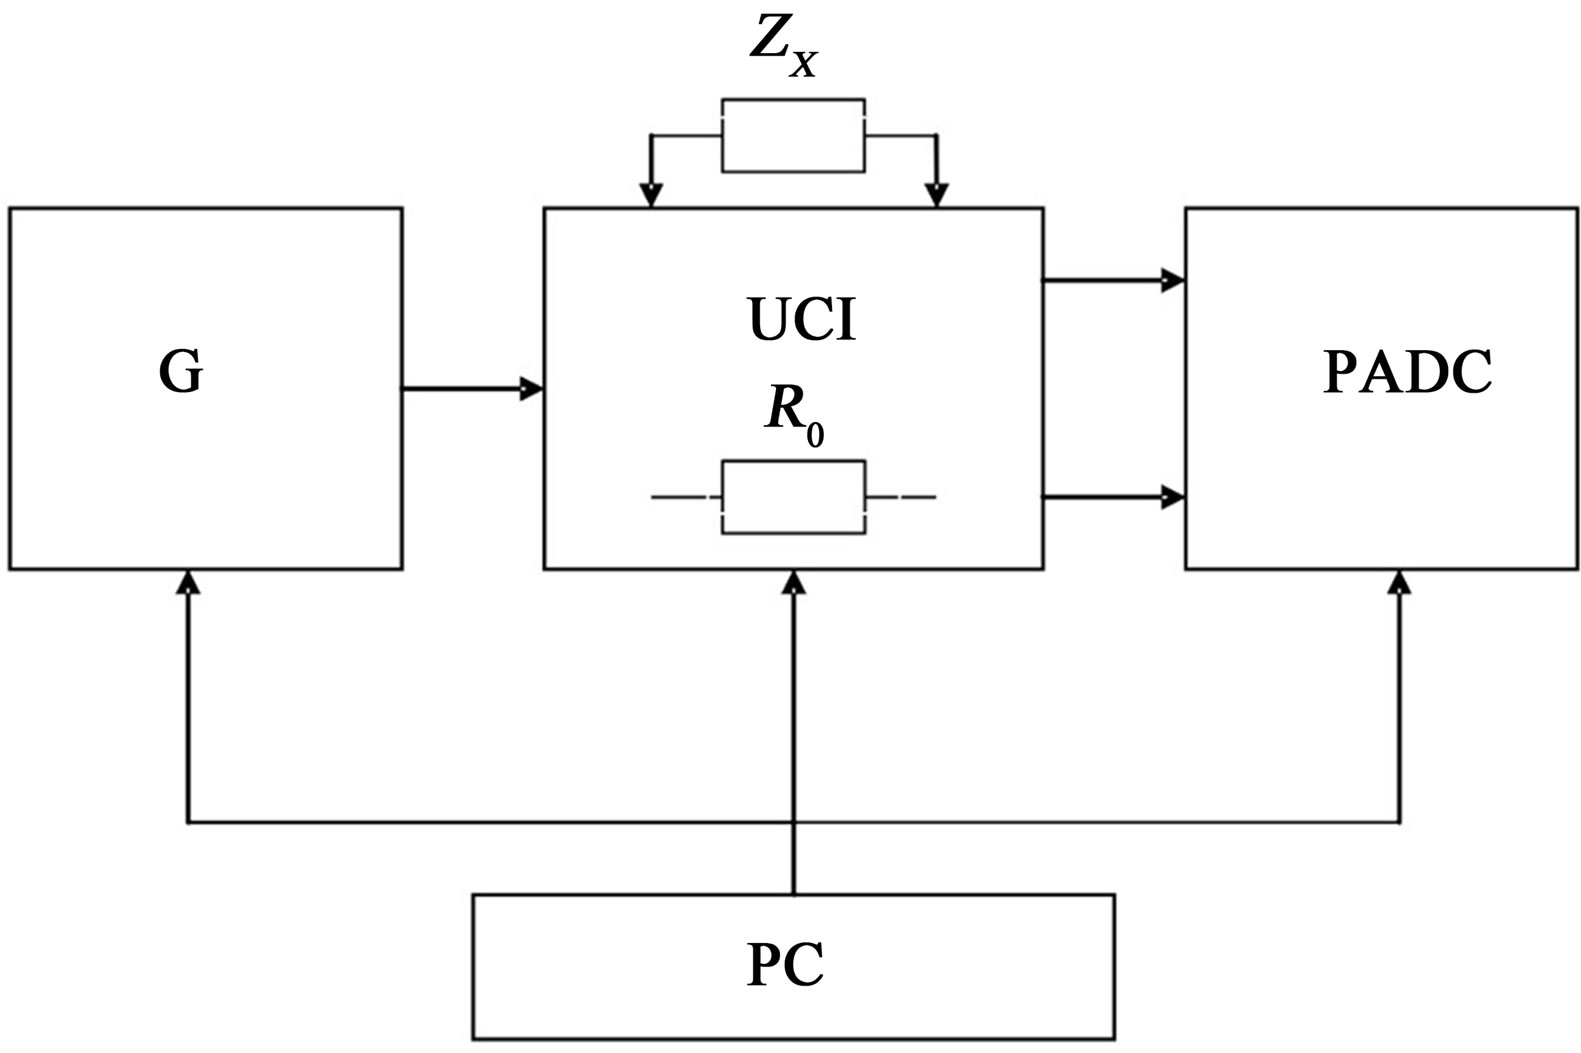
Figure 1. Block diagram of the meter the impedance analyzer type 2B-1.
 (1)
(1)
Phase-sensitive transformation of complex voltages, i.e. determination of their synphased and quadrature components was done by using the same PADC that allows achieving the invariance of the impedance Zx of the multiplicative component of the conversion error of the ADC. Parameters of multi-element equivalent circuits of measuring object were determined by measuring the frequency dependence of impedance.
3. Results and Discussion
3.1. Theoretical Justification of the Applicability of the Method for SEI Nanopowder Compacts
In general, the theory of linear systems imposes four important limitations on the object of study: 1) The response of the system must be described by linear expressions, and thus the principle of superposition should be observed; 2) The system must be stable, i.e. when removing the perturbation it must return to the original state; and 3) the system must be causal, i.e. should not give a response to the imposition of the disturbing signal; and 4) the impedance must be finite (physical systems can’t contain the features in the development of their properties) [23-26].
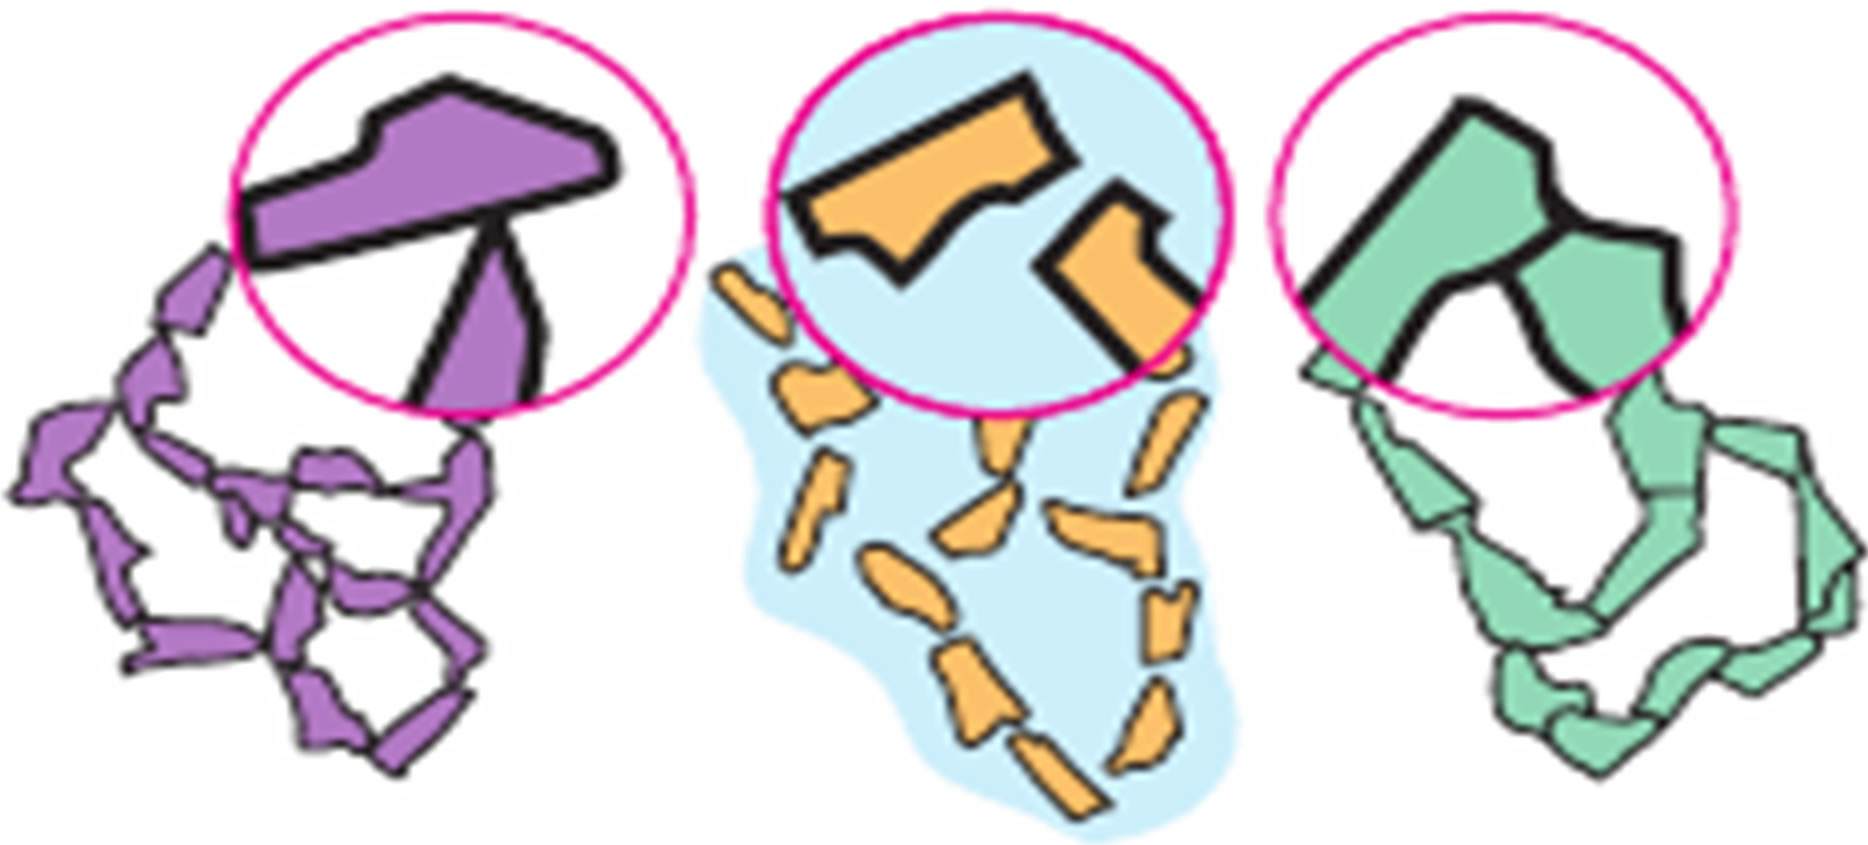
Given the availability of common physical chemical laws (properties), for disperse systems with solid-state (ceramic) and liquid and gas (powders) dispersion medium, including the behavior in electromagnetic fields [27], the range of objects studied by SEI based on the available mathematical tools can be significantly expanded. In particular, a nanopowder dispersion system at the stage of compaction by HHP can be an object of study. In fact, a nanopowder compact differs from the ceramic and disperse powder by the intensity of interaction of elements of the dispersed phase. In the case of ceramic interaction energy is large. The interaction force between the elements of the dispersed phase fc = 10–7 - 10–6 N, and the interaction energy Ec = 10–17 - 10–16 J. Such contact, according to the classification of [28], is the phase one (Figure 2). In the case of phase contact layer of the dispersion medium is practically absent, material of the heterogeneous boundaries differs from the dispersed phase (grain), by high concentration of defects and impurity atoms (if the plant material of the dispersed phase is a solid solution). In powder systems, the particles of the dispersed phase are usually linked by relatively weak coagulation contacts.
Under compaction, there is the increase in concentration of the disperse phase accompanied by the displacement of the layer of dispersion medium from the volume and by the appearance of atomic type contacts in the same (fc = 10−10 - 10−8 N, Ec = 10−19 - 10−18 J). The share of the latter increases with increasing compaction pressure [29]. As seen, the phase contacts in ceramics and atomic contacts in the powders have the of the same order Ec and very close values of the interaction forces fc. That is, HHP compacts are between ceramics and nanopowders in view of the nature of structure organization and the share of coagulation contacts in them far exceeds the share of atomic. Ones consequently, by the level of physical and chemical characteristics and electrical properties the compacts are comparable with nanopowder media, where as their spatial structure is actually similar to the polycrystalline structure of sintered ceramics. Therefore, the mathematical model and the equivalent electrical circuit corresponding to ceramic objects can be theoretically applied to describe the electrical properties of concentrated nanopowder dispersed system, taking into account the difference in conductivity of heterophase boundaries. Compacting the same in this case can be considered as a method of preparation of nanopowder objects, and method of SEI as an appropriate way to study electrical/electrochemical properties of the surface of individual particles.
3.2. Equivalent Electrical Circuit and Mathematical Model to Describe the Electrical Properties of the Compacts
Essentially, the method of impedance spectroscopy is a perturbation of the charge system of the studied material through applying a low electric voltage and direct measurement of the system response to perturbation. If revolting tension can be written down as:
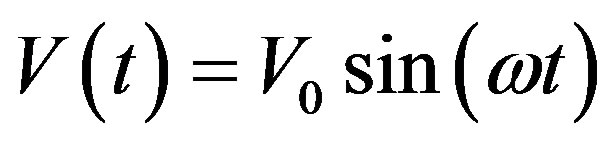 (2)
(2)
And response signal at the output register as the current flowing through the system under study
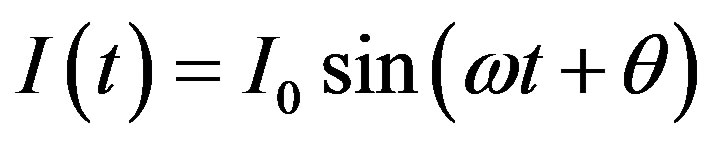 (3)
(3)
Then impedance is the resistance of the system Z (ω) can be written as:
 (a) (b) (c)
Figure 2. The main types of contacts between particles of dispersed phases that are formed in disperse systems according to the classification of P. A. Rehbinder: (a) Direct atomic (in powders); (b) Coagulation (in powders, pastes and suspensions); (c) Phase (in dispersed media).
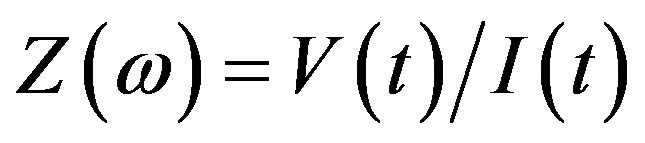 (4)
(4)
where ω = 2πf—circular frequency; θ—phase shift.
For determination of parameters of concrete mathematical model, describing electro physical processes in CNDS based on zirconia we consider the impedance spectrum of compacts (500 MPa) from powders of ZrO2+3 mol% Y2O3, 400˚C, 2 h, prepared from chloride raw material.
A typical frequency spectrum of the impedance (Nyquist diagram) of these samples is shown in Figure 3. It is evident that the resistance of compacts is finite. This confirms the validity of the above arguments on possibility of using the proposed technique to study the nanopowder systems by SEI methods.
On the hodographs of the impedance of Cl-sample Figure 3 these are two visually distinguishable fragments. Bottom left, in the highest frequency, there is the detectable part of the semicircle. Further, in the direction of decreasing frequency—less clear arc of a circle as a beam. The investigated electrode the measured object electrode cell spatially symmetric and has a symmetrical distribution of the impedance, respectively. Each section of the curve of the hodograph can be represented in the form of a specific circuit, which has its own time constant t. Every electrical chain interacts resonantly with the external electric signal. The Q-factor is determined by the frequency properties of the elements of the chain. The high-frequency portion of the curve describes the processes with small time constant t, and low frequency position a big one.
The plot of the hodograph in the form of a semicircle is usually interpreted as a parallel RC-circuit (RC-parallel circuit-oscillator) and characterizes the contribution to the impedance of the processes associated with the electric polarization of the material. Straight section, tends
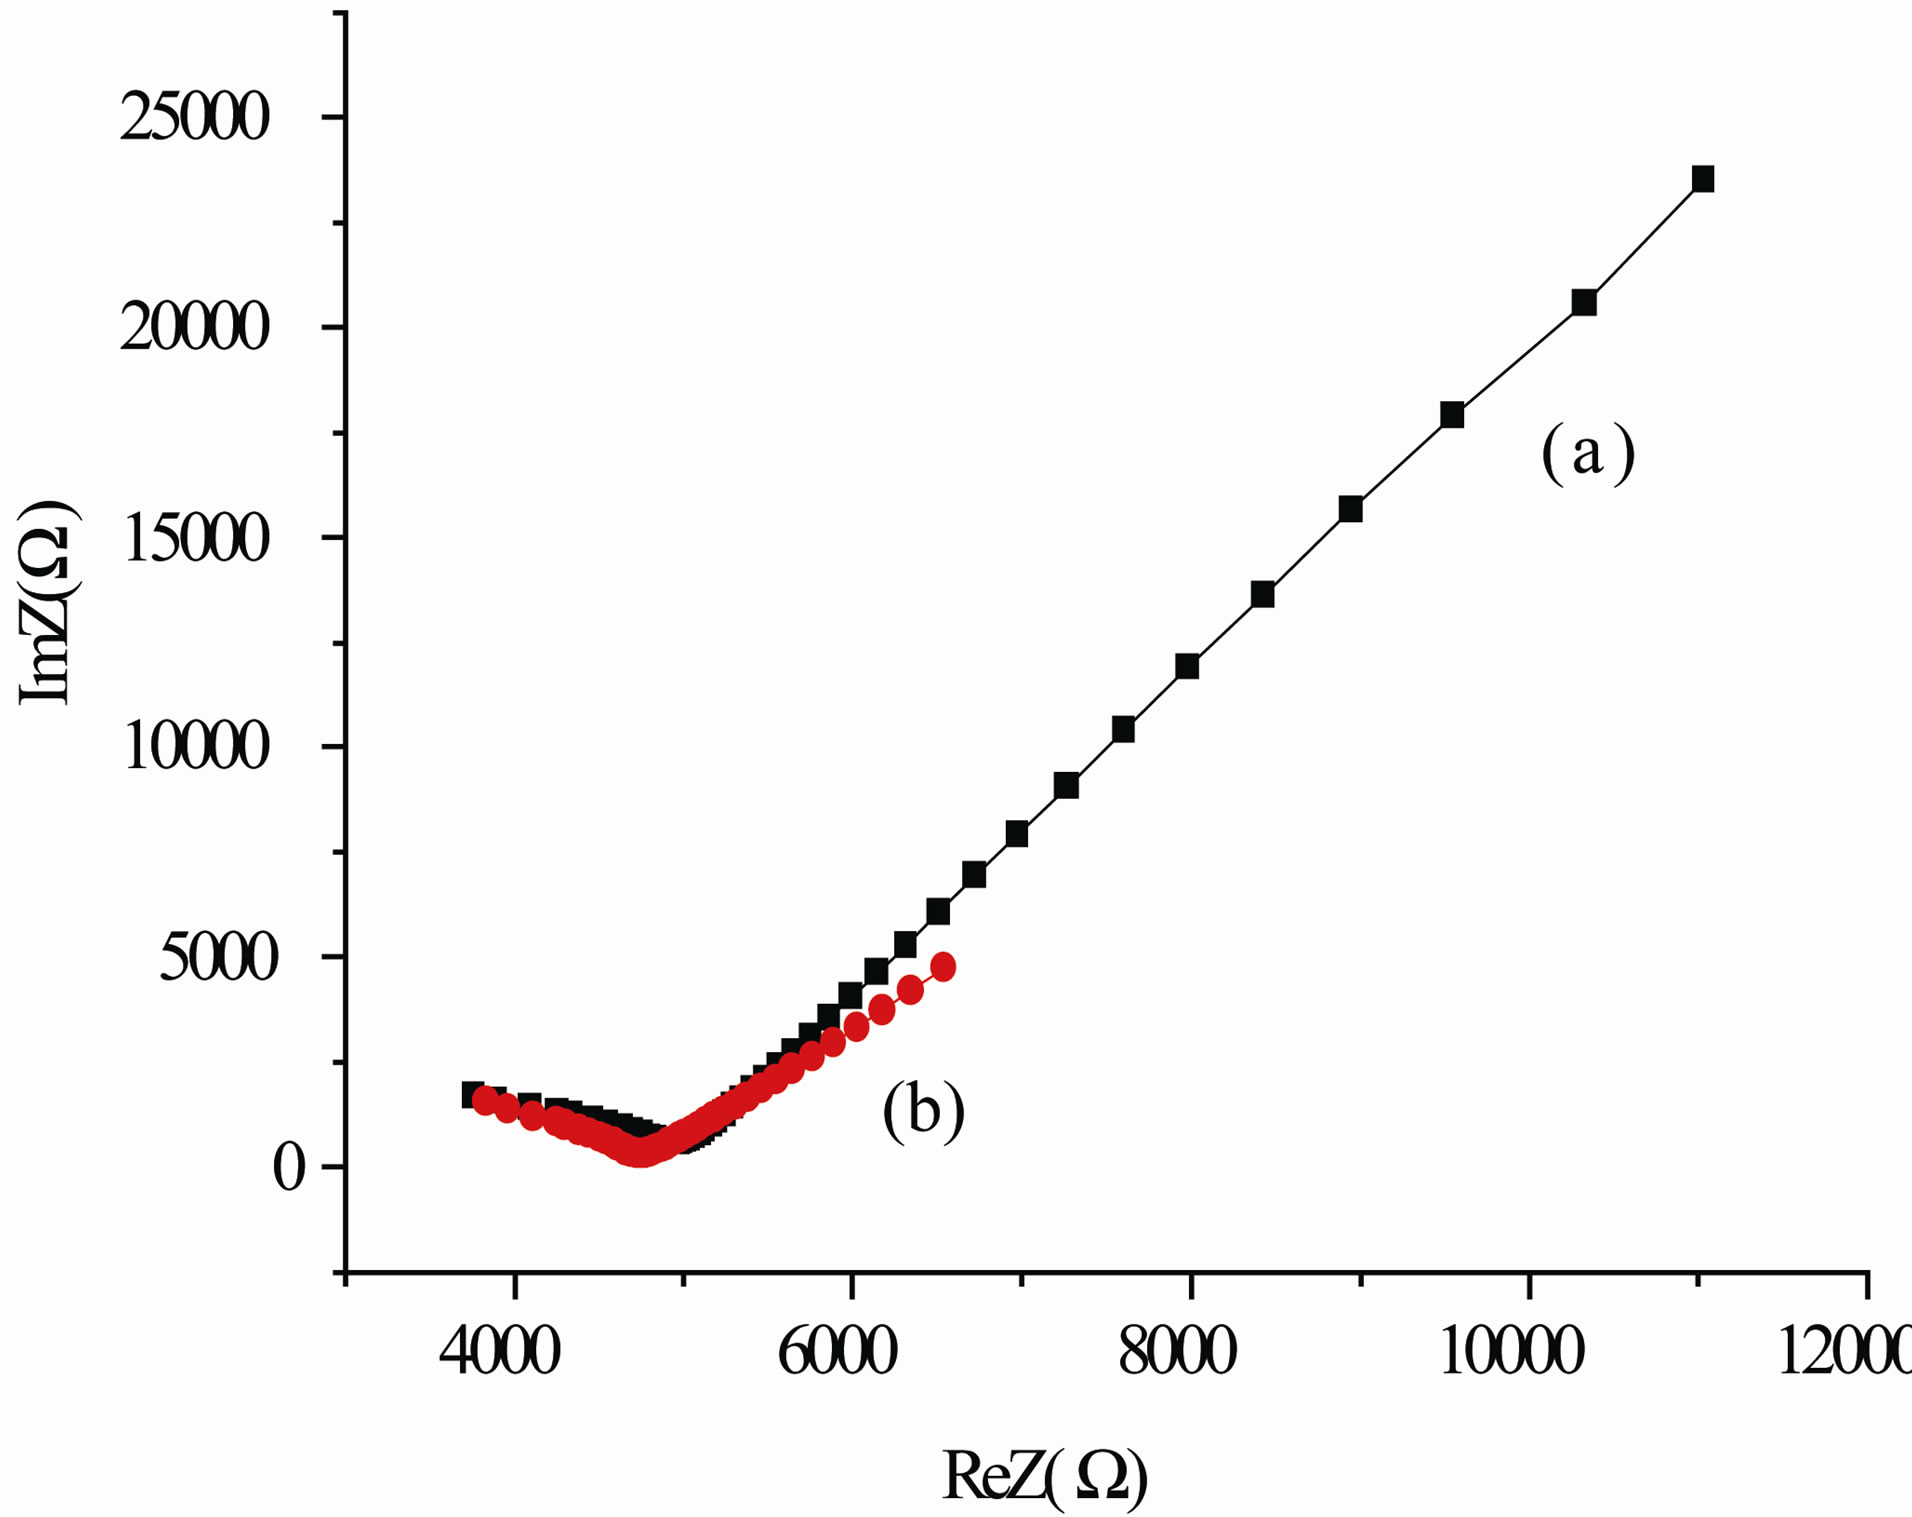
Figure 3. Frequency spectra of impedance HHP-compact (500 MPa) of powder ZrO2 + 3 mol% Y2O3, 400˚C, 2 h, obtained from the chlorate precursor itself (a) and after 96 h after compaction (b).
to represent the contribution to the impedance of diffusion processes. Polarization processes have a lower time constant t, than the diffusion ones. Therefore it is assumed that high-frequency region of the spectrum (semicircle) characterizes the conductance (admittance) in the volume of ceramic grains, or solid-state conductivity of the electrolyte in the case, if the measured cell is an ionistor [30]. The linear high-frequency part of impedance spectrum, in this case, is likely to characterize the diffusion processes in the interlayers between the particles and processes at the electrode surface.
Graphite electrodes have electrically conductance. The dispersion medium (in the case of ZrO2 nanoparticles) consists mainly of products of dissociative adsorption of water-ions of OH– and H+. When electrodes contact with dispersion medium of the compact, a heherophase boundary of the media with charge carries of physically different type is formed. Oppositely charged carriers of different kinds attract each other by an electric field, but for the most part they can’t cross the heterophase boundary and annihilate (blocking electrode). As a consequence, the boundary has the properties of electrical capacity. The magnitude of the capacitance C is the coefficient of proportionality between the signal voltage V (t) and the integral of the current I (t), flowing through the capacitance.
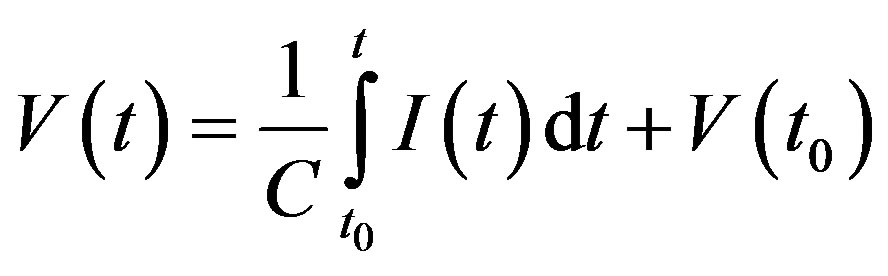 (5)
(5)
The capacity of the diffuse layer of ions contributes to the impedance in the form of the reactive component Zc = –j (ωC)–1. Therefore, the closer the linear part of the low-frequency impedance to the vertical, the more pronounced capacitive behavior of the diffusion-controlled area of the material, in this case the dispersion medium.
In our case, the straight lines N1 and N2 deviate from the vertical, respectively, through angles of about 51˚ and 62˚, which indicates the predominant contribution to the impedance of the diffusion-controlled area of the material Zc = ReZ – j (ωC)–1 resistive component ReZ = R. In addition, the ohmic nature of the linear plot suggests that it to a considerable extend reflects the processes at the surface of nanoparticles the dispersive medium, than at the dispersion medium electrode.
Given the symmetry of the measured electrochemical cell with respect to the applied ac signal, its block diagram can be represented in the form of several layers with different character of the conductivity (Figure 4).
The equivalent electrical circuit of each layer-basic element-consists of a resistance that shows the finite conductivity of the bulk layer, and the resistance the parallelconnected capacitance, which forms together with the resistance the time constant of the bulk layer. The resulting two-tier model exactly matches the structure of the socalled Voigt. Voigt model is used in modeling the condu-
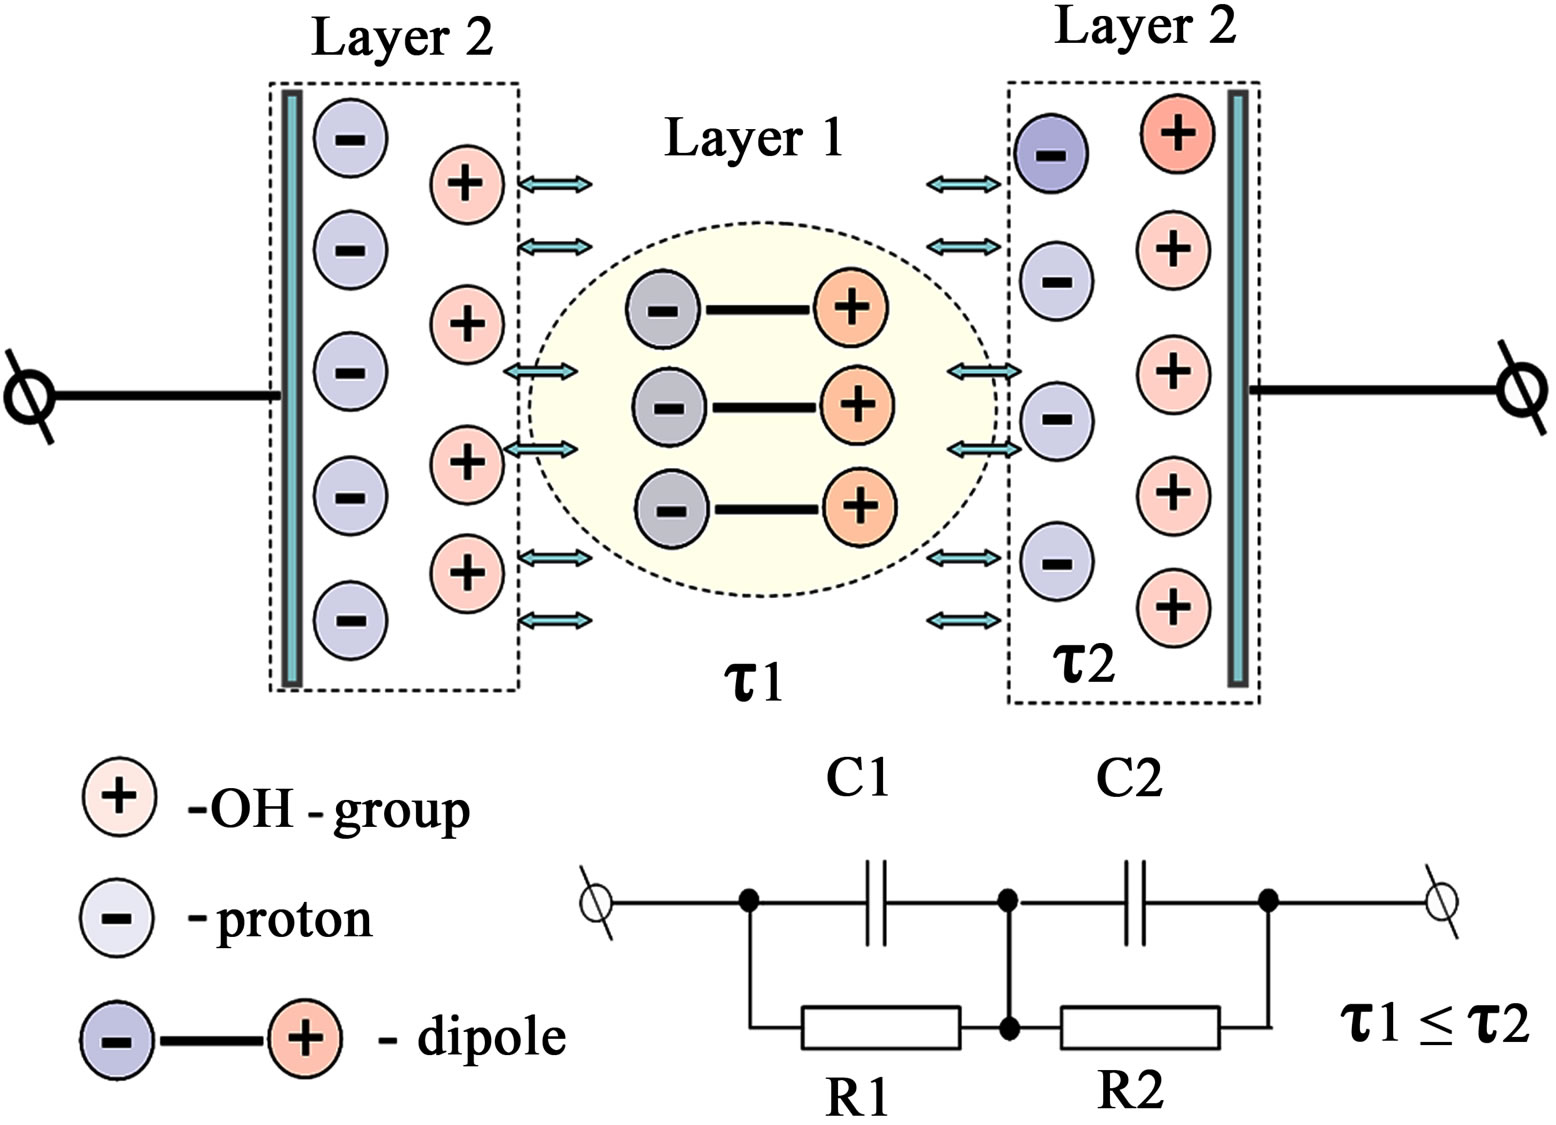
Figure 4. Schematic representation of the measured electrochemical cell. Layer 1: domain with a capacitive character of impedance; Layer 2: domain with a diffusive character of impedance.
ctivity of polycrystalline solid electrolytes.
Distortion of the semicircles with the center, located below the horizontal axis on the hodograph shows that the frequency properties of polycrystalline samples of zirconia can not be modeled by the equivalent circuit containing a frequency-dependent elements in the form of capacitors. At relatively low temperatures (below 500˚C), the experimental travel time curves correspond to the Voigt model, in which frequency-dependent elements (C) are replaced by constant phase elements (CPE). Constant phase element is a generalized and universal tool for modeling a wide class of electrochemical impedance systems. This element can be treated as an exponential distribution of the parameters of the electrochemical reaction associated with overcoming the energy barrier for charge and mass transfer, and impedance behavior caused by the fractal surface of the electrode.
Therefore, to describe the actual electrical/electrochemical processes in the material studied CNDS best model based on elements of the CPE, is used, usually in the case of ceramic samples.
The impedance of this element is described by the formula:
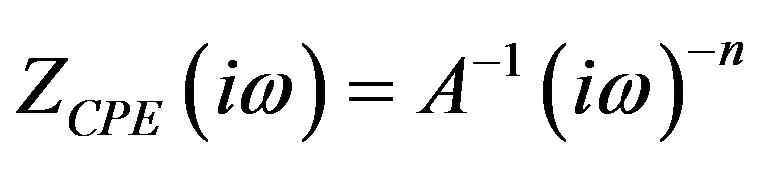
where A-coefficient of proportionality, n-exponent, which characterizes the phase shift.
Equivalent circuit modeling the behavior of the experimental data and the totality of structural characteristics of the material and its physical and chemical properties are shown in Figure 5.
For integer values n = 1, 0, –1 CPE element degenerates to the classical elements with lumped parameters C, R, L. For n = 0.5 the CPE gives Warburg impedance in pure form. For intermediate values of n, the CPE describes a different type of frequency distribution that approximates the behavior of C, R, L and W with distributed parameters. That is, this model allows us to describe a fairly wide spectrum of electrical/electrochemical phenomena in CNDS, developing under the excitation of the material with an electric signal of SEI meter.
Calculated by the computer settings to calculate the impedance spectrums of the sample under consideration are listed in Table 1.
A good agreement of model and experimental impedance spectra (Figure 6) after fitting with a computer program confirmed the validity of the choice of these theoretical models.
The accuracy of spectra coincidence was evaluated by the Kramers-Kronig relations. The error was ~1% (Figure 6). Given the geometric dimensions of the samples quantities of intragranular  and intergranular
  conductivity were calculated by the formulae:
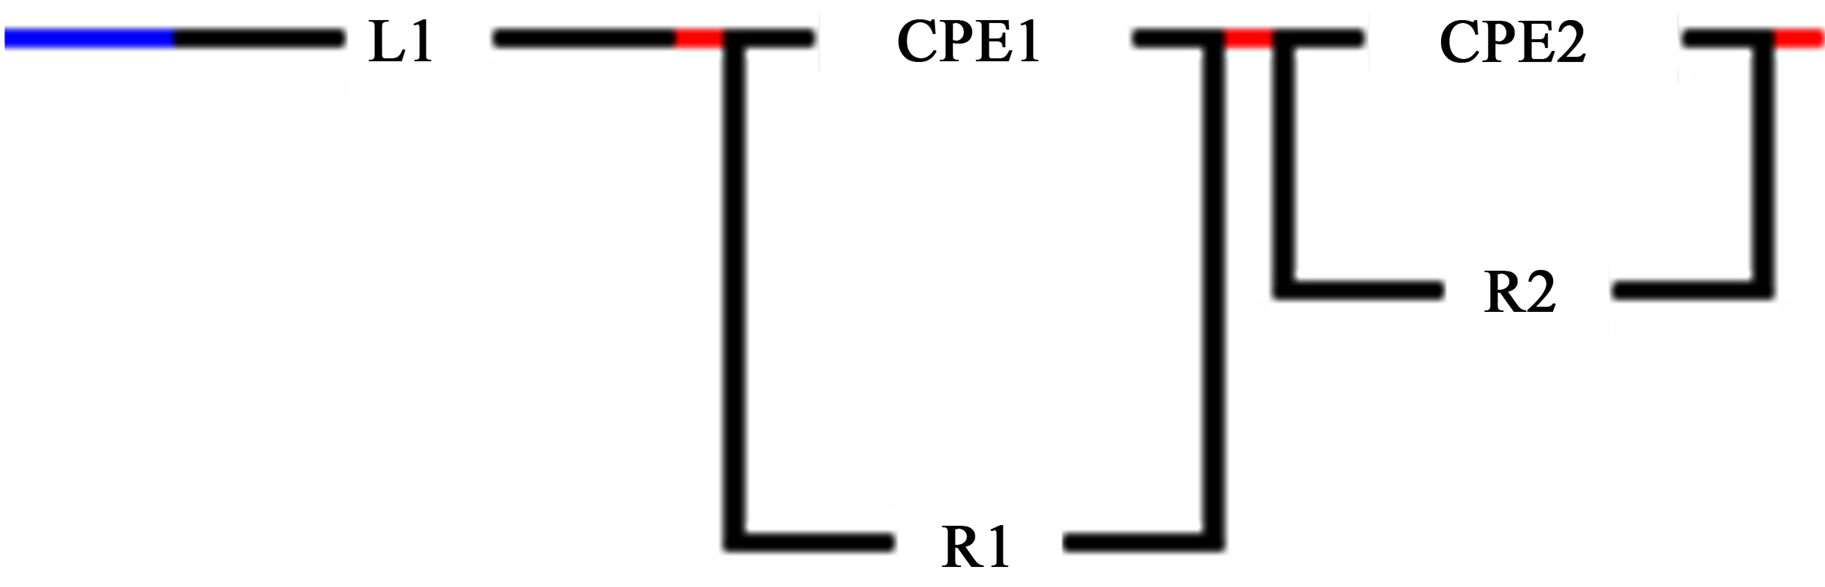
Figure 5. Equivalent circuit of the object-HHP-compact (500 MPa) of powder ZrO2 + 3 mol% Y2O3, 400˚C, 2 h, obtained from the chloride precursor.
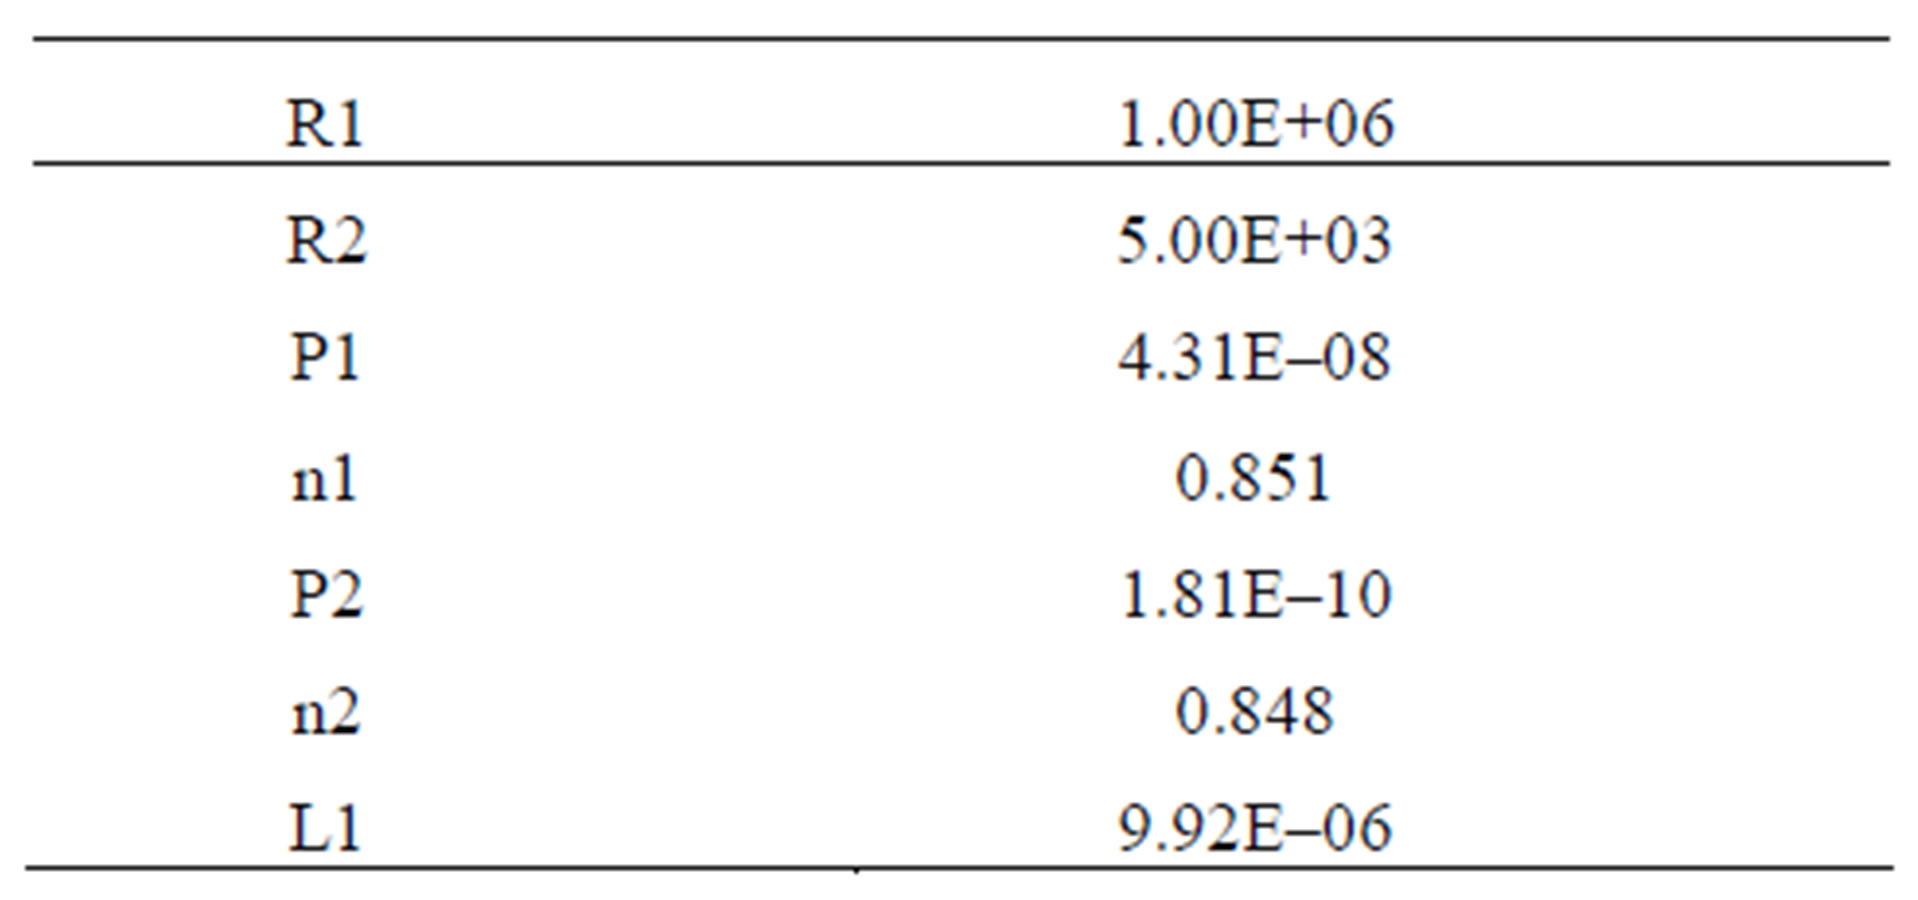
Table 1. Parameters for calculating the impedanse spectrum of Cl-sample.
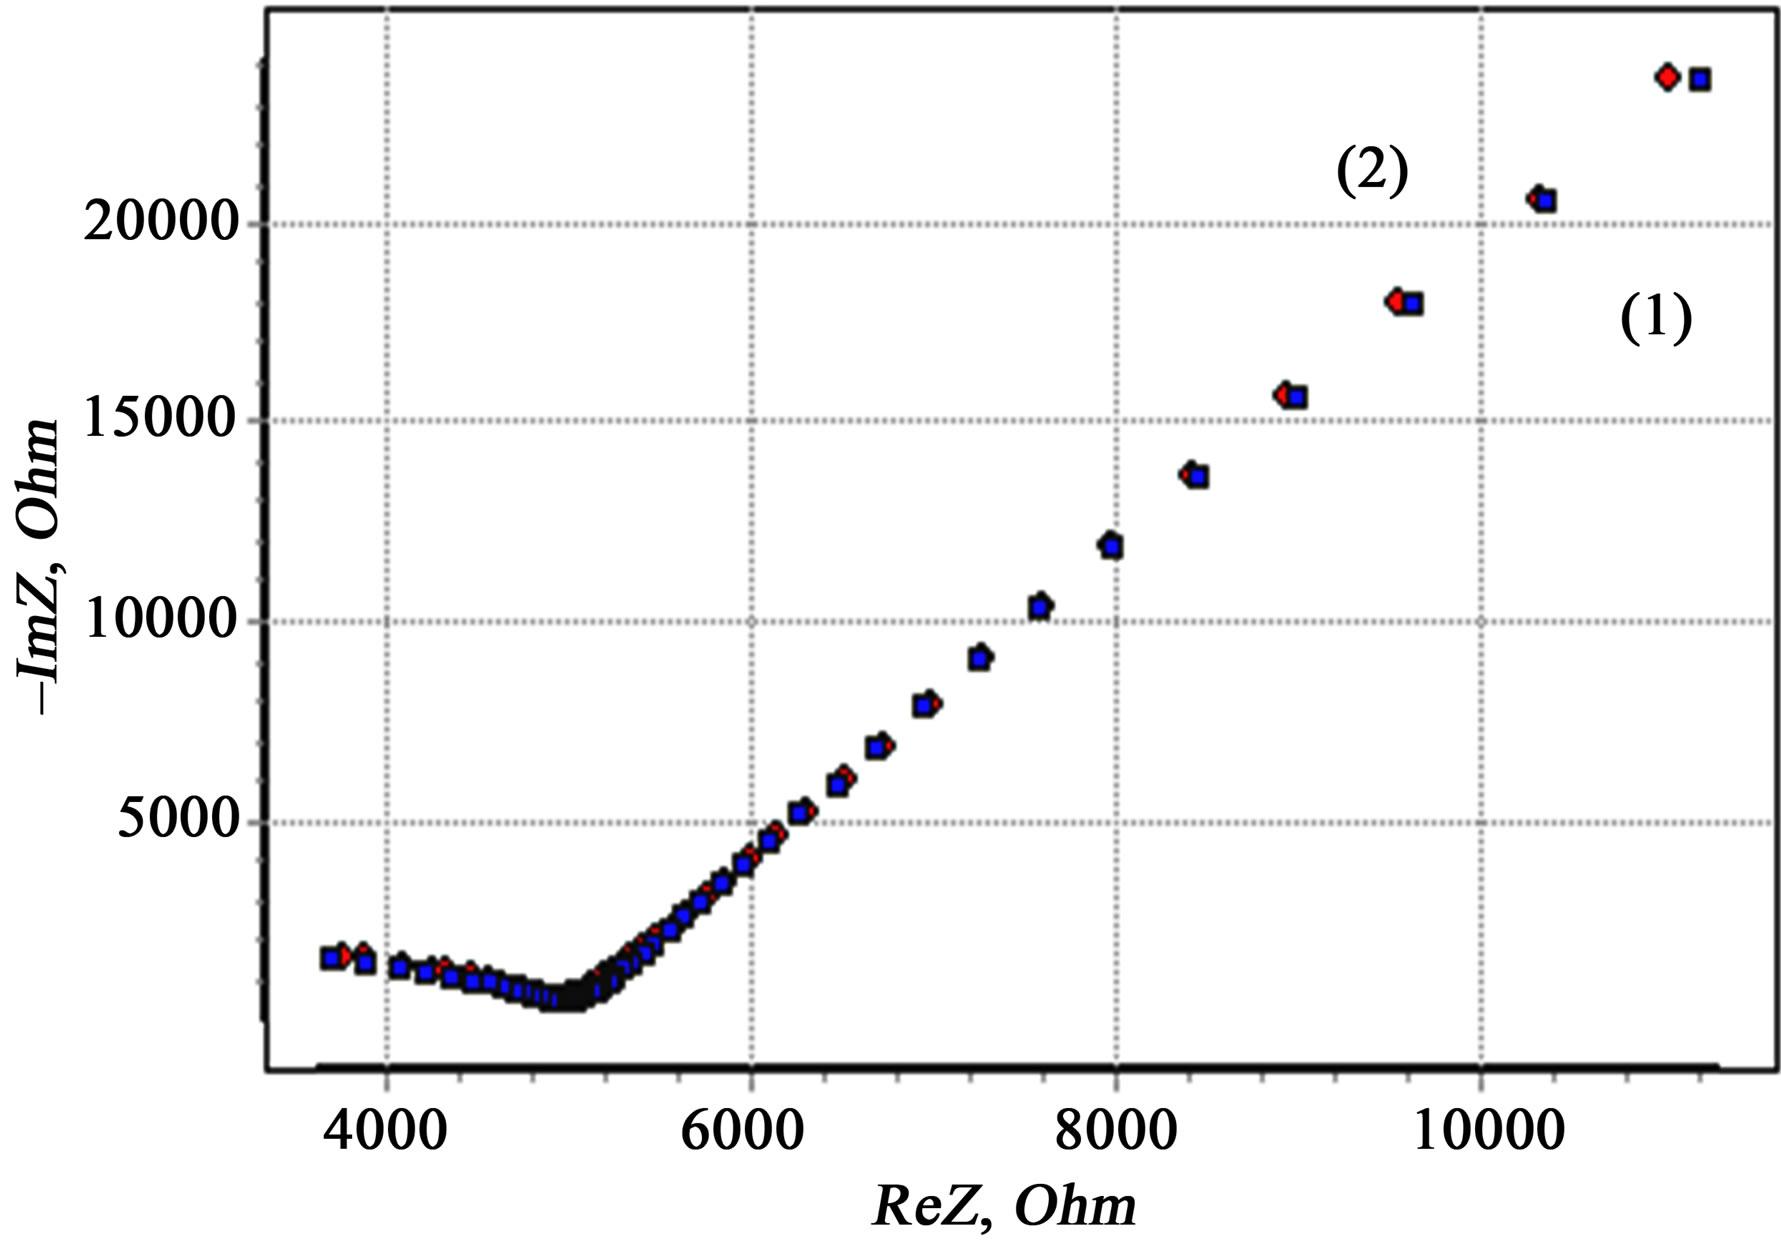
Figure 6. Protocol data reduction of experimental data by the Kramers-Kronig. Value of the model (1) and experimental spectra (2) for HHP-compact (500MPa) from powders ZrO2 + 3 mol% Y2O3, 400˚C, 2 h, obtained from the chloride precursor.
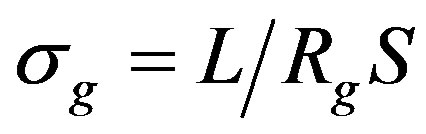
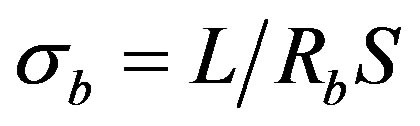 (6)
(6)
where L-length of the sample; S-cross-sectional area of the sample.
These used quantities have values σg = 9.35 × 10⁻⁶ Оhm–1·m–1 and σb = 1.87 × 10⁻³ Оhm–1·m–1 respectively. In this case the volume and conductivity of the surface layer of nanoparticles are the intragranular and intergranular conductivity. It should be noted that it is very difficult to determine these parameters by other methods. Thus, the presented technique allows to identify the structural features of CNDS up to the size of the particle s (dispersedphase elements; the size of the dispersed phase can be roughly determined by the spectra recorded with the reference samples) to determine the nature and dynamics of electrical processes that reflect the kinetic features of its self-organization.
3.3. Features of the Proposed Method
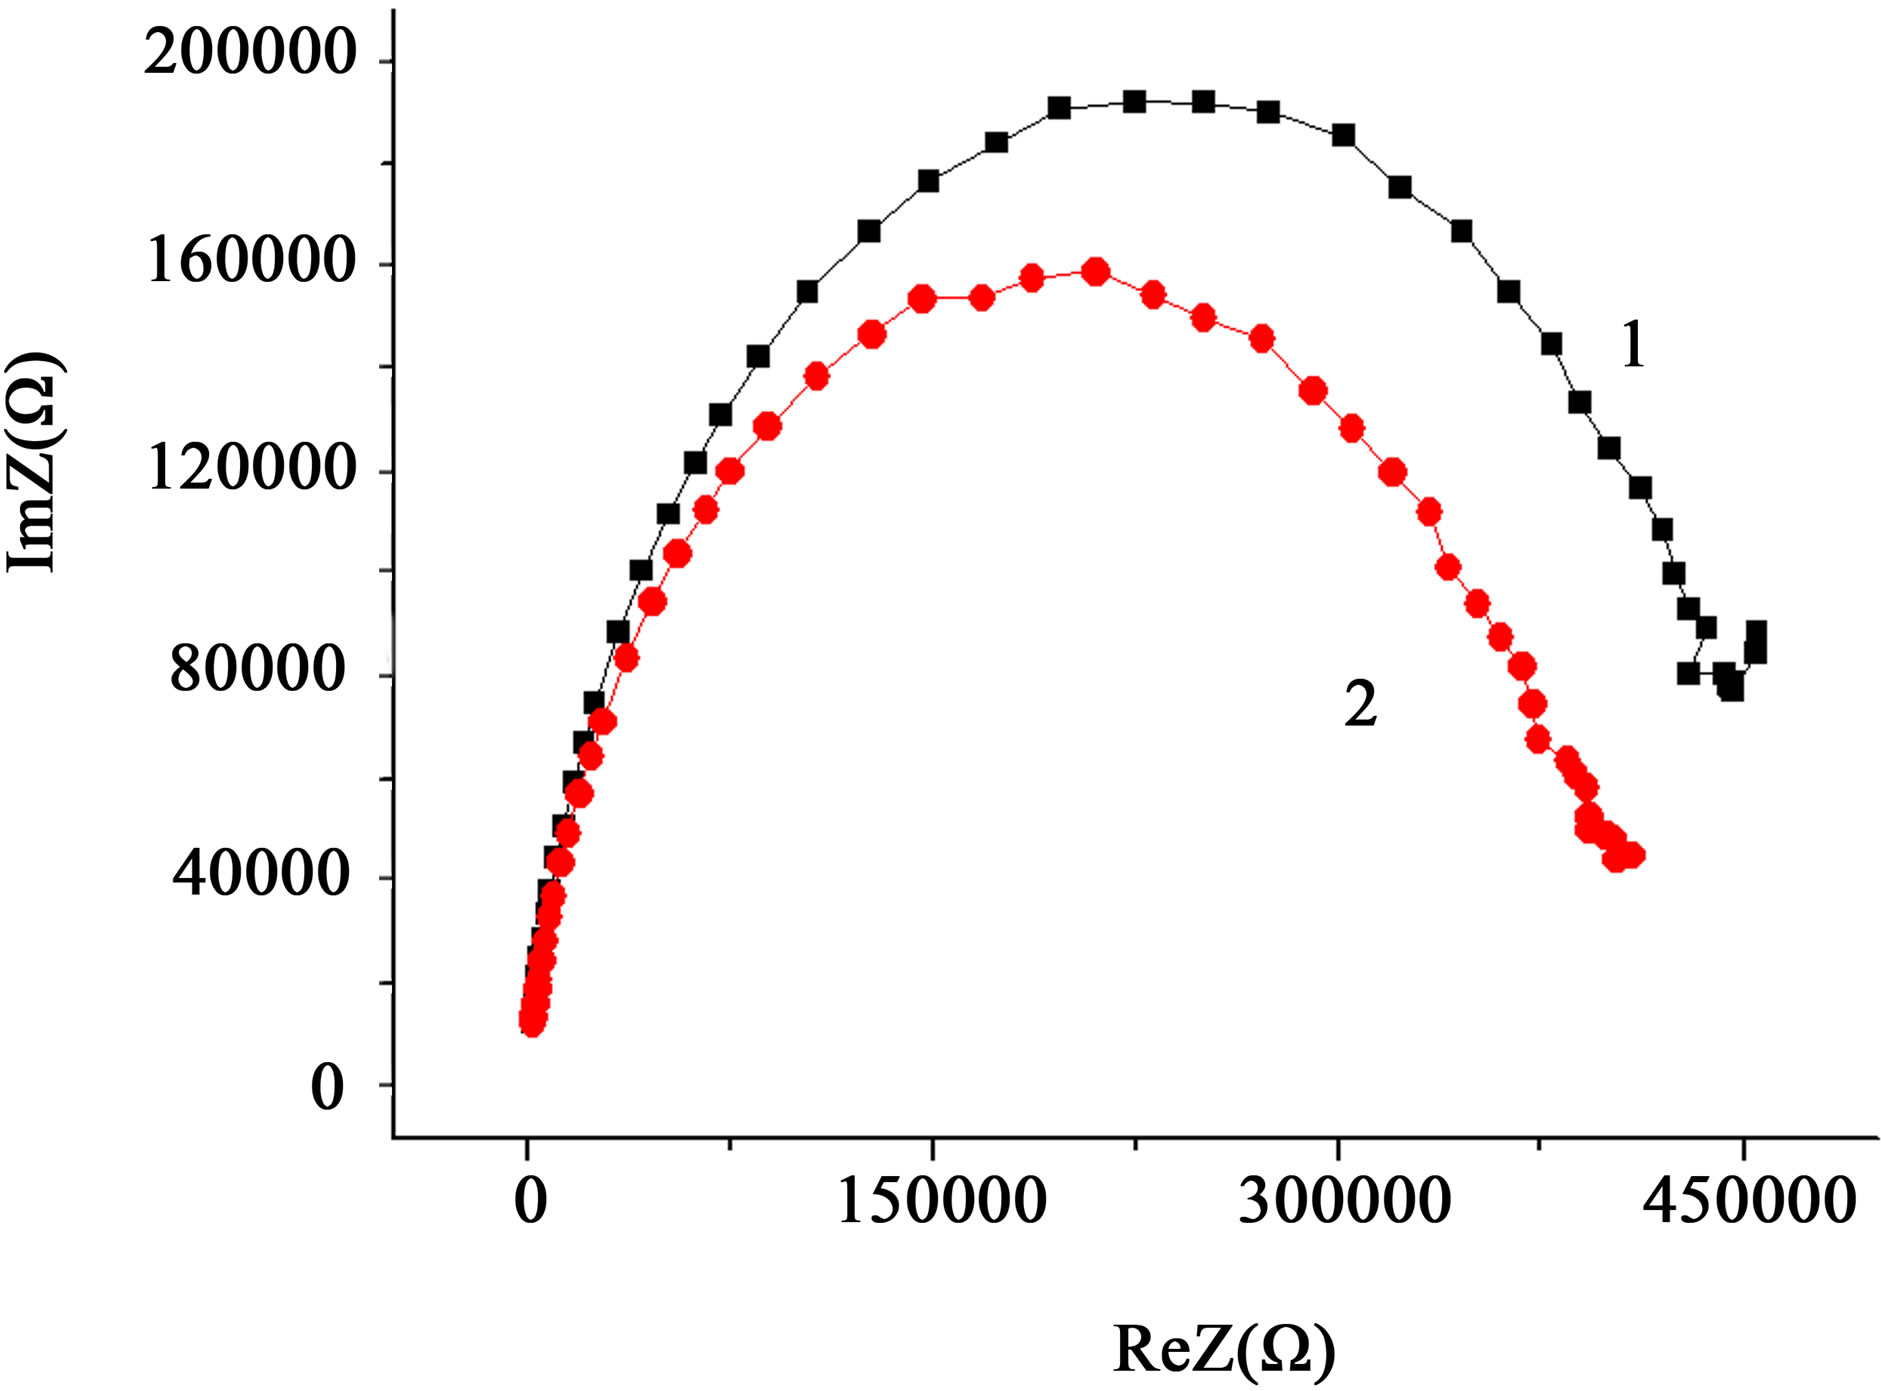
Features of the proposed method are not limited to calculating the electrical characteristics of the nanoparticle surface which reflect the state of the dispersed system at a moment. The results given belov that the EIS spectra of the present method contain information about the features of its structural evolution. In Figure 7 there are the spectra of CNDS from the powder of the same chemical composition as in Figure 3, but prepared from another precursor, namely zirconia oxynitrate (N-samples).
In contrast to the Cl-samples, in N-samples there is no straight section, which characterizes the conductivity of the dispersion medium.
This means that in this case (N), the main contribution to the impedance Z is made by polarization losses in the material of particles. For samples of N-material resistance is 2 - 3 orders higher than in Cl-samples (RCl = 106 - 107 Ohms).
In samples from the Cl-conductance of raw materials is carried out mainly by ions of the dispersion medium, and the main contribution to the impedance of the resistor makes electrolyte. On Figure 3 we have the pronounced effect of blocking the diffusion of charge carriers from electrodes with electrically conducting.
Thus, on the basis of SEI can be concluded that the main contribution to the impedance of N-samples made by the polarization processes/losses in the amount of nanoparticles, whereas Cl-samples dominated by the contribution of diffusion processes in the diffusion medium, or by charge by an external electric signal layer charge at the interfaces/in the surface layer of the electrodes.
Based on the analysis of travel-time hodographs of impedance to describe the electrical properties of the investigated CNDS, an appropriate equivalent circuit of Figure7 (b) was proposed.
The established differences between the electrical properties of nanopowders produced from different raw materials are to be reflected in processes of consolidation that are the next stage of pattern formation.
As seen in Figures 3 and 7, spectra obtained from each of the samples immediately after compaction and 96 hours later have an umber of significant differences. By multiple repetitions of measurements it was found that these differences are a consequence of structure formation, accompanied by a change in the charge state of structural elements, the formation and movement of free charge carriers. In particular, the nature of the dependence of the impedance change-namely, decreasing its real and imaginary parts (the spectrum is “stretched” in the low-frequency region) after staying (96 h) shows a drop in the resistance R1 and the change in the degree of constant phase element CPE1, which may be in favor of the increase in the number of charge carriers, reducing the forbidden band gap, as well as of reduction of the effects responsible for the resistance along the grain boundaries [31].
3.4. Identification of Low-Force Impactson CNDS
Investigation of the processes of nanopowder dispersed systems self-organization is currently a very topical issue
 (a)
(a)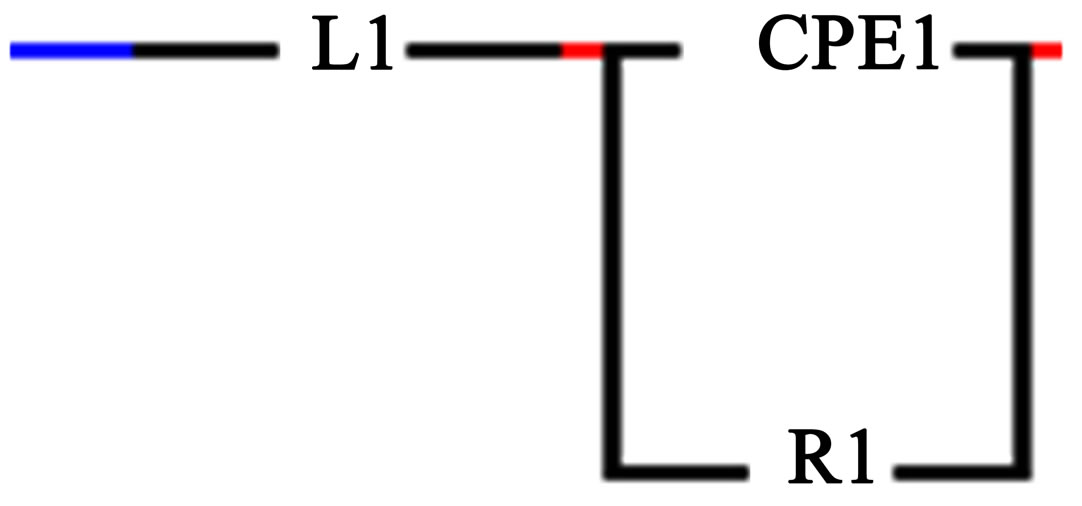 (b)
(b)
Figure 7. Frequency spectra of impedance HHP-compact (500 MPa) of the powder ZrO2 + 3 mol% Y2O3, 400˚C, 2 h, obtained from the nitrate precursor (a) directly 1 and after 96 h after compaction 2 and its equivalent circuit (b).
for nanopowder technologies in connection with the opening up prospects for the controlled synthesis of nanostructures of various dimensions with preset properties. The special hopes are set on low-energy information fields affecting the nonequilibrium from thermodynamic point of view structural elements of nanopowder dispersion systems [32] (high-power conditions, in particular ultra-high pressure (up to 10 GPa) are not effective for the consolidation of nanopowder dispersed systems).
These include weak PMF; the mechanism by which they affect the diamagnetic materials has not been so unequivocally identified because of the lack of experimental data.
3.5. Effects of PMF Exposure to CNDS
In fact, it is virtually impossible to record directly the effects of PMF on the defect subsystem of oxide nanoparticles using the known modern methods. As a rule, we find PMF aftereffects as magneto-plasticity [33,34], changing the characteristics of the electroluminescence luminophores [35], chemical reactivity of semiconductor surfaces [36,37], etc. that appear when you change the pressure or thermal thermodynamic variables.
Significant differences in the nature of impedance spectra Figure 8 indicate the possibility of detecting with EIS the mass transfer processes and structural changes induced in the diamagnetic nanopowder system by weak electromagnetic fields, in particular, PMF. Moreover, the effect can be detected even from the effects of a single pulse (Figure 9).
Dependences of impedance spectra, in particular, the decrease in the frequency-independent plateau (12 kHz - 15 kHz) (Figure 8), corresponding to bulk continuous test current conduction [38], show an increase in concen-
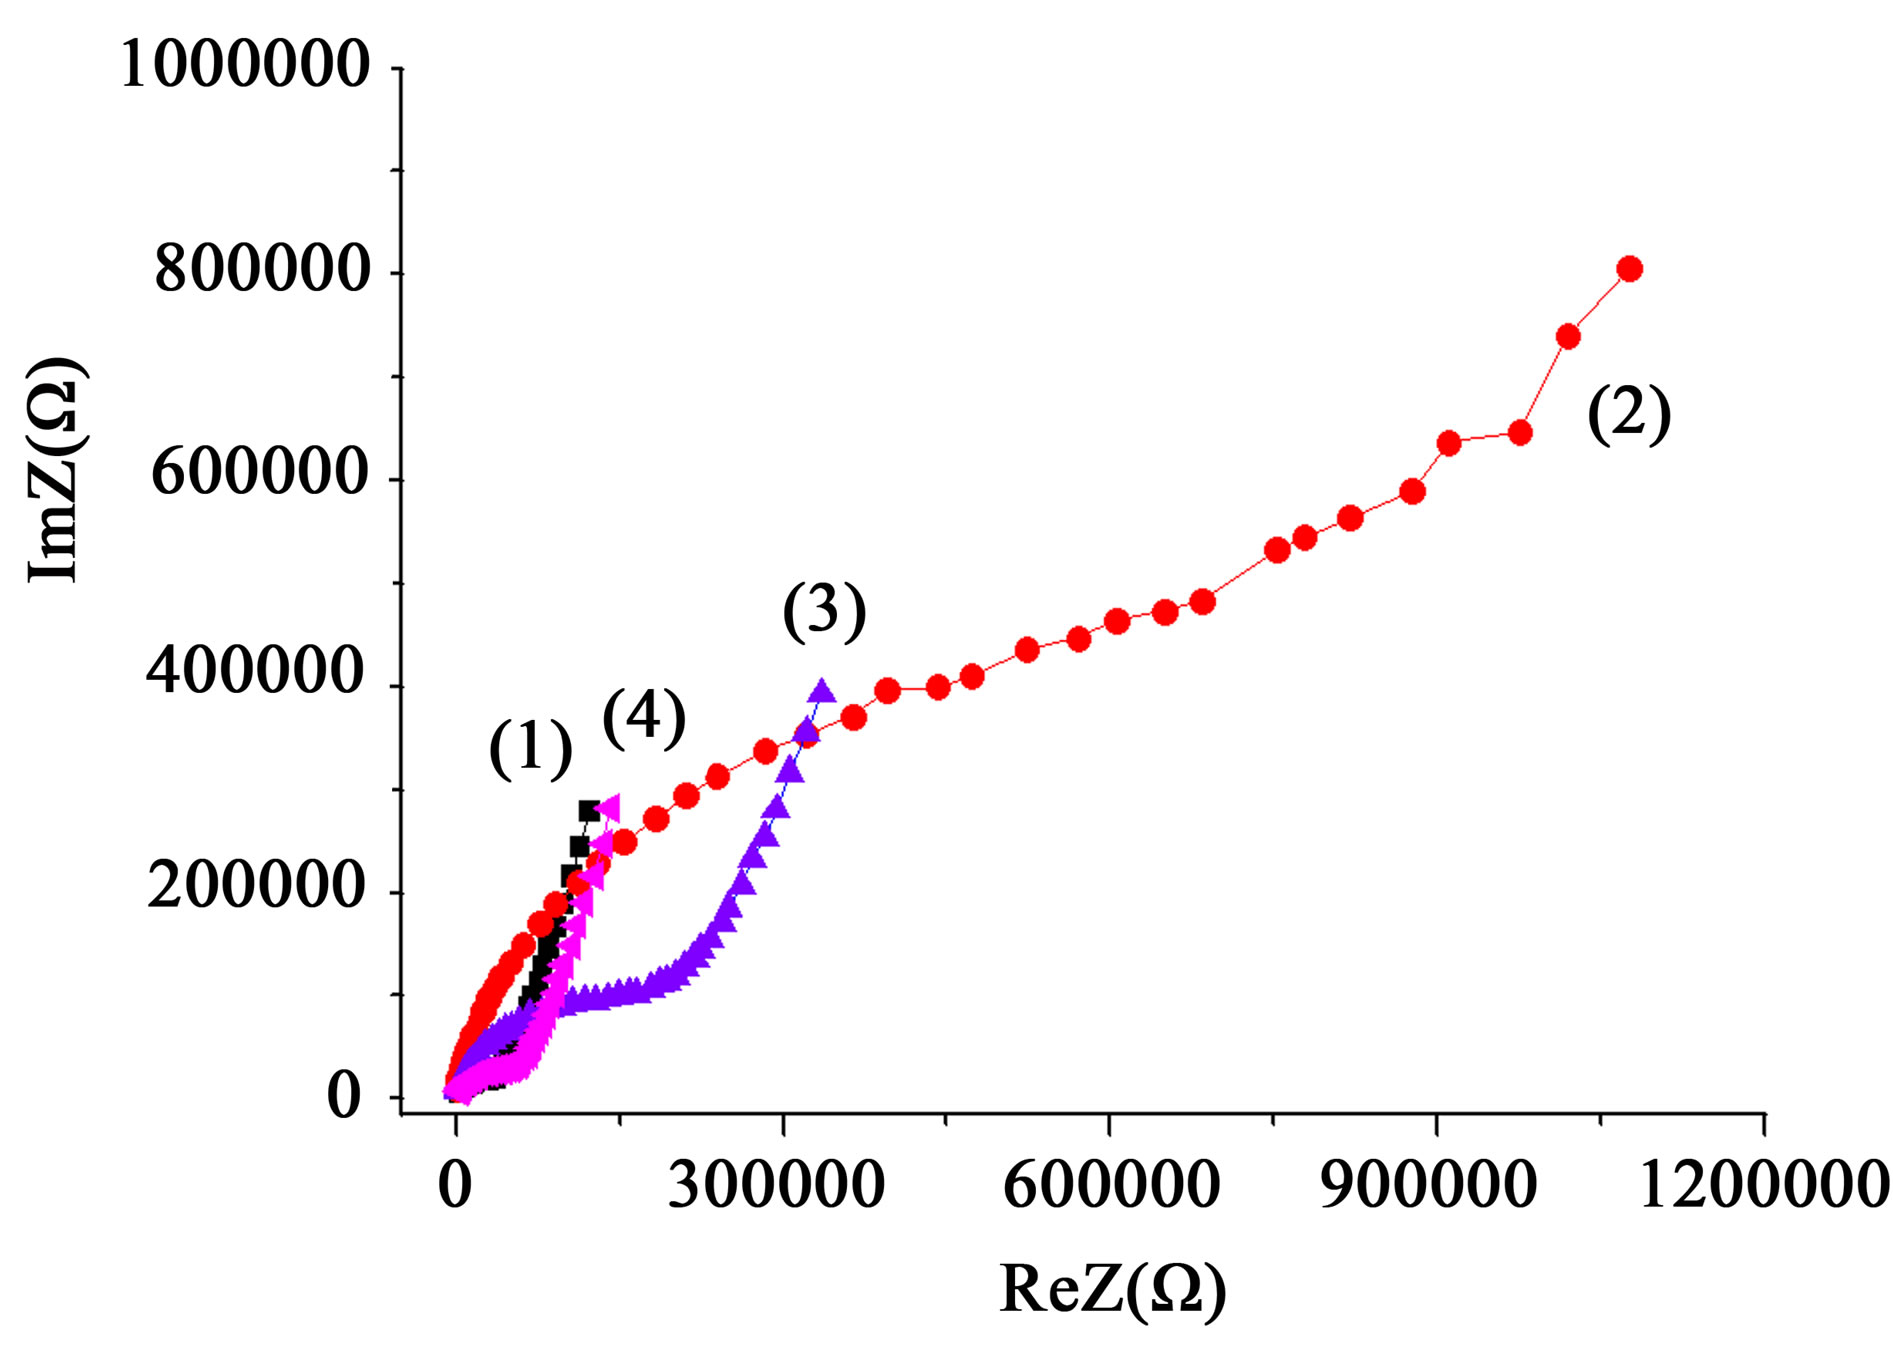
Figure 8. Frequency spectra of impedance HHP-compact (500 MPa) of powder ZrO2 + 3 mol% Y2O3, 400˚C, 2 h, obtained from the chloride precursor before (1) and at different intervals (3): after 1 hour, (4): after 3 hours, after treatment with PMF (2) a series of pulses at a frequency of 1 Hz, 1 h.
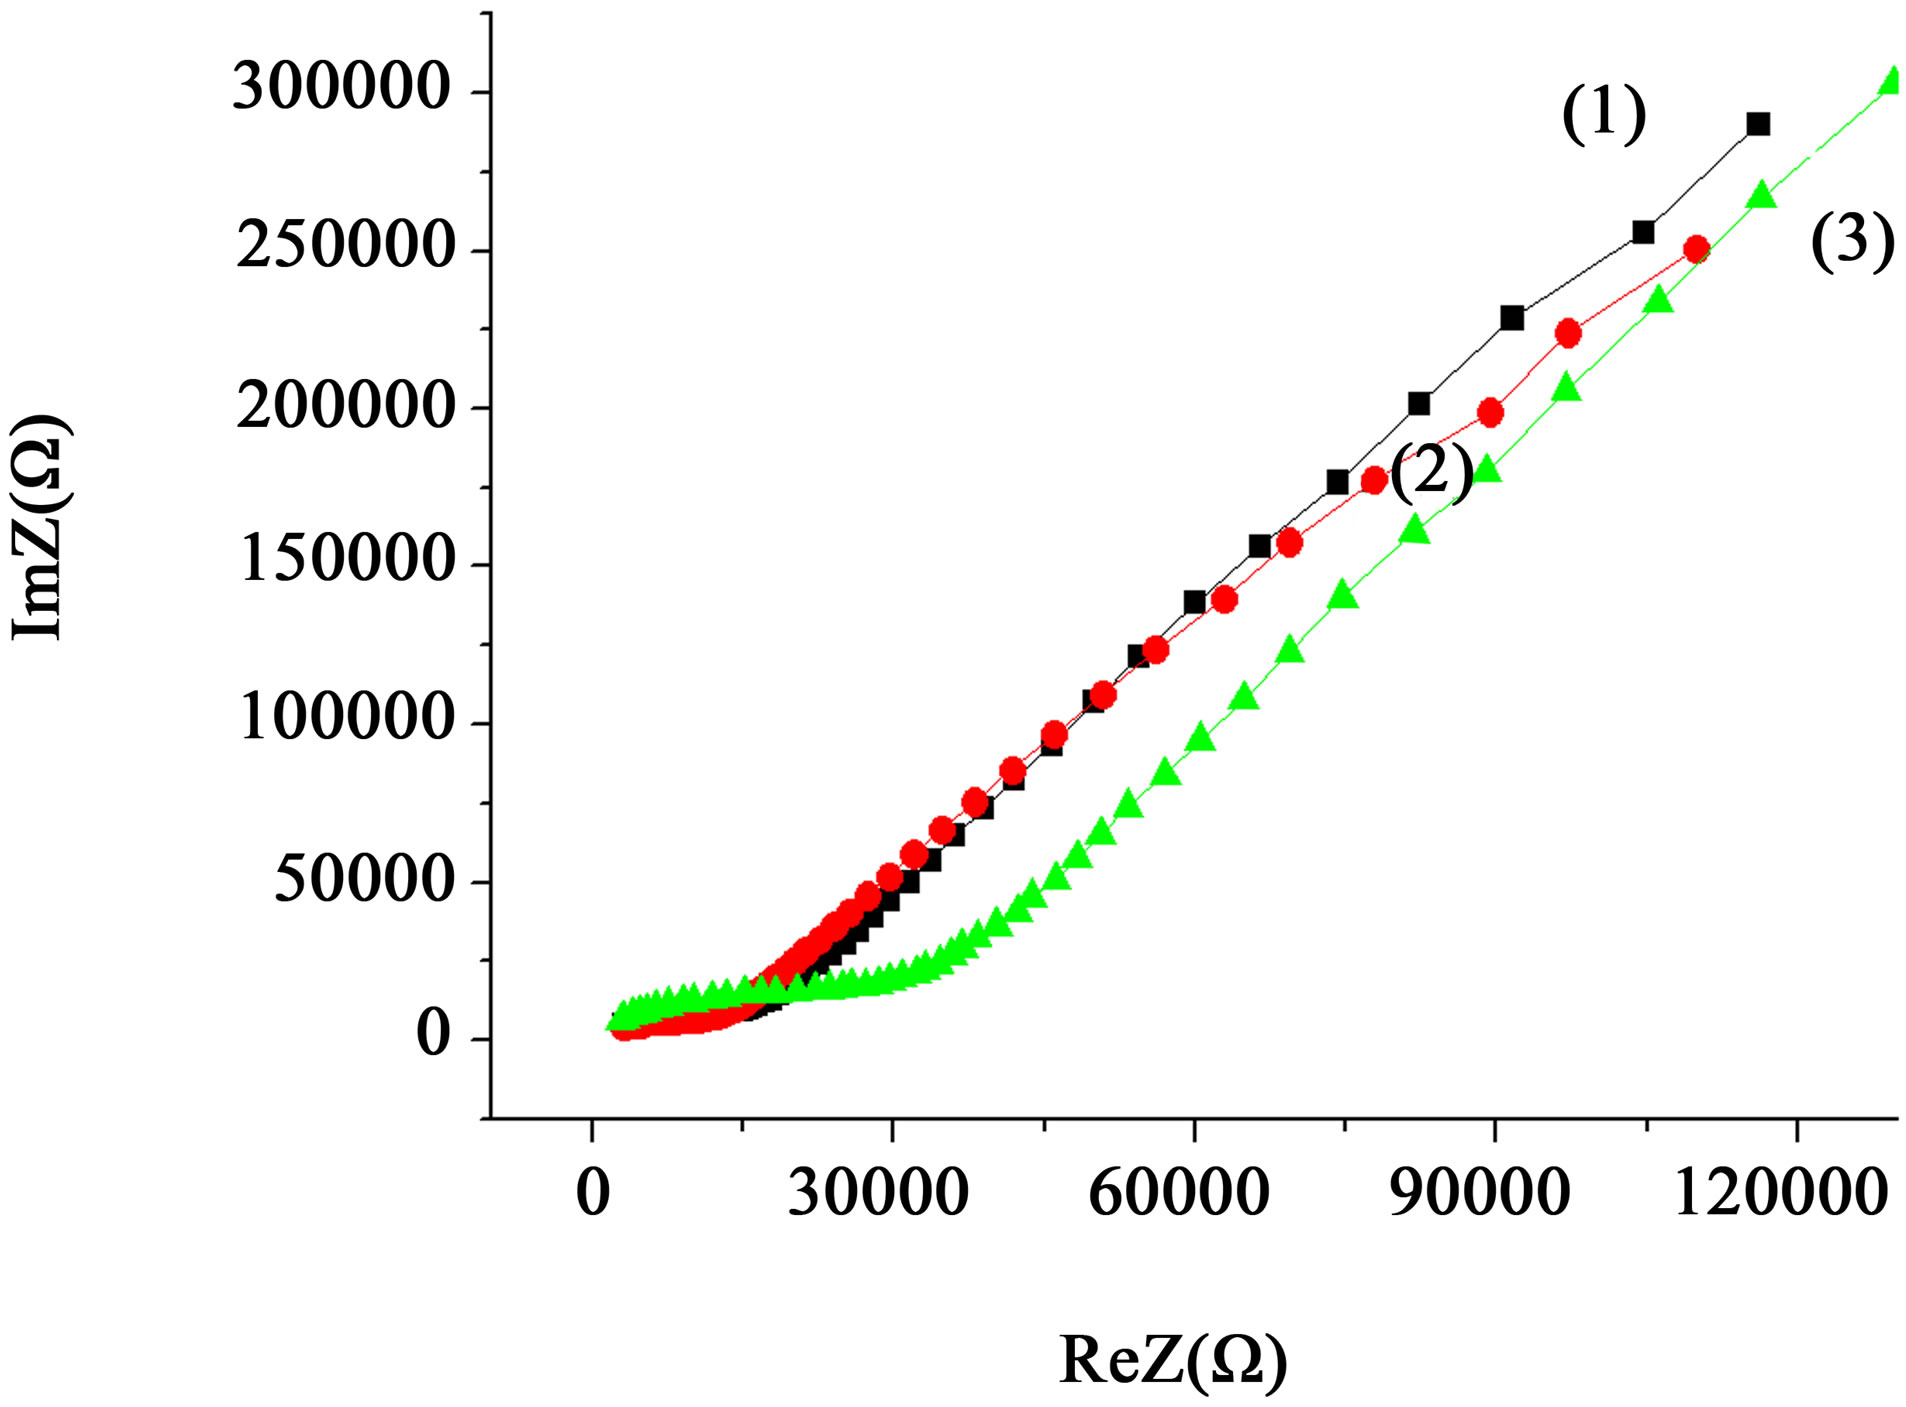
Figure 9. Frequency spectra of impedance HHP-compact (500 MPa) of powder ZrO2 + 3 mol% Y2O3, 400˚C, 2 h, obtained from the chloride precursor before (1) and after treatment PMF with single pulse (2) and 4 minutes (3).
tration of free carriers in the volume of the nanoparticles after PMF application.
4. Conclusions
1) A method of controlling the electrochemical properties and processes realized at heterophase transitions in superionic nanopowder concentrated electrolytes based on solid solution ZrO2+3 mol% Y2O3 under the influence of week external factors has been developed.
2) The effect of weak pulsed magnetic field influence on the structure of the nanopowder dispersed systems has been established experimentally. Structural changes at the level of sub surface defects initiated by PMF have been revealed.
3) The influence of chemical prehistory of zirconia nanopowders on their electrochemical and transport properties has been detected.
5. Acknowledgements
The group of authors is grateful to O. A. Matuzenko from Donetsk University for providing the samples for research and Dr. B. I. Perekrestov from Donetsk Institute of Physics and Engineering for advice and valuable comments on the article.
REFERENCES
- B. A. Boukamp, “Electrochemical Impedance Spectroscopy in Solid State Ionics: Recent Advances,” Solid State Ionics, Vol. 169, No. 1-4, 2004, pp. 65-73. doi:10.1016/j.ssi.2003.07.002
- K. Darowicki and P. Lepski, “Dynamic Electrochemical Impedance Spectroscopy of the First Order Electrode Reaction”, Journal of Electroanalytical Chemistry, Vol. 547, No. 1, 2003, pp. 1-8.
- P. Dhak, D. Dhak, M. Das, K. Pramanik and P. Pramanik, “Impedance Spectroscopy Study of LaMnO3 Modified BaTiO3 Ceramics,” Materials Science and Engineering: B, Vol. 164, No. 3, 2009, pp. 165-171. doi:10.1016/j.mseb.2009.09.011
- M. E. Orazem and B. Tribollet, “An Integrated Approach to Electrochemical Impedance Spectroscopy,” Electrochimica Acta, Vol. 53, No. 25, 2008, pp. 7360-7366.
- D. Vladikova, Z. Stoynov and M. Viviani, “Application of the Differential Impedance Analysis for Investigation of Electroceramics,” Journal of the European Ceramic Society, Vol. 24, No. 6, 2004, pp. 1121-1127. doi:10.1016/S0955-2219(03)00585-5
- N.-Y. Hsua, S.-C. Yena, K.-T. Jengb and C.-C. Chienb, “Impedance Studies and Modeling of Direct Methanol Fuel Cell Anode with Interface and Porous Structure Perspectives,” Journal of Power Sources, Vol. 161, No. 1, 2006, pp. 232-239. doi:10.1016/j.jpowsour.2006.03.076
- W. W. Yang, T. S. Zhao and C. Xu, “Three-Dimensional Two-Phase Mass Transport Model for Direct Methanol Fuel Cells,” Electrochimica Acta, Vol. 53, No. 2, 2007, pp. 853-862. doi:10.1016/j.electacta.2007.07.070
- W. W. Yang and T. S. Zhao, “Two-Phase, Mass-Transport Model for Direct Methanol Fuel Cells with Effect of Non-Equilibrium Evaporation and Condensation,” Journal of Power Sources, Vol. 174, No. 1, 2007, pp. 136-147. doi:10.1016/j.jpowsour.2007.08.075
- D. A. Dean, T. Ramanathan, D. Machado and R. Sundararajan, “Electrical Impedance Spectroscopy Study of Biological Tissues,” Journal of Electrostatics, Vol. 66, No. 3-4, 2008, pp. 165-177.
- C. Ribaut, K. Reybier, B. Torbiero, J. Launay, A. Valentin, O. Reynes, P.-L. Fabre and F. Nepveu, “Strategy of Red Blood Cells Immobilisation onto a Gold Electrode: Characterization by Electrochemical Impedance Spectroscopy and Quartz Crystal Microbalance,” Ingenierie et Recherche Biomedicale/BioMedical Engineering and Research, Vol. 29, No. 2-3, 2008, pp. 141-148.
- U. G. Kyle, I. Bosaeus, A. D. De Lorenzo, P. Deurenberg, M. Elia, J. M. Gómez, B. L. Heitmann, L. Kent-Smith, J.-C. Melchior, M. Pirlich, H. Scharfetter, A. M. W. J Schols, C. Pichard and Composition of the ESPEN Working Group Bioelectrical, “Impedance Analysis—Part I: Review of Principles and Methods,” Clinical Nutrition, Vol. 23, No. 5, 2004, pp. 1226-1243. doi:10.1016/j.clnu.2004.06.004
- U. G. Kyle, I. Bosaeus, A. D. De Lorenzo, P. Deurenberg, M. Elia, J. M. Gómez, B. L. Heitmann, L. Kent-Smith, J.-C. Melchior, M. Pirlich, H. Scharfetter, A. M. W. J Schols and C. Pichard, “Bioelectrical Impedance Analysis—Part II: Utilization in Clinical Practice,” Clinical Nutrition, Vol. 23, No. 6, 2004, pp. 1430-1453. doi:10.1016/j.clnu.2004.09.012
- W. K. Chang, W. C. Wimley, P. C. Searson, K. Hristova and M. Merzlyakov, “Characterization of Antimicrobial Peptide Activity by Electrochemical Impedance Spectroscopy,” Biochimica et Biophysica Acta (BBA)—Biomembranes, Vol. 1778, No. 10, 2008, pp. 2430-2436. doi:10.1016/j.bbamem.2008.06.016
- E. Barsoukov and J. R. Macdonald, “Impedance Spectroscopy; Theory, Experiment and Application,” Willey, New York, 2005.
- V. V. Tokiy, B. I. Perekhrestov, E. V. Kuzmin, I. A. Danilenko, T. E. Konstantinova and N. V. Tokiy, “Impedance Spectroscopy Based Ceramics Nanopowders ZrO2+3 mol. Y2O3 Compacted by Hydrostatic Pressure,” Physics and Technology of High Pressure, Vol. 3, No. 16, 2006, pp. 69-74.
- I. N. Serov, V. I. Margolin, V. A. Zhabrev, N. A. Potsar, I. A. Soltovskaya, V. A. Tupik and V. S. Phantikov, “Resonance Phenomena in Nano-Sized Structures,” 2004. http://www.aires.spb.ru
- T. E. Konstantinova, I. A. Danilenko, V. V. Tokiy and V. A. Glazunova, “Getting Nanopowder of Zirconia from Innovation to Innovation,” Science and Innovation, Vol. 1, No. 3, 2005, pp. 76-87.
- Y. Z. Agamalov, D. F. Bobylev and V. Y. Kneller, “Virtual Meters, Analyzers, Impedance Parameters,” Sensors and Systems, No. 5, 2004, pp. 14-18.
- Y. Agamalov, D. Bobyljev and V. Kneller, “PC-Based Instrument for Impedance Measurement,” 6th IMEKO TC-4 International Symposium on Intelligent Instrumentation for Remote and On-Site Measurements Brussels: BEMECO, IBRA-BIRA, Brussels, 1993, pp. 405-412.
- N. A. Drokin, A. V. Fedotova, G. A. Glushchenko and G. N. Churilov, “Impedance Spectroscopy of High-Molecular Polyethylene with Carbon Nanotubes,” Solid State Physics, Vol. 52, No. 3, 2010.
- A. S. Bondarenko and G. A. Ragoisha, EIS Spectrum Analyser, 2008. http://www.abc.chemistry.bsu.by/vi/analyser
- A. Lasia, “Electrochemical Impedance Spectroscopy and Its Applications,” Modern Aspects of Electrochemistry, Vol. 32, 1999, pp. 143-248.
- Z. B. Stoynov, B. M. Counts, B. Savova-Stoynova and V. V. Elkin, “Electrochemical Impedance,” Nauka, Moscow, 1991.
- S. V. Gnedenkov, S. L. Sinebrukhov and V. I. Sergienko, “Electrochemical Impedance Modeling of the Phase Boundary Metal Oxide Heterostructure/Electrolyte,” Electrochemistry, Vol. 42, No. 3, 2006, pp. 235-250.
- J. R. Macdonald, “Analysis of Dispersed, ConductingSystem Frequency-Response Data,” Journal of Non-Crystalline Solids, Vol. 197, No. 2-3, 1996, pp. 83-110.
- N. G. Bukun, E. A. Ukshe and A. E. Ukshe, “Frequency Analysis and Determination of the Impedance Elements,” Electrochemistry, Vol. 29. No. 1, 1993, p. 110.
- I. F. Efremov, “Periodic Colloidal Structures,” Chemistry, Leningrad, 1971.
- N. D. Uriev, “The Structured Disperse Systems,” Sorosovsk’s Educational Journal, No. 6, 1998, pp. 42-47.
- A. S. Doroshkevich, I. A. Danilenko, I. A. Yaschishin, T. E. Konstantinova, G. K. Volkova and V. A. Glazunova, “The Role of Surface Oxygen in the Processes of Structure Formation of Disperse Systems Nanopowder Base Zirconium Dioxide,” Nanosystems, Nanomaterials, Nanotechnologies, Vol. 7, No. 3, 2009, pp. 893-899.
- M. E. Compan, V. P. Kuznetsov and V. G. Malyshkin, “Nonlinear Impedance of Solid-State Capacitors, Energonakopitelnyh Ionistorov,” Technical Physics, Vol. 80, No. 5, 2010.
- O. L. Kheifets, N. V. Melnikova, A. J. Mollaev, L. A. Saypulaeva, S. N. Callan, R. M. Ferzaliev, A. G. Alibekov and A. N. Babushkin, “Effect of High Pressure on the Electrical Properties Ferroelectrics Agpbsbse3, Cusnasse3, Cusnsbse3, Agsnsbse3 and Cusnsbs3,” Physics and Technology of High Pressure, Vol. 19, No. 4, 2009.
- I. N. Serov, V. I. Margolin, V. A. Zhabrev, N. A. Potsar, I. A. Soltovskaya, V. A. Tupik and V. S. Phantikov, “Resonance Phenomena in Nanoscale Structures,” Engineering Physics, No. 1, 2004, p. 18.
- Y. I. Golovin, R. B. Morgunov, V. E. Ivanov and A. A. Demetrius, “The Effects of Weakening of Ionic Crystals, Due to Changes in the Spin States of Structural Defects in Magnetic Resonance,” JETP, Vol. 117, No. 6, 2000, pp. 1080-1093.
- Y. I. Golovin and R. B. Morgunov, “The Influence of a Weak Magnetic Field on the State of Structural Defects and the Plasticity of Ionic Crystals,” JETP, Vol. 115, No. 2, 1999, pp. 605-623.
- Y. I. Golovin, R. B. Morgunov, A. A. Baskakov and S. Z. Shmurak, “Effect of Magnetic Field on the Electroluminescence Intensity of Single Crystals of ZnS,” Physics of the Solid State, Vol. 41, No. 11, 1999, pp. 1944-1947.
- M. N. Levin and B. A. Zon, “The Impact of Pulsed Magnetic Fields on the Crystals Cs-Si,” JETP, Vol. 111, No. 4. 1997, pp. 1373-1397.
- M. N. Levin, V. N. Semenov and Y. V. Meteleva, “The Impact of Pulsed Magnetic Fields in Thin Layers Cd0.5- Zn0.5S,” Technical Physics Letters, Vol. 27, No. 10, 2002, pp. 37-42.
- S. V. Gnedenko and S. L. Sinebrukhov, “Impedance Spectroscopy in the Study of Charge Transfer Processes,” Bulleten of the Far Eastern Branch of the Russian Academy of Sciences, No. 5, 2006, pp. 6-16.