Journal of Diabetes Mellitus
Vol.3 No.1(2013), Article ID:27749,10 pages DOI:10.4236/jdm.2013.31001
Trends in use and costs of prescription medication in patients with type 1 diabetes: 9-year follow-up after kidney transplantation
![]()
1Folkhälsan Institute of Genetics, Folkhälsan Research Center, Helsinki, Finland; *Corresponding Author: per-henrik.groop@helsinki.fi
2Department of Medicine, Division of Nephrology, Helsinki University Central Hospital, Helsinki, Finland
3National Institute for Health and Welfare, Diabetes Prevention Unit, Helsinki, Finland
4The Baker IDI Heart and Diabetes Institute, Melbourne, Australia
Received 4 December 2012; revised 6 January 2013; accepted 15 January 2013
Keywords: Immunosuppressants; Kidney Transplantation; Medication Utilization; Costs; Prescription Medications; Type 1 Diabetes
ABSTRACT
Aims: We estimated long-term trends in prescription medication utilization and costs in patients with type 1 diabetes in two different transplant cohorts (Group 1: transplantation 1986-1999, n = 180; Group 2: transplantation 2000-2008, n = 150). Methods: Data obtained from the Finnish Diabetic Nephropathy Study were linked with the Drug Prescription Register (purchases of medications 1995-2009). Generalized linear mixed models under gamma distribution were used to evaluate the medication costs. Results: The total costs of medication decreased (Group 1 from EUR11,290 to EUR8760; Group 2 from EUR12,800 to EUR9790) during the follow-up (P < 0.0001). The same trend was observed for immunosuppressive drug costs (P < 0.0001). Although the cost profiles were similar for the groups (P = 0.9), the cost level in Group 2 was higher than in Group 1 (P < 0.0001). In Group 1 the most common immunosuppressive combination was cyclosporine, azathioprine and corticosteroid, while cyclosporine, mycophenolate mofetil (MMF) with/without corticosteroid was the most common in Group 2. The estimated average costs of cyclosporine in combination with MMF were 84% (EUR4130) higher than with azathioprine. Conclusions: Since diabetes or other drugs had only marginal impact on the total costs, the decreasing trend was mainly due to the costs of immunosuppressants. This finding is consistent with the recent guidelines which recommend reducing doses of immunosuppressants over time to minimize sideeffects. The cost levels differed depending on the combinations of immunosuppressive drugs in use. Those who had MMF in the regimen generated higher costs.
1. INTRODUCTION
Diabetic nephropathy (DN) is the leading cause of end-stage renal disease (ESRD) requiring dialysis or kidney transplantation [1]. The incidence of cardiovascular events and mortality is considerably higher in these patients and the risk further increases after they enter dialysis [2]. These patients are also likely to display co-morbidities, requiring multiple pharmacological therapies. Our previous study showed that ESRD multiplies prescription medication costs in patients with type 1 diabetes [3]. Compared to dialysis, kidney transplantation provides a better alternative: it prolongs survival, improves quality of life and offers cost-effective treatment for ESRD [2,4,5].
Before 1996, the immunosuppressants available were cyclosporine, prednisone and azathioprine. Since then, also several other immunosuppressants, such as tacrolimus and mycophenolate mofetil (MMF), have entered the field of organ transplantation. Immunosuppressants, however, have undesirable effects: the long-term use of corticosteroids may increase hypertension and hypercholesterolaemia. Notably, calcineurin inhibitors (CNIs) have proved to be nephrotoxic and they further increased the already high risk of cardiovascular events among patients with diabetes [6]. Moreover, insulin requirements may increase due to impaired insulin secretion and increased insulin resistance associated with the use of these drugs [2].
Therefore, during the previous decade new strategies were adopted to minimize the undesirable effects of immunosuppressants as well as to reduce the risk of infection, malignancy, chronic allograft dysfunction, and cardiovascular events. For example, minimizing CNI doses by combining CNI with MMF or withdrawal from corticosteroids after transplantation have been recommended [7,8]. Also more efficient drugs to control cardiovascular risk factors, such as statins or ACE inhibitors, have reached the market. It is common that new drugs, including new immunosuppressants, are more expensive than the old ones.
Several studies have evaluated medication use and costs after kidney transplantation. Typically those analysis have considered kidney transplantation or ESRD patients as a single patient cohort, despite the differences in requirements of pharmaceutical treatments between particular patient subgroups [4,9-12]. Moreover, in the era of new pharmacological treatments and guidelines studies on recent trends in medication use and costs among patients with diabetes after kidney transplantation are surprisingly sparse. We therefore estimated long-term trends in prescription medication utilization and costs among patients with type 1 diabetes nine years after kidney transplantation in two different transplant cohorts.
2. METHODS
The present study is part of the nationwide multicenter prospective Finnish Diabetic Nephropathy Study (FinnDiane) with the aim to identify risk factors for diabetic complications. A more detailed description of the study has been reported in previous publications [3,13]. Briefly, all adult patients with type 1 diabetes from more than 70 hospitals and primary health centres across Finland were asked to participate. Type 1 diabetes was defined by age at onset of diabetes <40 years, C-peptide ≤0.3 nmol/l and insulin treatment initiation within 1 year of diagnosis, if C-peptide was not measured. The local ethics committees approved the protocol and the study was conducted in accordance with the Declaration of Helsinki. Written informed consents were obtained from each patient.
A total of 330 patients with type 1 diabetes and cadaveric kidney transplant until 31 December 2008 were identified from the FinnDiane database. Patients were followed for a maximum of nine years after the transplantation or until censoring. Patients are usually hospitalized three to four weeks after transplantation in Finland. Medications dispensed during hospital stays are not recorded in any registers, and therefore the first month was excluded. The follow-up was divided into nine 12 month intervals after the first month post-transplantation. Patients were right-censored if they died, restarted dialysis, reached the end of the ninth year after transplantation or end of follow-up (31 December 2009). Also left-censoring occurred if transplantation year was before 1995. Patients were further divided into two transplant cohorts: Group 1 patients who were transplanted between 1986 and 1999 (n = 180) and Group 2 those transplanted between 2000 and 2008 (n = 150).
Information on purchases of medication was obtained from the Drug Prescription Register (DPR) from 1 January 1995 to 31 December 2009 by linking the FinnDiane data to the DPR. Costs were inflated to year 2009 euro levels by using the Consumer Price Index. Medications were divided into three groups: diabetes drugs (ATCcode: A10); immunosuppressive drugs (ATC-codes: L04, H02AB) and other drugs. Immunosuppressive drugs were further divided into cyclosporine (L04AD01), tacrolimus (L04AD02), azathioprine (L04AX01), mycophenolate mofetil (L04AA06) and glucocorticoids (H02AB).
Data on co-morbidities until 31 December 2009 were obtained by linking the FinnDiane data with the Hospital Discharge Register (HDR), with the Drug Reimbursement Register (DRR) and with the DPR. The criterion for the diagnosis of co-morbidity was a consistent diagnosis of co-morbidity across data sources. Moreover, to calculate hospital days for each patient after transplantation, we linked the data with the HDR (see Supplementary Material Appendix 1 for more details of registers, ICD-, reimbursement-, and ATC-codes).
Statistical Analysis
The data are expressed as means ± SD for normally distributed variables, as medians with interquartile range for non-normally distributed values, and as percentages. Differences between groups were analyzed with ANOVA or Kruskal-Wallis test, as appropriate. Categorical variables were analyzed with the χ2 test. Generalized linear mixed models (GLMMs) under gamma distribution and log link [14] were used to evaluate the drug costs during the 9-year period after transplantation. The GLMM framework is appropriate for repeated measures in order to analyze correlated data under non-normal distribution assumptions. It also allows to group drug costs into discrete time intervals and accounts for different follow-up time of each patient during the study period. The costs were adjusted for age at kidney transplantation, sex, transplantation year, mortality (alive in 31 December 2009), hospital days after transplantation and re-enter to dialysis as well as co-morbidities [asthma and chronic obstructive pulmonary disease (COPD), cancer, mental disorders, neurological diseases (epilepsy, multiple sclerosis and Parkinson’s disease), cardiovascular disease (ischemic heart disease and stroke) and rheumatoid arthritis], as applicable. All analyses were performed using SAS 9.2 version (SAS Institute Inc., Cary, NC, USA). A P-value of <0.05 was considered statistically significant.
3. RESULTS
Table 1 depicts the number of patients at each follow-up year. Characteristics of the patients stratified according to transplantation groups are presented in Table 2. Patients who had been transplanted before 2000 were younger at the time of transplantation, had higher mortality and more hospital days. They were also more likely to re-enter dialysis after transplantation, probably due to longer mean follow-up time.
3.1. Costs of Medication
The total annual costs per patient decreased in both
Table 1. Number of patients at each follow-up year after the kidney transplantation.
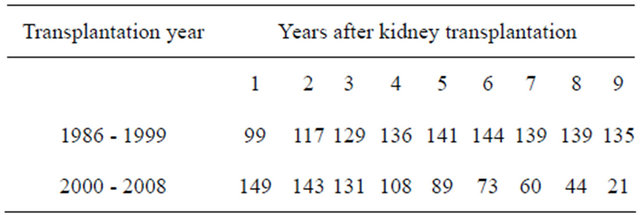
Table 2. Characteristics of patients according to the transplant cohorts.
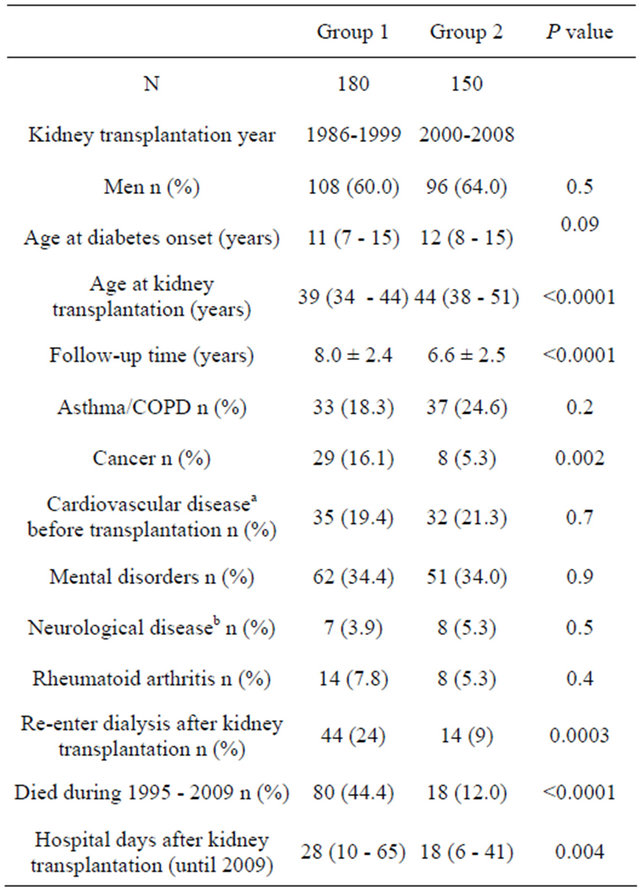
Data are means ±SD, median (interquartile range) or %; aCardiovascular disease denotes ischemic heart disease and stroke; bNeurologic disease denotes epilepsy, multiple sclerosis and Parkinson’s disease.
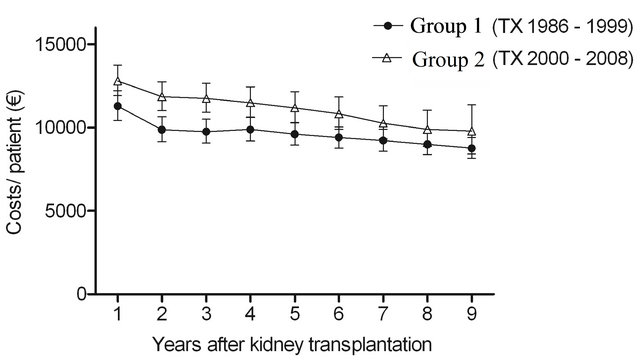
cohorts (P < 0.0001) during follow-up (Figure 1(a)). In Group 1 the estimated annual costs per patient in the first, second and ninth year after transplantation were EUR11,290 (95% CI 10,420 - 12,220), EUR9880 (95% CI 9160 - 10,650) and EUR8760 (95% CI 8160 - 9410). In Group 2 the corresponding figures were EUR12,800 (95% CI 11,910 - 13,760), EUR11,860 (95% CI 11,030 - 12,760) and EUR9790 (95% CI 8430 - 11,360). The average decrease in Group 1 between the first and the second year was 12.9%, while it was 1.8% by every 12 months thereafter, and was 7.5% and 2.8% in Group 2, respectively. Although the cost profiles were not different between the two groups (P = 0.9 for time and group interaction), the cost level was higher in Group 2 than in Group 1 (P < 0.0001).
The cost of diabetes drugs decreased considerably at the beginning of the follow-up, but leveled off thereafter. The interaction between the groups and time was significant (P = 0.02), indicating slightly different cost profiles between the groups: in Group 1 the costs decreased between the first and the second year by 15.4% and between the second and the third year by 10.9%, but were constant thereafter. In Group 2 the costs decreased by 14.4% between the first and the second year, were constant during the next three years and decreased annually by 6.2% each year thereafter (Figure 1(b)). However, no significant differences were observed in cost levels between these groups (P = 0.3).
The cost of immunosuppressive drugs decreased over time: in Group 1 from EUR7830 (95% CI 7270 - 8420) to EUR5250 (95% CI 4930 - 5590) and in Group 2 from EUR8390 (95% CI 7890 - 8930) to EUR5500 (95% CI 4670 - 6470). As seen in Figure 1(c), the decrease was the greatest between the first and the second year. The average decrease in Group 1 between the first and the second year was 16.8%, while it was 3.2% by every 12 months thereafter. In Group 2 the numbers were 6.4% and 4.8%, respectively. No significant differences were observed in costs profiles between the groups (P = 0.3 for time and group interaction). Cost levels were again higher in Group 2 than in Group 1 (P < 0.0001). However, the gap narrowed towards the end of the follow-up.
No significant differences were observed in other medication costs (P = 0.09), but the cost levels were different (P < 0.0001) between the groups (Figure 1(d)). Interaction between group and time was not significant (P = 0.3) exhibiting the similarity of the cost profiles between the groups.
3.2. Immunosuppressive Regimen
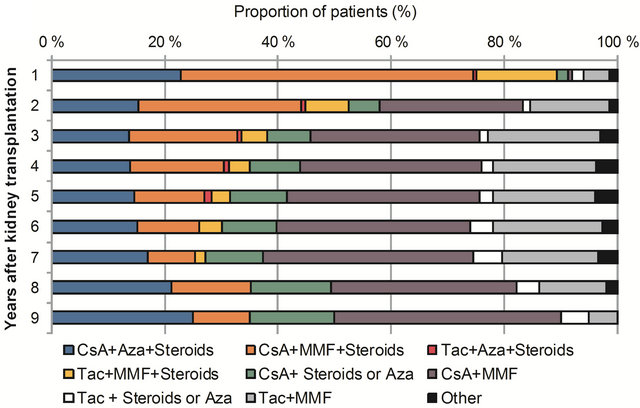
Figures 2(a) and (b) illustrate the proportions of different immunosuppressive regimens by the transplant cohorts during the follow-up. In Group 1 the most common immunosuppressive regimen was cyclosporine, azathioprine and corticosteroid combination during fol-
 (a)
(a)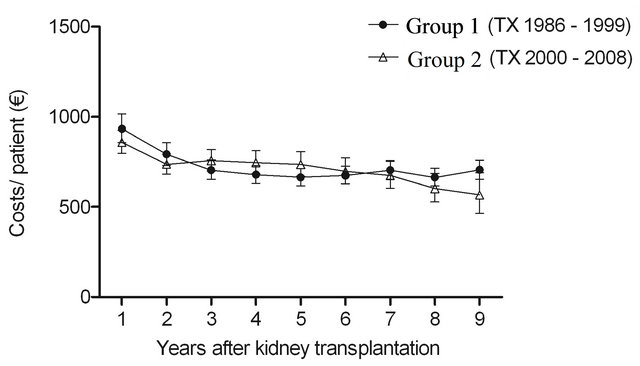 (b)
(b)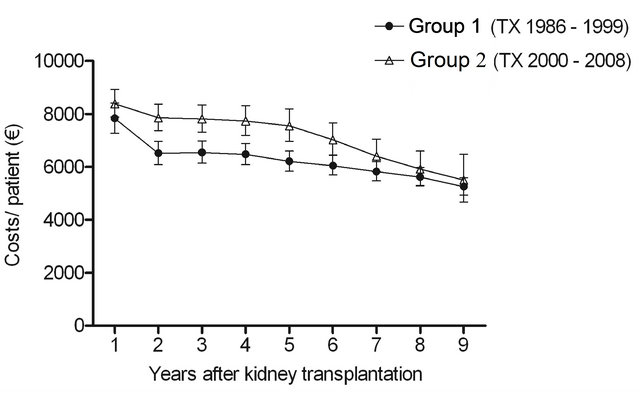 (c)
(c)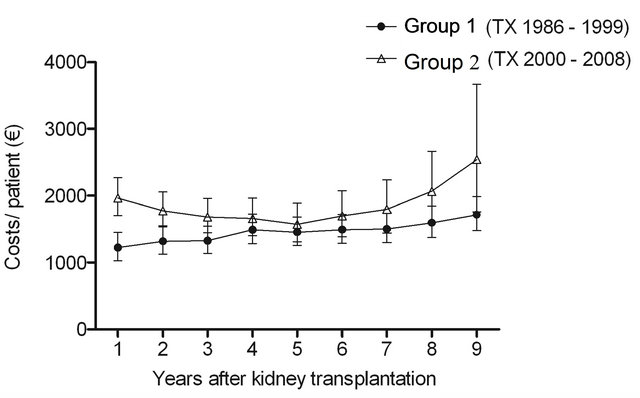 (d)
(d)
Figure 1. The estimated cost trends (least square means with 95% CI, gamma GLMM) of (a) all prescription medicationa (b) diabetes drugsb (c) immunosuppressive drugsc and (d) other remaining drugsd; in patients with type 1 diabetes nine years after kidney transplantation in two different transplant cohorts. The costs were adjusted for age at kidney transplantation, sex, transplantation year and hospital days after transplantation. aIn addition, adjusted for mortality (alive in 31 December 2009), re-enter to dialysis and co-morbidities; bIn addition, adjusted for mortality (alive in 31 December 2009) and re-enter to dialysis; cIn addition, adjusted for mortality (alive 31 December in 2009); dIn addition, adjusted for re-enter to dialysis. The time effect (trends) (a) P < 0.0001; (b) P < 0.0001; (c) P < 0.0001; (d) P = 0.09. The difference in cost levels between the groups: (a) P < 0.0001; (b) P = 0.3; (c) P < 0.0001; (d) P < 0.0001. The interaction between group and time (a) P = 0.9; (b) P = 0.02; (c) P = 0.3; (d) P = 0.3.
low-up, while cyclosporine, MMF and corticosteroid was the most common combination in Group 2 during the first year after transplantation. The use of steroids decreased considerably in Group 2 during follow-up and the combination of cyclosporine and MMF became more common. In both cohorts almost all patients had purchased steroids during the first year after the transplantation. In Group 1 the proportion was higher also thereafter: more than 80% of the patients used steroids during the following years, while in Group 2 the proportion was approximately 40%. In Group 2 approximately onequarter of the patients had purchased tacrolimus during the first seven years. However, in years eight and nine the share dropped to 16% and 10%, respectively. In contrast, the proportion was less than 10% in Group 1. MMF was more common among the patients who had been transplanted between 2000 and 2008: the proportion of patients who had purchased MMF varied between 50% and 75%, while in Group 1 the share was between 13% and 21%. Azathioprine was more common in Group 1 (proportions varied between 62% and 78%) than in Group 2 (proportions varied between 19% and 40%).
Additional analyses were performed to find out the average costs of the most common combinations of immunosuppressive drugs (costs of steroids not included). The estimated average costs of different combinations were as follows: cyclosporine and azathioprine EUR4900 (95% CI 4760 - 5040), cyclosporine and MMF EUR9030 (95% CI 8770 - 9300) as well as tacrolimus and MMF EUR8860 (95% CI 8470 - 9260). Costs were significantly higher in those who had MMF in the regimen compared to those who had azathioprine (P < 0.0001). No significant differences were observed between cyclosporine and tacrolimus groups with MMF (P = 0.4).
4. DISCUSSION
This study shows the long-term trends of drug utilization and costs in patients with pre-existing type 1 diabetes by following two different patient cohorts for a maximum of nine years after transplantation. We demonstrated how immunosuppressive regimens clearly have changed over time. Overall, the study shows decreasing trends in the total costs of prescription medication during
 (a)
(a)
 (b)
(b)
Figure 2. Proportions of different immunosuppressive regimens in patients with type 1 diabetes nine years after transplantation in two different transplant cohorts: (a) Group 1 (transplantation 1986 - 1999) and (b) Group 2 (transplantation 2000 - 2008) CsA = cyclosporine, Aza = azathioprine, MMF = mycophenolate mofetil, Tac = tacrolimus.
the 9-year follow-up post-transplantation. The decrease was the steepest between the first and second year, but slowed down thereafter. The same figures were observed for immunosuppressive drug costs, but the drop was even steeper in those who were transplanted before 2000. However, their costs were lower, even though the gap narrowed towards the end of the follow-up between the groups. Although diabetes drug costs decreased at the beginning of the follow-up in both groups and in Group 2 also until the end of the follow-up, their effect on the total costs was marginal. Since no substantial differences were observed in the costs of diabetes or other drugs, the decrease was mainly due to the costs of immunosuppressants.
The most probable reason for this observation is that minimization of immunosuppression without jeopardizing graft function has become an increasingly important focus of the transplant programmes [15-18]. Since the risk of acute rejection is the highest in the first three months after transplantation (initial therapy), higher doses of immunosuppressants and combination of drugs with different mechanism of action are used to achieve efficacy with limited toxicity [7,8,19]. Typically, the maintenance therapy consists of the same drugs at reduced doses as the initial therapy, because the transplanted kidneys become immunologically more stable over time [7]. Thus, our findings are in accordance with the clinical practice guidelines which recommend reducing doses of immunosuppressants over time to minimize side-effects.
The study exhibits higher drug costs in those who were transplanted after the millennium than in those who received transplant before. The most obvious reason for this finding is the difference in immunosuppressive regimens. From 1986 cyclosporine combined with azathioprine and glucocorticoid was adopted as a standard regimen in Finland [20]. This triple therapy was the most prevalent regimen during the whole follow-up in those who were transplanted before 2000.
Studies conducted in the 1990s showed that MMF was associated with less acute rejections than azathioprine [21]. Consequently, MMF was rapidly adopted in kidney transplant immunosuppressant protocols globally [11,22, 23]. Similarly in Finland, MMF replacing azathioprine was adopted as a part of the standard regimen in 2002 [20]. To reduce nephrotoxicity, minimization of cyclosporine doses was achieved by combining cyclosporine with MMF [24]. The routine use of MMF in low immunological risk patients was not recommended by the National Institute for Clinical Excellence (NICE) [7]. However, in many centers, azathioprine has almost been abandoned in favor of MMF [16]. Also our data make it evident that azathioprine was commonly replaced with MMF, since cyclosporine with MMF became the most frequently used combination in the later transplant cohort.
Previous studies have suggested that a newer CNI, tacrolimus may be more effective in preventing acute rejections than cyclosporine [25]. Thus, a clear transition from cyclosporine to tacrolimus after kidney transplantation has been seen in recent years [7,10,23]. Although there is evidence that tacrolimus has a better cardiovascular profile than cyclosporine in terms of blood pressure and lipids, it is associated with an increased risk of glucose metabolism disorders, resulting in destructive effects on insulin secretion and insulin sensitivity [6,16,26]. Therefore, based on the NICE guidelines the choice of tacrolimus or cyclosporine should be based on their side-effect profiles for individual people [7]. In contrast to other countries [23], cyclosporine seems to be the cornerstone of the immunosuppressive maintenance therapy in Finland and tacrolimus was considered to be an alternative to cyclosporine for high-risk patients (for example recipients with previous kidney transplant, severe or chronic rejection or side-effects of cyclosporine) [27]. Our data show that approximately one-quarter of patients who were transplanted after 2002 had tacrolimus in the regimen.
Corticosteroids have traditionally been the mainstay of immunosuppression to prevent acute rejection and deterioration of graft function. However, long-term use of steroids is associated with undesirable side-effects which have led many transplant centers to withdraw or avoid steroids [15,17,23]. Our results revealed that steroid withdrawal during the first year after transplantation was more prevalent than steroid avoidance among patients who had transplantation after the millennium, while in the earlier cohort more than 80% used steroids throughout the follow-up.
Combinations including the newer immunosuppressants, MMF or tacrolimus, were for obvious reasons more common in those patients, who were transplanted after the millennium. These newer immunosuppressants are more expensive than the old ones. Consequently, our study shows that the estimated average costs of cyclosporine in combination with MMF were 84% (EUR4130) higher than with azathioprine. Despite the cost difference, previous cost-effectiveness studies have shown that the new drugs reduce the risk of acute rejection and have short-term economic advantages [28]. However, there is evidence that long-term use of these drugs may diminish their overall benefits. A recently published analysis found no difference between MMF and azathioprine regarding long-term patient or graft survival [22]. Therefore, new strategies that seek more rational and costeffective ways to use these drugs are required. It is also necessary to evaluate the impact of different drug regimens on patients’ pre-existing diseases. For example, new transplant related risk factors, particularly renal and cardiovascular toxicity, as well as inflammation due to opportunistic infection, increase the already high cardiovascular risk of the patients with diabetes [2,19,26]. Moreover, to ensure long-term success of transplantation, a tailor-made therapy, considering the immune status of the graft and the patient, shall be used [29].
The present study, however, has some limitations that need to be considered. First, although the validity and coverage of the DPR is very high, drugs dispensed during hospital stays are not recorded in any national Register. Moreover, some purchases of outpatient drugs remain outside the registers: nearly all over-the-counter medications or drugs which are dispensed as a part of the clinical trials. The risk of hospitalization is high in patients with ESRD treated by dialysis or kidney transplant [30]. As can be expected, also those who were transplanted earlier had more hospital days and deaths during follow-up. However, to minimize the bias we were able to control these confounders in the multivariate model. Finally, the data regarding purchases of the drugs were available between 1995 and 2009. Consequently, we were not able to follow all patients for nine years after transplantation. Therefore, we divided the costs into 12- month time intervals which allows us to account different follow-up times of each patient in the analysis.
5. CONCLUSIONS
In conclusion, our study highlights a decreasing trend in total prescription medication costs per patient during the 9-year period after transplantation. The trend is mainly due to a decrease in the costs of immunosuppressants. The observation is consistent with the recent guidelines, recommending minimization of undesirable side-effects of immunosuppression without jeopardizing graft function. The cost levels differed between the patients depending on the combinations of immunosuppressive drugs in use. Those who had newer immunosuppressant, MMF, in the regimen, generated higher medication costs.
6. ACKNOWLEDGEMENTS
The authors would like to acknowledge all of the physicians and nurses at each of the FinnDiane centres (Supplementary Material Appendix 2) participating in patient recruitment and characterization. This research was supported by grants from the Folkhälsan Research Foundation, Wilhelm and Else Stockmann Foundation, Liv och Hälsa Foundation and Kidney Foundation.
REFERENCES
- Gross, J.L., de Azevedo, M.J., Silveiro, S.P., Canani, L.H., Caramori, M.L. and Zelmanovitz, T. (2005) Diabetic nephropathy: Diagnosis, prevention, and treatment. Diabetes Care, 28, 164-176. doi:10.2337/diacare.28.1.164
- Luan, F.L. and Samaniego, M. (2010) Transplantation in diabetic kidney failure patients: Modalities, outcomes, and clinical management. Seminars in Dialysis, 23, 198- 205. doi:10.1111/j.1525-139X.2010.00708.x
- Lithovius, R., Harjutsalo, V., Forsblom, C. and Groop, P.H. and FinnDiane Study Group (2011) Cumulative cost of prescription medication in outpatients with type 1 diabetes in Finland. Diabetologia, 54, 496-503. doi:10.1007/s00125-010-1999-y
- Salonen, T., Reina, T., Oksa, H., Sintonen, H. and Pasternack, A. (2003) Cost analysis of renal replacement therapies in Finland. American Journal of Kidney Diseases, 42, 1228-1238. doi:10.1053/j.ajkd.2003.08.024
- Wolfe, R.A., Ashby, V.B., Milford, E.L., et al. (1999) Comparison of mortality in all patients on dialysis, patients on dialysis awaiting transplantation, and recipients of a first cadaveric transplant. New England Journal of Medcine, 341, 1725-1730. doi:10.1056/NEJM199912023412303
- Kho, M., Cransberg, K., Weimar, W. and van Gelder, T. (2011) Current immunosuppressive treatment after kidney transplantation. Expert Opin Pharmacother, 12, 1217- 1231. doi:10.1517/14656566.2011.552428
- National Institute for Clinical Excellence (2005) TA85: Renal transplantation—Immunosuppressive regimens (adults). The clinical effectiveness and cost-effectiveness of immunesuppressive therapy for renal transplantation. Nice, London. www.nice.org.uk/TA85guidance.
- Kidney Disease: Improving Global Outcomes (KDIGO) Transplant Work Group (2009) KDIGO clinical practice guideline for the care of kidney transplant recipients. American Journal of Transplantation, 9, S1-S155. doi:10.1111/j.1600-6143.2009.02834.x
- Jurgensen, J.S., Arns, W. and Hass, B. (2010) Cost-effectiveness of immunosuppressive regimens in renal transplant recipients in Germany: A model approach. The European Journal of Health Economics, 11, 15-25. doi:10.1007/s10198-009-0148-3
- Mao, P.C., Lee, E.K. and Tseng, P.L. (2012) Trends in the use of immunosuppressive agents by outpatients after renal transplantation at a medical center in southern Taiwan. Transplantation Proceedings, 44, 185-189. doi:10.1016/j.transproceed.2011.11.003
- Gentil, M.A., Cantarell, A.C., Gonzalez, R.F.M., Marco, F.J.E., Lopez, De M.M.M. (2004) Impact of the new drugs in the cost of maintenance immunosuppression of renal transplantation. Is it justified? Nephrology Dialysis Transplantation, 19, 77-82. doi:10.1093/ndt/gfh1021
- Joyce, A.T., Iacoviello, J.M., Nag, S., et al. (2004) Endstage renal disease-associated managed care costs among patients with and without diabetes. Diabetes Care, 27, 2829-2835. doi:10.2337/diacare.27.12.2829
- Thorn, L.M., Forsblom, C., Fagerudd, J., et al. (2005) Metabolic syndrome in type 1 diabetes: Association with diabetic nephropathy and glycemic control (the FinnDiane study). Diabetes Care, 28, 2019-2024. doi:10.2337/diacare.28.8.2019
- Littell, R.C. (2006) SAS for mixed models. SAS Institute, Cary.
- Srinivas, T.R. and Meier-Kriesche, H.U. (2008) Minimizing immunosuppression, an alternative approach to reducing side effects: Objectives and interim result. Clinical Journal of the American Society of Nephrology, 3, S101- S116. doi:10.2215/CJN.03510807
- Galliford, J. and Game, D.S. (2009) Modern renal transplantation: Present challenges and future prospects. Postgraduate Medical Journal, 85, 91-101. doi:10.1136/pgmj.2008.070862
- Steiner, R.W. and Awdishu, L. (2011) Steroids in kidney transplant patients. Seminars in Immunopathology, 33, 157-167. doi:10.1007/s00281-011-0259-7
- Denton, M.D., Magee, C.C. and Sayegh, M.H. (1999) Immunosuppressive strategies in transplantation. Lancet, 353, 1083-1091. doi:10.1016/S0140-6736(98)07493-5
- Jardine, A.G., Gaston, R.S., Fellstrom, B.C. and Holdaas, H. (2011) Prevention of cardiovascular disease in adult recipients of kidney transplants. Lancet, 378, 1419-1427. doi:10.1016/S0140-6736(11)61334-2
- Salmela, K.T. and Kyllönen, L.E. (2004) Two decades of experience with cyclosporine in renal transplantation in Helsinki. Transplantation Proceedings, 36, 94S-98S. doi:10.1016/j.transproceed.2004.01.036
- European Mycophenolate Mofetil Cooperative Study Group (1995) Anonymous placebo-controlled study of mycophenolate mofetil combined with cyclosporine and corticosteroids for prevention of acute rejection. Lancet, 345, 1321-1325.
- Clayton, P.A., McDonald, S.P., Chapman, J.R. and Chadban, S.J. (2012) Mycophenolate versus azathioprine for kidney transplantation: A 15-year follow-up of a randomized trial. Transplantation, 94, 152-158. doi:10.1097/TP.0b013e31825475a3
- Meier-Kriesche, H.U., Li, S., Gruessner, R.W., et al. (2006) Immunosuppression: Evolution in practice and trends, 1994-2004. American Journal of Transplantation, 6, 1111- 1131. doi:10.1111/j.1600-6143.2006.01270.x
- Grinyo, J.M. and Cruzado, J.M. (2009) Mycophenolate mofetil and calcineurin-inhibitor reduction: Recent progress. American Journal of Transplantation, 9, 2447- 2452. doi:10.1111/j.1600-6143.2009.02812.x
- Vincenti, F., Jensik, S.C., Filo, R.S., Miller, J. and Pirsch, J. (2002) A long-term comparison of tacrolimus (FK506) and cyclosporine in kidney transplantation: Evidence for improved allograft survival at five years. Transplantation, 73, 775-782. doi:10.1097/00007890-200203150-00021
- Liefeldt, L. and Budde, K. (2010) Risk factors for cardiovascular disease in renal transplant recipients and strategies to minimize risk. Transplant International, 23, 1191- 1204.
- Isoniemi, H. and Jalanko, H. (2004) Selection of organ transplant drugs is increasing. Duodecim, 120, 1371-1378.
- Woodroffe, R., Yao, G.L., Meads, C., et al. (2005) Clinical and cost-effectiveness of newer immunosuppressive regimens in renal transplantation: A systematic review and modelling study. Health Technology Assessment, 9, 1-179.
- Levy, G.A. (2010) Progress in transplantation. Journal of Therapeutic Drug Monitoring, 32, 246-249. doi:10.1097/FTD.0b013e3181dca981
- Daratha, K.B., Short, R.A., Corbett, C.F., et al. (2012) Risks of subsequent hospitalization and death in patients with kidney disease. Clinical Journal of the American Society of Nephrology, 7, 409-416. doi:10.2215/CJN.05070511
APPENDIX 1
The Drug Prescription Register (DPR), maintained by the Social Insurance Institute of Finland since 1994 contains total costs [retail price, which consists of the reasonable wholesale price, coverage for pharmacies and value added tax] of the purchase, as well as the Anatomic Therapeutic Chemical (ATC) classification code of the product, based on the 2010 ATC Index version.
Hospital Discharge Register (HDR), maintained by the National Institute for Health and Welfare, contains all dates of hospital admissions and discharges since 1969, each patient’s unique personal identifier, and up to four diagnoses with the International Classification of Diseases (ICD).
The Drug Reimbursement Register (DRR) maintained by the Social Insurance Institution of Finland since 1964, contains information of entitlements to full (100%) or partial (72%) special reimbursement of drug costs for certain chronic diseases which are classified by reimbursement number codes. Thus, all patients with permanent entitlement are entered into the DRR. Fulfillment of the criteria for eligibility for special reimbursement must be proven by a certificate from a treating physician. The criterion for the diagnosis of co-morbidity was the consistent diagnosis of co-morbidity across the data sources.
The co-morbidities based on the codes from the aforementioned registers were as follows: asthma and chronic obstructive pulmonary disease (COPD) (ICD-codes: 493, 496, 4912, J44 - J46; reimbursement code: 203 ATCcode: R03), cancer (ICD-codes: 140 - 208, C00 - C99; reimbursement codes: 115 - 117, 128, 130, 180, 184,185, 189, 311, 312, 316; ATC-code: L01 excluding L01BA01), cardiovascular diseases (ICDcodes: 410 - 414, 431 - 434, 436 - 438, I20 - I25, I60, I61, I63 - I69), mental disorders (ICD-codes: 295 - 298, F20 - 34; reimbursement codes: 112, 188; ATC-codes: N05A excluding N05AB01 and N05AB04, N06A excluding N06AA09, N06CA01, N06AX16 and N06AX21), neurological disease: Parkinson’s disease, multiple sclerosis, epilepsy (ICD-codes: 345, 340, 332, G40, G35, G20; reimbursement codes: 109 - 111, 303), rheumatoid arthritis (ICDcodes: M02, M05, M06, M08, M13, M45, M46, M79; reimbursement codes: 202, 313).
APPENDIX 2
The Finnish Diabetic Nephropathy Study Centers.
Continued
Continued