Journal of Diabetes Mellitus
Vol. 2 No. 3 (2012) , Article ID: 22163 , 7 pages DOI:10.4236/jdm.2012.23043
Response of low active GLP-1 like substances to test meal in obese Japanese patients with type 2 diabetes mellitus compared with obese controls with normal glucose tolerance*
![]()
1Center of Diabetes and Endocrine & Metabolism Disease, Nagaoka Red Cross Hospital, Nagaoka, Japan; #Corresponding Author: kkam-int@echigo.ne.jp
2Department of Health and Nutrition, University of Niigata Prefecture, Niigata, Japan
3Department of Endocrinology and Metabolism, Niigata University, Niigata, Japan
4Diabetes Center, Niigata Medical Center, Niigata, Japan
5Diabetes Center, Kariwa Gun Hospital, Niigata, Japan
Received 29 April 2012; revised 31 May 2012; accepted 10 June 2012
Keywords: Active GLP-1; Test Meal; BMI; Obesity; Japanese Type 2DM
ABSTRACT
Background: A secretion of plasma active GLP-1 (p-active GLP-1) after ingestion of breakfast test meal (TM) is decreased in obese European patients with type 2 diabetes mellitus (T2DM). However, there was no significant difference in pactive GLP-1 secretion following TM between obese Japanese patients with T2DM and controls. The findings indicate the difference may be due to different races or dietary’s customs of subjects. Aims: We examined whether p-active GLP-1 is truly affected by TM in obese Japanese patients (n = 24, group 1) and obese controls (n = 12, group 2). Methods: Glucose (PG), insulin (s-IRI), C-peptide (s-CPR) and active GLP-1 like substances (p-active GLP-1-S) levels in blood were measured 0, 30 and 60 min after TM. Obese Japanese patients with mean 9 years of diabetes had microand macro-vascular disturbances and were treated with diet, exercise and/or oral drugs for hyperglycemia. Results: There was no significant difference in sex, age or BMI between groups. Means HbA1c and PG were significantly higher in group 1 than in group 2. There were no significant differences in means of basal s-IRI, HOMA-R and s-CPR between groups. However, means of HOMA-β, insulinogenic index, postprandial s-IRI, s-CPR and p-active GLP-1-S or p-active GLP-1-S/PG values after TM were significantly lower in group 1 than in group 2. Conclusions: These results indicate that a response of p-active GLP-1-S after TM in obese Japanese patients with T2DM was decreased and secretion of GLP-1 relative to PG was impaired. The method of enhancing function of active GLP-1 may be useful for treatment in some of patients with diabetes mellitus.
1. INTRODUCTION
Glucagon-like peptide-1 (GLP-1) and glucose-dependent insulinotropic polypeptide (GIP) are secreted in response to ingestion of nutrients. GLP-1 and GIP are rapidly inactivated in the circulation by dipeptidyl peptidase-IV (DPP-IV), which cleaves off two N-terminal amino acids [1].
First, Vilsbøll et al. [2] demonstrated a response and a secretion of plasma immunoreactive active GLP-1 (pactive GLP-1) and plasma immunoreactive total GLP-1 (p-total GLP-1) after ingestion of a breakfast test meal (TM) were decreased in obese European patients with type 2 diabetes mellitus (T2DM). However, Lee et al. [3] and Kozawa et al. [4] reported that the response and secretion of p-active GLP-1 following ingestion of TM in Japanese patients with T2DM with or without obesity was similar to that in controls. They indicated that GLP-1 secretion may be different in races or dietary’s customs of subjects [3,4]. Our previous study, however, reported that postprandial secretion of p-active GLP-1 like substances (p-active GLP-1-S) related to plasma glucose (PG) levels following TM were impaired in incretinrelated drug-naïve non-obese Japanese patients with T2DM [5].
The differences between our preliminary study [5] and that of Lee et al. [3] Kozawa et al. [4] from that of Vilsbøll et al. [2] may be due to the different index for active GLP-1 secretion and the inclusion of subjects with obesity in the study.
Therefore, this study was to examine the effects of a TM similar to the one used by Vilsbøll et al. [2] on basal and postprandial levels of p-active GLP-1-S and the relative values of p-active GLP-1-S/PG in incretin-related drug-naïve obese Japanese patients with T2DM and obese Japanese controls with normal glucose tolerance (NGT).
2. MATERIAL AND METHODS
2.1. Sample and Recruitment
Obese Japanese patients with T2DM (n = 24, group 1) and obese Japanese subjects with NGT as controls (n = 12, group 2) were included in this study. The presence of obesity was based on the criteria of the Japan Society for the Study of Obesity [6]. Patients with T2DM receiving insulin treatment were excluded, because insulin therapy may influence p-active GLP-1 levels [7]. Diabetic patients were diagnosed according to the World Health Organization criterion [8], which nowadays Japan Diabetes Society requires glycated hemoglobin (HbA1c) ≥ 6.5% (NGSP; National Glycohemoglobin Standardization Program) for a diagnosis of diabetes [9].
Demographic characteristics of subjects participated were shown in Table 1. Patients and control subjects were matched by sex, age, and body mass index (BMI). Because patients had a mean of 9 years passed the diagnosis of diabetes, some had retinopathy, nephropathy or peripheral neuropathy as microvascular disturbance, and asymptomatic coronary heart disease or asymptomatic cerebral vascular diseases as macrovascular disturbance. The occurrences of retinopathy, nephropathy and peripheral neuropathy were examined by ophthalmologist, by
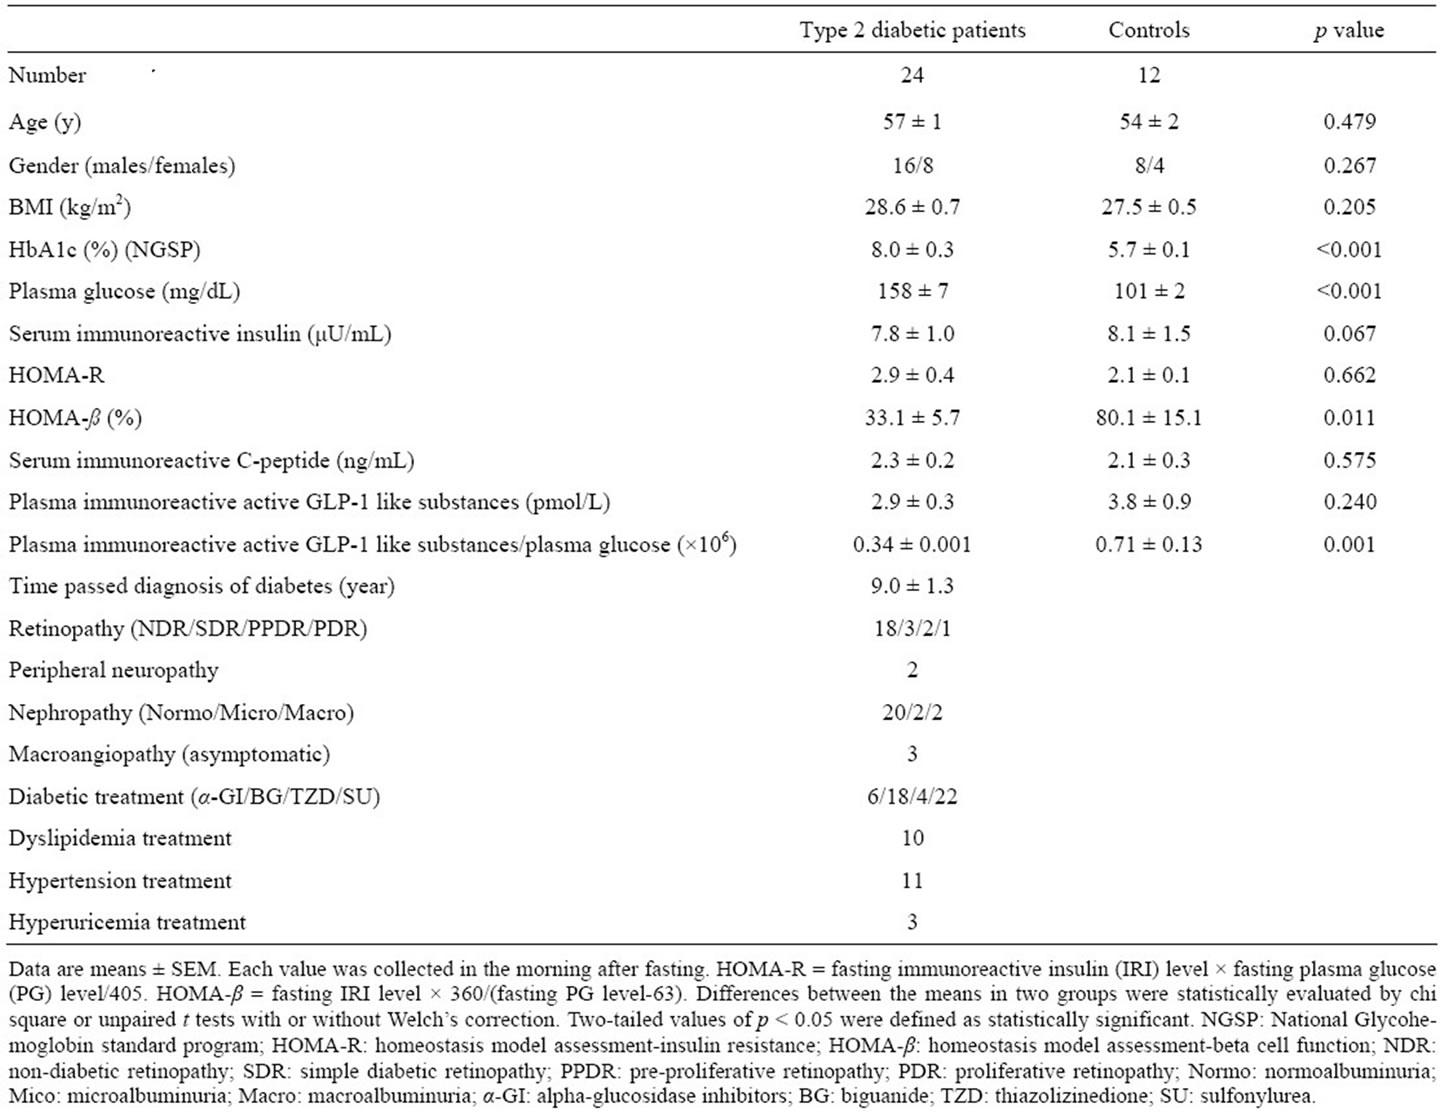
Table 1. Clinical characteristics of obese Japanese patients with type 2 diabetes mellitus and obese Japanese controls with normal glucose tolerance.
means of albuminuria and by Achilles’ tendon reflex, respectively. The macrovascular complications were defined by past medical history. Patients were treated with diet, exercise, and/or oral medical drugs for hyperglycemia. Oral medical drugs consisted of α-glucosidase inhibitors, sulfonylurea, biguanide, thiazolidinedione, or combinations of these agents. Some patients also were receiving anti-hyperlipidemic, anti-hypertensive or antihyperuricemic drugs.
Control subjects were recruited from obese persons with normal glucose tolerance for a 75-g oral glucose tolerance test with <6.5% of HbA1c (NGSP) [9]. None of the participants had a history of gastrointestinal disease, anemia, or impaired liver function and none were receiving any other medications.
Written informed consent was obtained from all subjects after informing them of the purpose and nature of the study. This study was performed in accordance with the Declaration of Helsinki and with the approval of our hospital ethics committees.
2.2. Study Design
After 10-hour overnight fast, subjects were placed in a seated position at 9:00 a.m. with one cannula inserted into the cubital vein for blood sampling based on the method of Vilsbøll et al. [2]. The TM (520 - 560 kcal) comprised of 60% carbohydrate, 23% fat and 17% protein [5,7]. Patients stopped all medications during the study of which all medications had been received until the day before the study.
Insulin resistance and beta-cell function were assessed using homeostasis model assessment for insulin resistance (HOMA-R) and homeostasis model assessment for beta cell function (HOMA-β, %), which were calculated by the equations of [fasting serum immunoreactive insulin (s-IRI) level × fasting PG level]/405 and [fasting s-IRI level × 360/(fasting PG level-63). Insulinogenic index was also calculated by the ratio of change in postprandial s-IRI level/PG level from baseline to 30 minutes after ingestion of the TM as result obtained by the OGTT [3,4]. Further, the relative value of GLP-1-S/PG was defined as a calculation by the ratio of change before and 30 and 60 minutes after ingestion of TM.
Blood samples were collected in ice-cooled tubes from the inserted cannula immediately before, and 30 and 60 minutes after ingestion of TM. Samples were separated by centrifugation at 4˚C for later determination of PG, s-IRI, serum immunoreactive C-peptide (s-CPR), and pactive GLP-1-S. The sample collected was also used to measure HbA1c levels.
Blood samples for p-active GLP-1-S and glucose were collected in ice-cooled vacutainers containing EDTA with 10 μL DPP-IV inhibitor (diprotin) per mL of blood and in vacutainers containing NaF, respectively [5,7].
Incremental levels of PG, s-IRI, s-CPR and p-active GLP-1-S after ingestion of the TM were calculated from the integrated areas under curves (AUC) on each level at 0, 30, 60 minutes after ingestion of the TM based on the method described by Vilsbøll et al. [2].
2.3. Assay Methods
HbA1c was measured with the previously reported method using high-performance liquid chromatography [5,7]. The value was expressed as NGSP equivalence [9]. PG was measured with oxidase method using a comercial kit (Arkray Inc., Kyoto, Japan or Nittobo Medical Co., Tokyo, Japan). The sensitivity and specificity were the same in both kits. S-IRI was measured by two-site sandwich enzyme immunoassay kit (Abbott, Co., Tokyo, Japan or Tosoh Co., Tokyo, Japan). S-CPR was measured by two-site sandwich enzyme immunoassay kit (Roche Diagnostics, Co., Tokyo, Japan or Tosho Co., Tokyo, Japan). Both lower detection limits are 1.0 μU/mL for s-IRI and 0.2 ng/mL for s-CPR. The validation of both kits was same, and the intraand inter-assay coefficients of variation were both <5% in our laboratories. Both IRI assays showed 100%, 0.1%, and 0.001% cross-reactivities with human insulin, human pro-insulin, and human CPR, respectively. Both CPR assays showed 69% and 0% crossreactivities with human pro-insulin and human insulin, respectively. P-active GLP-1 was measured in the unextracted sample by two-site sandwich enzyme immunoassay using a commercially available ELISA active GLP-1 kit (Linco Research, St. Charles, MO, USA) at SRL, Inc. (Tokyo, Japan) as reported previously [5,7]. As foreign substances in unextracted samples might interfere in the assay [10-12], we represented as p-active GLP-1-S that the value measured by this kit. The antibody provided with kit specifically recognizes the N-terminal region of active GLP-l (7-36 and 7-37), but not other forms of GLP-l (1-36, 1-37, 9-36 and 9-37). The limit of detection for this assay is <2.0 pmol/L. The intraand inter-assay coefficients of variation were both <13% [5,7].
2.4. Statistical Methods
Results are expressed as means ± SEM. Differences between means of basal variables, insulinogenic index, active-GLP-1-S/PG or AUC in groups were evaluated statistically by chi square or unpaired t tests with or without Welch’s correction.
The same method [5,7] was used to determine how the response was affected by ingestion of the TM in groups. Two-tailed p-values <0.05 were considered statistically significant. Statistical analyses were performed using GraphPad Prism version 5.04 (GraphPad Software, La Jolla, CA, USA).
3. RESULTS
3.1. Baseline Data (Table 1)
There were no significant differences in sex, age, or BMI between groups. Means of HbA1c and PG were significantly higher in group 1 than in group 2. There was no significant difference in means of s-IRI, s-CPR or HOMA-R values between groups. However, means of HOAMA-β and p-active GLP-1-S/PG were significantly lower in group 1 than in group 2, although p-active GLP- 1-S level was not significantly but tended to be lower in group 1 than group 2. In group 1, mean of diabetes was long time with 9 years, and some had microand macrovascular complications with the various degrees and received various drugs for various diseases.
3.2. Postprandial Data (Figure 1)
For postprandial levels following ingestion of the TM, mean PG at each time point from 0 to 60 minutes was significantly higher in group 1 than in group 2, whereas means of insulinogenic index and, and s-IRI, s-CPR, pactive GLP-1-S and p-active-GLP-1-S/PG at each time point were significantly lower in group 1 than in group 2. Peaked levels of PG, s-IRI and s-CPR were shown 60 minutes after TM in both groups. However, peaked levels of p-active GLP-1-S and p-active-GLP-1-S/PG were observed 30 min after TM in both groups.
3.3. AUC Data (Table 2)
In terms of AUC (0 - 60 minutes), mean of PG was significantly higher in group 1 than in group 2. However, means of s-IRI and s-CPR were significantly lower in group 1 than in group 2. In addition, means of p-active GLP-1-S and p-active GLP-1-S/PG were significantly lower in group 1 than in group 2.
4. DISCUSSION
We examined effects of TM on basal and postprandial levels of various variables in obese Japanese patients with T2DM and obese Japanese controls with NGT. The patterns of postprandial PG and s-IRI levels were similar to those in all subjects with obesity by Vilsbøll et al. [2] and others, but were different from those in controls without obesity by Lee et al. [3] and by our study reported previously [5]. All patients demonstrated low insulin secretion associated with low early-phase after ingestion of the TM, which was confirmed by low HOMA-β values and low postprandial s-IRI levels with low insulinogenic index following ingestion of the TM. Matthews et al. [10] defined that HOMA-R level with less than 1.6 is not insulin resistance, with 1.6 - 2.5 is border line of insulin resistance and with more than 2.5 is insulin resistance. Based on the criteria, the groups of patients and
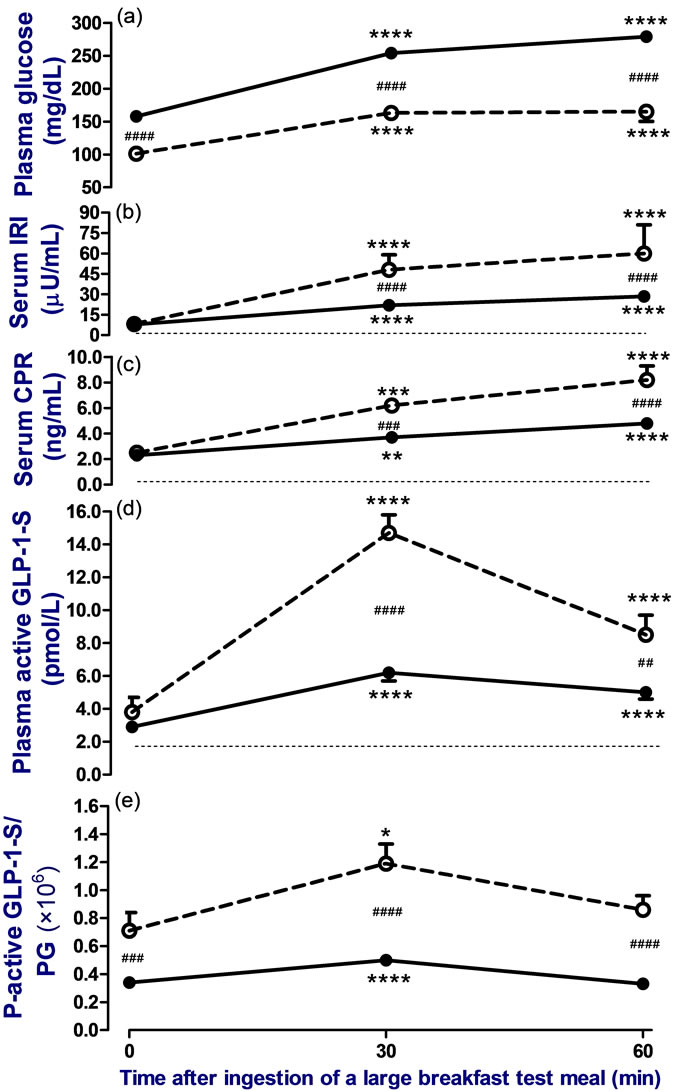
Figure 1. Change in levels of plasma glucose (PG) (a), serum immunoreactive insulin (IRI) (b), serum immunoreactive Cpeptide (CPR) (c), plasma immunoreactive active GLP-1 like substances (p-active GLP-1-S); (d) and relative value of pactive GLP-1-S/PG (e) before, 30, and 60 minutes after ingestion of a breakfast test meal (520 - 560 kcal) in obese Japanese patients with type 2 diabetes (●—●, n = 24) or obese Japanese subjects with normal glucose tolerance as control (○……○, n = 12) following 10 hours of overnight fasting. Mean of BMI did not differ significantly between groups. Patients stopped all medications during the study. The dotted lines indicate the limit level of detection for IRI, CPR, and active-GLP-1 like substances assays. To compare the difference, a Bonferroni’s test was used as a post hoc test after repeated measures one-way ANOVA test or two-way ANOVA test. Two-tailed values of p < 0.05 were defined as statistically significant (****p < 0.0001, ***p < 0.001 and **p < 0.01 vs. before ingestion of the test meal, and ####p < 0.0001, ###p < 0.001 and ##p < 0.01 vs. group with control subjects).
controls had obviousness and tendency of insulin resistances, respectively. In a fact, the means of fasting s-IRI and HOMA-R levels in obese control group as well as patient group in this study were significantly (p < 0.01) higher than those (7.1 μU/mL and 1.6, respectively) in non-obese controls by Lee et al. [3] and those (3.7
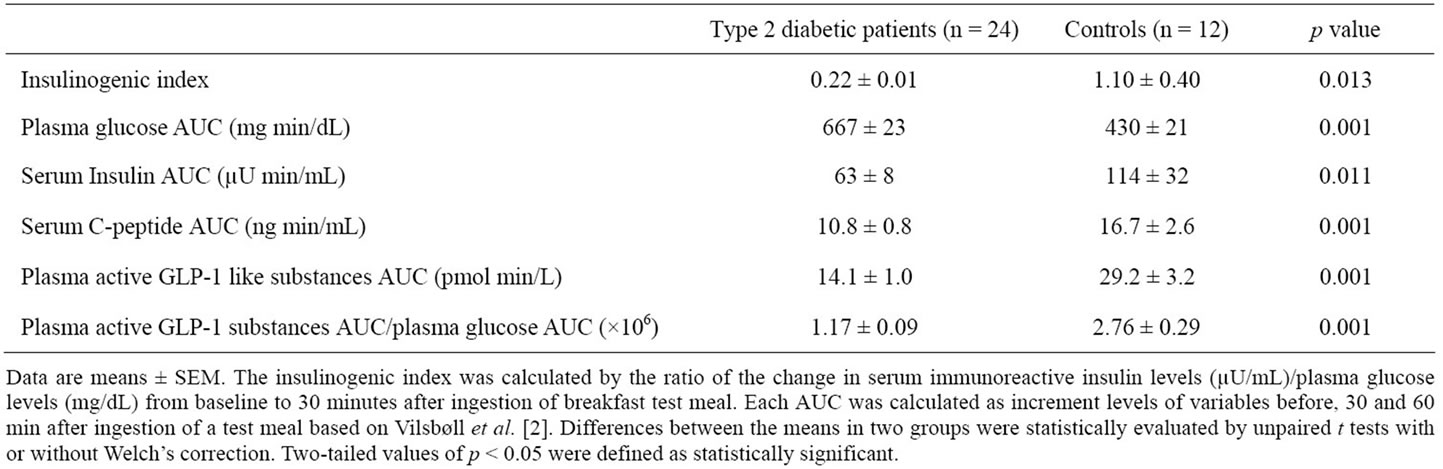
Table 2. Insulinogenic index and integrated area under curve (AUC) (0 - 60 minutes) of various parameters after ingestion of a test meal by obese Japanese patients with type 2 diabetes mellitus and obese Japanese controls with normal glucose tolerance.
μU/mL and 0.8, respectively) in non-obese controls reported by us [5], which were confirmed by high s-CPR levels. Therefore, the subjects had obesity with insulin resistance.
This is a first report that postprandial p-active GLP- 1-S levels were significantly lower by about half in obese Japanese patients than in the controls. The patients had diabetes for a mean of more than 9 years, and then they had microand macro-vascular complications without sever degrees.
In Japanese patients with T2DM, Lee et al. reported that there was no significant difference in mean of fasting and postprandial levels with AUC (0 - 60 min) of p-active GLP-1 levels measured using the same method as the present study after ingestion of TM between non-obese patients and controls [3]. Further, Kozawa et al. reported that the incretin secretion did not differ between obese Japanese patients and controls [4]. On the other hand, Vilsbøll et al. and others reported that postprandial levels with AUC (0 - 60 min) and secretion of p-active GLP-1 after ingestion of TM were decreased in obese European patients with T2DM compared with controls [2]. Accordingly, the difference is considered to be due to that GLP-1 secretion may be different in races or dietary’s customs of subjects [3,4]. However, this study indicates that one of the reasons may be due to the difference in the presence of obesity among study participants. Several studies in non-Japanese patients with T2DM have indicated a negative association between plasma GLP-1 levels and BMI [13-16]. Meanwhile, Lee et al. [3] found no such association in the Japanese patients with T2DM. But, the patients had no obesity. In addition, Kozawa et al. compared obese patients and non-obese controls with NGT, and measured total GLP-1 but not active GLP-1 [4]. Therefore, the presence of obesity in Japanese subjects may also influence p-active GLP-1 levels. Alternatively, the differences between our findings and those of Kozawa et al. [4] may be due to the glycemic state of the patients. The glycemic state estimated by HbA1c (8.0% ± 0.3% in NGSP) in this study was similar to that (7.8% ± 1.8% in NGSP) in the patients by Kozawa et al. [4]. Hence the glycemic state may not be directly related to these differences.
Finally, the duration of disease, the medications used for various disorders before the study and the presence of diabetic complications, which indicated the T2DM is not homogenous, may influence findings. In the patients by this study, there was no significant differences (r = 0.01, p = 0.643, n = 24) in the association of AUCs in p-active GLP-1-S levels and the duration of diabetes from discovery. Furthermore, sulfonylurea [17,18] or thiazolizinedione [19] used did not decrease secretion of active GLP-1, whereas alpha-glucosidase inhibitors [20] or biguanide [21] may enhance secretion of active GLP-1. Hence, the p-active GLP-1 levels in patients treated with alpha-glucosidase inhibitors (n = 6) or biguanide (n = 18) in this study should result in higher than those in control. However, actual levels of p-active GLP-1-S were not higher in the patients than in the controls. Further, antihyperlipidemic, anti-hypertensive or anti-hyperuricemic medicines does not influence secretion of active GLP-1.
In some diabetic complications, autonomic neuropathy may decrease incretin effect [22], whereas chronic renal failure (serum creatinine 2.2 ± 0.9 mg/dl) may result in delayed elimination of GLP-1 secretin [23]. As we did not examine the presence of autonomic neuropathy by using laboratory tests as previously reported methods [2, 13], it was unclear that the patients by this study had autonomic neuropathy, but the patients did not complain the clinical symptoms such as orthostatic hypotension, awareness hypoglycemia or other related disturbances. Also, Toft-Nielsen et al. reported there was no statistical association between p-active GLP-1 levels and autonomic neuropathy in patients with T2DM [13]. Further, although two patients in this study had macroalbuminuria, the serum creatinine levels were less than 1.0 mg/dl with more than 60 mL/minute/1.73 m2 of GFR. Therefore, these factors may be not directly related to the impaired GLP-1 secretion in this study.
Limitations of This Study
First, the total calorie (520 - 560 kcal) of TM used in this study was different from that (460 kcal) used in Kozawa et al. [4], although the ratios of nutrients (60% carbohydrate, 23% fat and 17% protein) in TM of our study were similar to those (47% carbohydrates, 37.3% fat and 15.7% protein) in TM of Kozawa et al. Therefore, it is not completely ruled out that the different response may be due to the different total calorie used as TM.
Second, we used ELISA method developed by Linco Co., whereas Vilsbøll et al. used ELISA method developed by their group [2]. Recently, the Japan Diabetes Society and the Japan Association for Diabetes Education and Care Committee for Standardized Incretin Measurement recommend strongly that when p-active GLP-1 is measured, it needs to use sample extracted by ethanol or other methods [11]. The reason is due to that foreign substances in unextracted samples might interfere in the assay [12]. However, as the assays by us and Vilsbøll et al. [2] were not used such extracted samples, but ELISA kits using by us and Vilsbøll et al. were different, it may be difficult to compare the active GLP-1 levels between the groups directly. Moreover, the method of measuring p-active GLP-1 were same between this study and the studies by Lee et al. [3] and Kozawa et al. [4].
Third, we had stopped the measurement for p-active GLP-1-s at early phase of 60 minutes after the ingestion of TM because that the most dramatic changes after the TM were within 60 minutes. Previous studies measured it until 3 hours after the ingestion of TM [2-4]. The difference may be influence to the results
5. CONLUSION
In conclusion, our results indicate that before and postprandial levels of plasma active GLP-1 like substances including relative to plasma glucose after TM in obese Japanese patients with T2DM were decreased compared with obese Japanese controls with NGT, which was not related to durations of disease, various complications and drugs except incretin-related medicines for diseases. Accordingly, there was an impaired active GLP-1 secretion in some type 2 diabetic patients who had obesity in European and Japan in spite of different in races or dietary’s customs of subjects.
6. ACKNOWLEDGEMENTS
We thank the clinical nursings, clinical laboratory technicians and clinical dietitians of Nagaoka Red Cross Hospital and Niigata Medical Center for their valuable technical assistance.
![]()
![]()
REFERENCES
- Kieffer, T.J., McIntosh, C.H. and Pederson, R.A. (1995) Degradation of glucose-dependent insulinotropic polypeptide and truncated glucagon-like peptide 1 in vitro and in vivo by dipeptidyl peptidase IV. Endocrinology, 136, 3585-3596. doi:10.1210/en.136.8.3585
- Vilsbøll, T., Krarup, T., Sonne, J., Madsbad, S., Vølund, A., Juul, A.G. and Holst, J.J. (2003) Incretin secretion in relation to meal size and body weight in healthy subjects and people with type 1 and type 2 diabetes mellitus. The Journal of Clinical Endocrinology & Metabolism, 88, 2706-2713. doi:10.1210/jc.2002-021873
- Lee, S., Yabe, D., Nohtomi, K., Takada, M., Morita, R., Seino, Y. and Hirano, T. (2009) Intact glucagon-like peptide-1 levels are not decreased in Japanese patients with type 2 diabetes. Endocrine Journal, 57, 119-126. doi:10.1507/endocrj.K09E-269
- Kozawa, J., Okita, K., Imagawa, A., Iwahashi, H., Holst, J.J., Yamagata, K. and Shimomura, I. (2010) Similar incretin secretion in obese and non-obese Japanese subjects with type 2 diabetes. Biochemical and Biophysical Research Communications, 393, 410-413. doi:10.1016/j.bbrc.2010.01.134
- Kamoi, K., Ohara, N., Tomoo, I., Shinozaki, Y., Furukawa, K. and Sasaki, H. (2011) Normal response of active GLP-1 like substances level to test meal in non-obese type 2 diabetic Japanese patients with complications and receiving treatments. Journal of Diabetes & Metabolism, 2, 147. doi:10.4172/2155-6156.1000147
- Examination Committee of Criteria for “Obesity Disease” in Japan, Japan Society for the Study of Obesity (2002) New criteria for “obesity disease” in Japan. Circulation Journal, 66, 987-992.
- Kamoi, K., Shinozaki, Y., Furukawa, F. and Sasaki, H. (2011) Decreased active GLP-1 response following large test meal in patients with type 1 diabetes using bolus insulin analogues. Endocrine Journal, 58, 905-911. doi:10.1507/endocrj.K11E-125
- World Health Organization (1999) Definition, diagnosis and classification of diabetes and its complications. Part 1: Diagnosis and classification of diabetes mellitus. Department of Noncommunicable Disease Surveillance, Geneva.
- Seino, Y., Nanjo, K., Tajima, N., Kadowaki, T., Kashiwagi, A., Araki, E., Ito, C., Inagaki, N., Iwamoto, Y., Kasuga, M., Hanafusa, T., Haneda, M. and Ueki, K. (2010) Report of the Committee on the classification and diagnostic criteria of diabetes mellitus. Diabetology International, 1, 2-20. doi:10.1007/s13340-010-0006-7
- Matthews, D.R., Hosker, J.P., Rudenski, A.S., Naylor, B.A., Treacher, D.F. and Turner, R.C. (1985) Homeostasis model assessment: Insulin resistance and beta-cell function from fasting plasma glucose and insulin concentrations in man. Diabetologia, 28, 412-419. doi:10.1007/BF00280883
- The Japan Diabetes Society and the Japan Association for Diabetes Education and Care Committee for Standardized Incretin Measurement (2011) Guideline for incretin measurement. http://www.jds.or.jp
- Yabe, D., Watanabe, K., Sugawara, K., Kuwata, H., Kitamoto, Y., Sugizaki, K., Fujiwara, S., Hishizawa, M., Hyo, T., Kuwabara, K., Yokota, K., Iwasaki, M., Kitatani, N., Kurose, T., Inagaki, N. and Seino, Y. (2011) Comparison of incretin immunoassays with or without plasma extraction: Incretin secretion in Japanese patients with type 2 diabetes. Journal of Diabetes Investigation, 3, 70- 79. doi:10.1111/j.2040-1124.2011.00141x
- Toft-Nielsen, M.B., Damholt, M.B., Madsbad, S., Hilsted, L.M., Hughes, T.E., Michelsen, B.K. and Holst, J.J. (2001) Determinants of impaired secretion of glucagonlike peptide-1 in type 2 diabetic patients. The Journal of Clinical Endocrinology & Metabolism, 86, 3717-3723. doi:10.1210/jc.86.8.3717
- Ryskjaer, J., Deacon, C.F., Carr, R.D., Krarup, T., Madsbad, S., Holst, J. and Vilsbøll, T. (2006) Plasma dipeptidyl peptidase-IV activity in patients with type-2 diabetes mellitus correlates positively with HbAlc levels, but is not acutely affected by food intake. European Journal of Endocrinology, 155, 485-493. doi:10.1530/eje.1.02221
- Muscelli, E., Mari, A., Casolaro, A., Camastra, S., Seghieri, G., Gastaldelli, A., Holst, J.J. and Ferrannini, E. (2008) Separate impact of obesity and glucose tolerance on the incretin effect in normal subjects and type 2 diabetic patients. Diabetes, 57, 1340-1348. doi:10.2337/db07-1315
- Vollmer, K., Holst, J.J., Baller, B., Ellrichmann, M., Nauck, M.A., Schmidt, W.E. and Meier, J.J. (2008) Predictors of incretin concentrations in subjects with normal, impaired, and diabetic glucose tolerance. Diabetes, 57, 678-687. doi:10.2337/db07-1124
- Mannucci, E., Pala, L., Ciani, S., Bardini, G., Pezzatini, A., Sposato, I., Cremasco, F., Ognibene, A. and Rotella, C.M. (2005) Hyperglycaemia increases dipeptidyl peptidase IV activity in diabetes mellitus. Diabetologia, 48, 1168-1172. doi:10.1007/s00125-005-1749-8
- Fukase, N., Manaka, H., Sugiyama, K., Takahashi, H., Igarashi, M., Daimon, M., Yamatani, K., Tominaga, M. and Sasaki, H. (1995) Response of truncated glucagonlike peptide-1 and gastric inhibitory polypeptide to glucose ingestion in non-insulin dependent diabetes mellitus. Effect of sulfonylurea therapy. Acta Diabetologica, 32, 165-169. doi:10.1007/BF00838486
- Larsen, P.J., Wulff, E.M., Gotfredsen, C.F., Brand, C.L., Sturis, J., Vrang, N., Knudsen, L.B. and Lykkegaard, K. (2008) Combination of the insulin sensitizer, pioglitazone, and the long-acting GLP-1 human analog, liraglutide exerts potent synergistic glucose-lowering efficacy in severely diabetic ZDF rats. Diabetes, Obesity and Metabolism, 10, 301-311. doi:10.1111/j.1463-1326.2008.00865.x
- Göke, B., Fuder, H., Wieckhorst, G., Theiss, U., Stridde, E., Littke, T., Kleist, P., Arnold, R. and Lücker, P.W. (1995) Voglibose (AO-128) is an efficient alpha-glucosidase inhibitor and mobilizes the endogenous GLP-1 reserve. Digestion, 56, 493-501. doi:10.1159/000201282
- Cuthbertson, J., Patterson, S., O’Harte, F.P. and Bell, P.M. (2011) Addition of metformin to exogenous glucagon-like peptide-1 results in increased serum glucagon-like peptide-1 concentrations and greater glucose lowering in type 2 diabetes mellitus. Metabolism, 60, 52-56. doi:10.1016/j.metabol.2010.01.001
- Kazakos, K.A., Sarafidis, P.A. and Yovos, J.G. (2008) The impact of diabetic autonomic neuropathy on the incretin effect. Medical Science Monitor, 14, 213-220.
- Meier, J.J., Nauck, M.A., Kranz, D., Holst, J.J., Deacon, C.F., Gaeckler, D., Schmidt, W.E. and Gallwitz, B. (2004) Secretion, degradation, and elimination of glucagon-like peptide 1 and gastric inhibitory polypeptide in patients with chronic renal insufficiency and healthy control subjects. Diabetes, 53, 654-662. doi:10.2337/diabetes.53.3.654
NOTES
*Disclosure statement: The authors have nothing to disclose.