Journal of Diabetes Mellitus
Vol. 2 No. 1 (2012) , Article ID: 17284 , 7 pages DOI:10.4236/jdm.2012.21001
Type 2 diabetes with good glycemic control have improved insulin response and lower non-esterified fatty acid level after a meal challenge*
![]()
1Endocrine Unit, Department of Medicine, Universiti Sains Malaysia, Penang, Malaysia; #Corresponding Author: jaiyati@yahoo.com
2Department of Chemical Pathology, Universiti Sains Malaysia, Penang, Malaysia
3Department of Family Medicine, Universiti Sains Malaysia, Penang, Malaysia
Received 11 September 2011; revised 26 October 2011; accepted 10 November 2011
Keywords: Insulin response; non-esterified fatty acid; standardised meal; type 2 diabetes; glycemic control
ABSTRACT
Background: Pathogenesis of type 2 diabetes (T2DM) involves defects in β-cell function with impaired first and second phase insulin response, and reduced insulin sensitivity. Diabetic dyslipidemia is an important and common risk factor for coronary heart disease (CHD). Aims: This study examined the effect of glycemic control on post prandial insulin and lipid parameters in response to a standardised meal challenge among Type 2 diabetes patients with good and poor glycemic control. Methods: We cross-sectionally studied 31 T2DM patients with good glycemic control and 32 T2DM patients with poor glycemic control. Subjects were given, after minimum 10 hours of fasting, a standard meal containing 58% fat. Fasting and serial postprandial blood samples were taken over 8 hours to determine levels of triglyceride, direct LDL-C, apoB lipoprotein, non-esterified-fatty-acid, insulin and blood glucose. Results: Post prandial NEFA was significantly higher in poor controlled diabetes patients compared to good control diabetes patients (p = 0.019), and post-hoc analysis showed significant difference from 3 hours post prandial to 4 hours post prandial, where p= 0.021. Although the difference in insulin between the 2 groups did not reach statistical significance (p =0.058), post-hoc analysis showed significant difference between the 2 groups from fasting to 1 hour post prandial (p = 0.034) despite postprandial glucose being significantly higher in poor controlled diabetes patients (p < 0.001), throughout the postprandial period. Conclusion: T2DM patients with good glycemic control have improved insulin response with lower non-esterified fatty acid.
1. INTRODUCTION
Diabetic dyslipidemia is an important risk factor for coronary heart disease (CHD), the leading cause for morbidity and mortality for diabetes patients. It is characterized by high plasma triglyceride, low concentrations of high-density-lipoprotein (HDL), and preponderance of small dense low-density-lipoprotein cholesterol (LDL-C) [1].
Studies have shown that the postprandial state of diabetes patients are amplified and prolonged compared to non-diabetes. The postprandial state consists of a cluster of metabolic abnormalities affecting glucose, lipid, and inflammatory markers. Postprandial hyperglycemia have been shown to be a powerful predictor of cardiovascular (cv) risk [2,3] and treatment targeting the abnormality is associated with almost 50% reduction in cv event [4]. As for postprandial lipid parameters, recent large scale prospective studies have provided proof for the role of TG, especially postprandial or non-fasting TG, as an independent risk factors for cardiovascular disease (CVD) [5,6].
ApoB lipoprotein is the major apolipoprotein of all atherogenic lipoprotein and has been shown to have a strong predictive power for CHD events, with exaggerated post prandial response seen in T2DM patient [7]. With regards to non-esterified fatty acid (NEFA), even though it is not associated with increased in CVD and CHD risk per se, its role in diabetic dyslipidemia is closely related to the increased in hepatic TG production.
Data from UKPDS have demonstrated that T2DM is a progressive disease despite using algorithmic approaches to sustain good glucose control [8]. With the use of Homeostasis Model Assessment (HOMA), UKPDS also clearly illustrated that the progressive nature of diabetes is due to ongoing deterioration of β-cell function without a change in insulin sensitivity [9]. Declining β-cell function resulted in reduction of postprandial insulin response, both first and second phase.
The purpose of this study is to determine and compare the effect of glycemic control on post prandial lipid parameters (direct LDL-C, TG, ApoB, NEFA), insulin, and plasma glucose after a standardised meal between Type 2 diabetes patients with good and poor glycemic control.
2. MATERIAL AND METHODS
2.1. Subjects
This study was a cross-sectional study where subjects were recruited from patients attending diabetes clinic in HUSM from November 2009 to march 2010. Patients were eligible to participate if they were at least 18 years of age, diagnosed with T2DM (according to WHO classification) for at least one year at the time of screening visit, and on stable dose of oral antidiabetic agents (biguanides, suphonylureas, thizoledienediones) and anti lipid agents (statins, fibrates) for at least 3 months at the time of screening visit. Patients diagnosed with Type 1 diabetes mellitus, or any of the following within 6 months of screening: renal failure, hepatic failure, myocardial infarction, stroke, or heart failure requiring hospitalization were excluded. Those on post prandial regulator (α-glucosidase inhibitor, glinides), dipeptidyl-peptidaseinhibitor IV (DPP-IV inhibitor), rapid acting insulin analogue, Glucagon-like-peptide 1 (GLP-1) agonist, and ezetimibe within 3 months of screening visit were also excluded. Subjects were divided into 2 groups based on their glycemic control: HbA1c ≤ 7.0% (good control) and HbA1c ≥ 8.5% (poor control)
2.2. Experimental Procedures
In the morning of the study on a pre-specified date, after at least 10 hours of fasting, subjects were administered a standard meal consisting of one cup of rice, one piece of fish three matchbox in size with four tablespoon of gravy, one piece of fried chicken two matchbox in size, and one medium size egg fried with one tablespoon of oil. The meal would provide about 857.5 kcal of energy, was composed of 58% fat, 21.2% carbohydrate, and 21.8% protein. Before meal and over 8 hours after the meal, hourly blood samples were taken for the determination of plasma level of glucose, insulin, total cholesterol (TC), direct low-density-lipoprotein cholesterol (direct LDL-C), high-density lipoprotein cholesterol (HDL-C), triglyceride (TG), ApoB lipoprotein (ApoB), and non-esterified fatty acid. As for plasma glucose and insulin, during the initial 3 hours, samples were taken every 30 minutes, then hourly for the subsequent 5 hours.
2.3. Biochemical Analysis
The serum samples were used for the measurements of lipid profile, apolipoprotein B (apo B), non-esterified fatty acid (NEFA) and insulin. Blood glucose level was measured in plasma and haemoglobin A1c level was measured in whole blood. All serum samples were kept at −20˚C before further analysis. Triglyceride and total cholesterol levels were measured by enzymatic colorimetric method (RANDOX laboratories, United Kingdom). For the determination of HDL cholesterol, apo B-containing lipoproteins in the serum were precipitated with phosphotungstic acid and magnesium ions and then the cholesterol concentration was measured in the supernatant after centrifugation (RANDOX laboratories, United Kingdom). Direct LDL cholesterol concentration was measured by enzymatic clearance assay (direct LDLcholesterol) after elimination of chylomicron, VLDL and HDL (RANDOX laboratories, United Kingdom). Apolipoprotein B level was analyzed by immunoturbidimetric immunoassay (RANDOX laboratories, United Kingdom). The determination of NEFA was by using ACS-ACOD enzymatic method (Wako Chemicals GmbH, Japan). Plasma blood glucose was measured by the glucose oxidase method (RANDOX laboratories, United Kingdom). Haemoglobin A1c level was measured in whole blood using ion-exchange high-performance liquid chromatography (Bio-Rad laboratories, USA). Insulin level was determined by sandwich immunoassay (Roche Diagnostics, USA). The intra and inter CV of insulin assay were <2% and <4.9% respectively.
2.4. Statistical Analysis
All data were analysed by means of statistical software SPSS version 18. Numerical variable are expressed as mean ± standard deviation. Categorical data are expressed using frequency and percentages. To compare the baseline characteristics between the two groups, independent t-test were used. To compare the postprandial excursion of direct LDL-C, Triglyceride, apoB lipoprotein, NEFA, and plasma glucose, and insulin, Repeated Measure Anova were used.
3. RESULTS
3.1. Baseline Characteristics
Sixty-three patients participated in the study, consisting of thirty-one patients in the good glycemic control group (eighteen male and thirteen female) and thirty-two patients in the poor glycemic control group (seven-teen male and fifteen female). The baseline characteristic (Table 1) of the good and poor control patients were comparable in term of age and body mass index .The baseline HbA1c and random blood glucose were significantly higher in the poor controlled group (p < 0.001), while for insulin, the difference between groups were not significant (p = 0.324). As for TG, NEFA, and direct LDL, the difference between the two groups also reach significance difference at baseline (p = 0.037, 0.036, and 0.043 respectively).
3.2. TG, Direct LDL-C, ApoB, and NEFA
After the test meal, there was significant difference in postprandial NEFA level between the 2 groups (p = 0.019) with higher level seen in the poor glycemic control patients, and post-hoc analysis showed significant difference between 3 hours after the meal and 4 hours after the meal (p = 0.021) (Figure 1).
Plasma TG increased in both groups of subjects, reaching a peak after 4 hours. During the postprandial period, TG concentrations at each time point were higher in the poor control group, but the difference did not reach statistical significance (p = 0.255) (Figure 1).
On the other hand, for direct LDL-C and ApoB, reduction in plasma level were observed in both groups in the postprandial period compared to fasting, notably 1 hour after the meal. Lower level was seen in the good control group, although the difference did not reach statistical significance (p = 0.097 for direct LDL, and 0.649 for ApoB lipoprotein) (Figure 1). Similar reduction was detected in plasma TC and HDL-C in both groups after the meal.
3.3. Plasma Insulin and Glucose
After the test meal, postprandial plasma glucose excursion was observed in both groups. As expected, the levels were higher at each time point in the poor controlled group, with 1 hour delay in peak level compared to the good controlled group. The difference in plasma glucose between the 2 groups was statistically significant (p < 0.001), with post-hoc analysis showing significant difference throughout the testing period (Figure 2).
Despite lower plasma glucose level in well controlled diabetes patients, their plasma insulin response to the meal was higher in the first 3 hours of the postprandial period, while in the subsequent hours, the level in the good controlled group became lower compared to the poor controlled group. Even though the difference in insulin level between the 2 groups did not reach statistical significance (p = 0.058), post-hoc analysis showed significantly higher (p = 0.034) insulin level in good glycemic control group in the first hour of meal challenge compared to poor glycemic control group (Figure 3).
4. DISCUSSION
This study showed that glycemic control affect postprandial insulin response to meal challenge, with statistically significant higher insulin level one hour after the
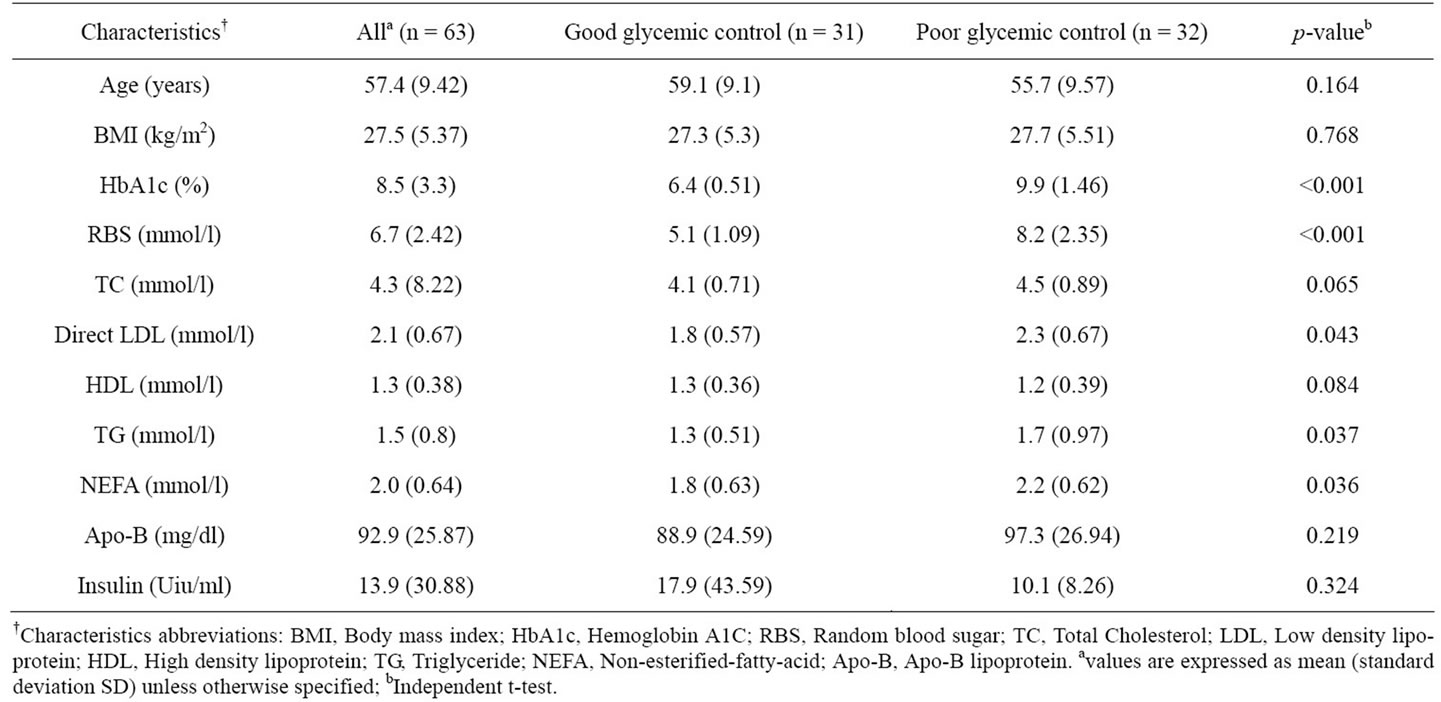
Table 1. Baseline characteristics of subjects participating in the study.
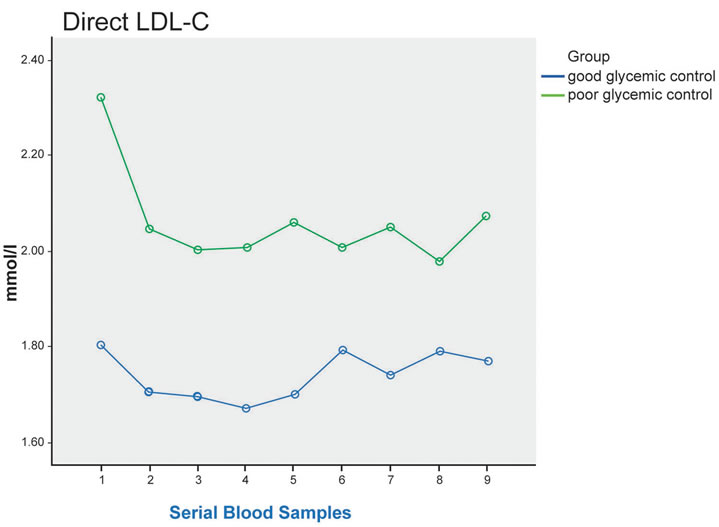
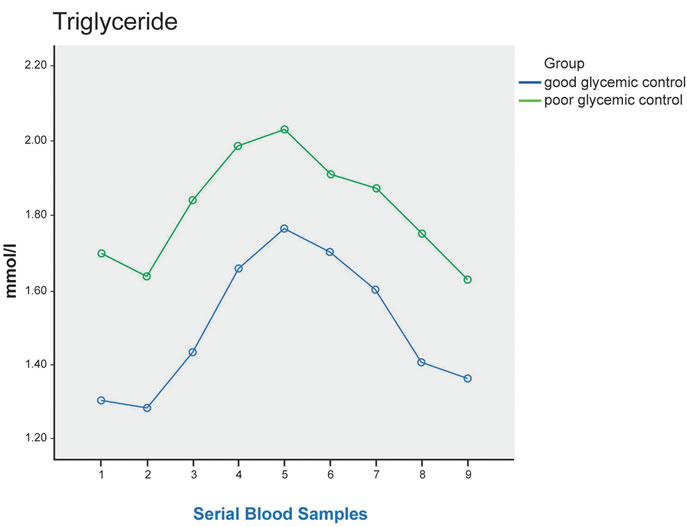
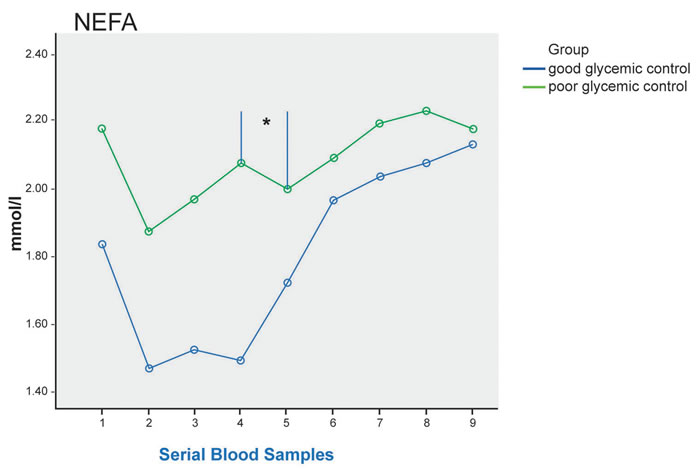
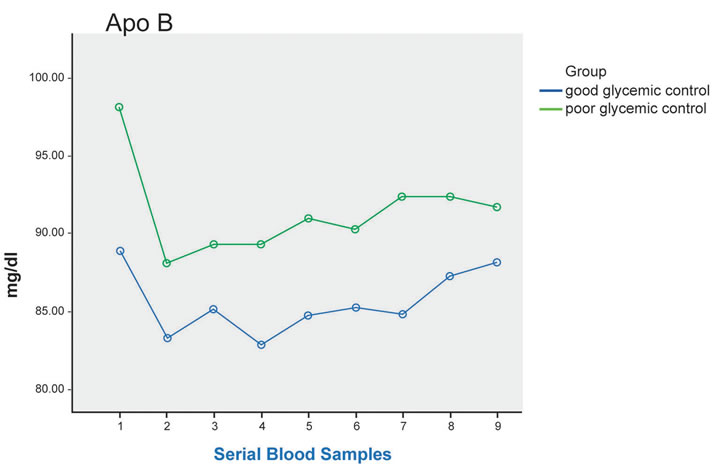
Figure 1. Plasma TG, direct LDL-C, ApoB, NEFA at fasting (sample 1) and up to 8 hours after a standard meal in good glycemic control (blue line) and poor glycemic control (green line) type 2 diabetes patients. Significant difference in postprandial NEFA level between the 2 groups (p = 0.019), and post-hoc analysis showed significant difference between 3 hours after the meal and 4 hours after the meal * (p = 0.021).
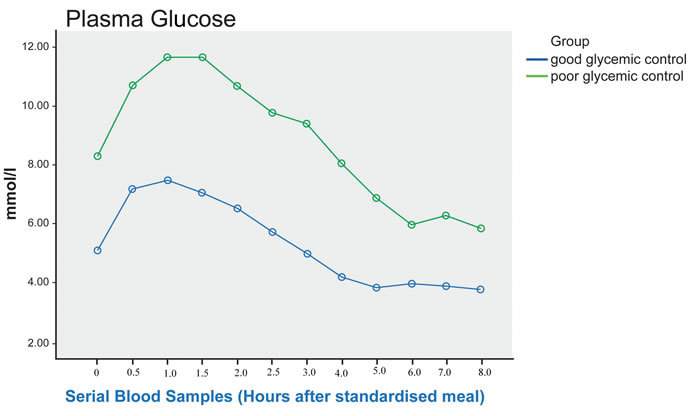
Figure 2. Post prandial RBS in good and poor glycemic control Type 2 diabetic patients (sampling done every 30 minutes for the first 3 hours with 0 being the fasting sample, subsequent sampling done hourly). There is significant difference in RBS between the 2 groups (p < 0.001), and post-hoc analysis showed significant difference throughout the testing period.
test meal in the good glycemic control group. This indicate that good glycemic control improve early phase insulin response to meal challenge in T2DM patients, leading to lower postprandial plasma glucose. This is in concordance with data from Phillips et al. [7] that showed with improvement of glycemic control and lowering of plasma glucose in T2DM subjects, there was higher postprandial insulin level, although the difference did not reach statistical significance.
In diabetes patients with poor glycemic control, the persistent excess of plasma glucose would overwhelm the glycolytic enzymes. The excess glucose would then be shunted into other metabolic pathways such as glycosylation, glucose autoxidation, and glucosamine pathway, forming reactive oxygen species (ROS). ROS can pass through membrane barriers to the cell’s nucleus, causing mutation and subsequent gradual loss of insulin gene expression, leading to declining insulin production and secretion. This is called glucose toxicity and is potentially irreversible [10].
One of the host defense against the damage from ROS is provided by antioxidant enzymes such as superoxide
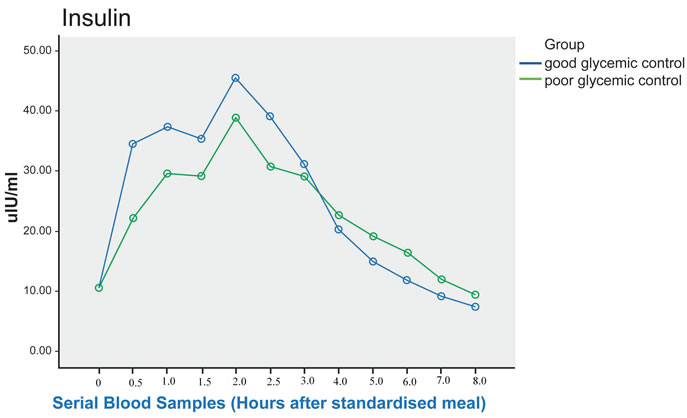
Figure 3. Post prandial Insulin in good and poor glycemic control Type 2 diabetic patients (sampling done every 30 minutes for the first 3 hours with 0 being the fasting sample; subsequent sampling done hourly). Although the difference in insulin level between the 2 groups did not reach statistical significance (p = 0.058), post-hoc analysis showed significant difference between the 2 groups from fasting to 1 hour post prandial, where p= 0.034.
dismutase, catalase, and glutathione peroxidase [10]. Previous study have shown that pancreatic islet tissue have the lowest intrinsic antioxidant capacity compared to other metabolic tissues such as liver and kidney [11], thus having higher risk of oxidative damage from ROS. Therefore, the progressive deterioration of β-cell function over time seen in T2DM patient may be explained by the incompletely treated hyperglycemia, leading to excessive formation of ROS that continually bombard and damage the β-cell [10]. In this study, the significantly higher insulin level one hour post meal challenge in the good glycemic control subjects , possibly indicates some conservation of β-cell function .
Another significant result from this study is that glycemic control affect postprandial NEFA level after a standardised meal, with significantly higher level seen in the poor glycemic control patients at each sampling time. This is in contrast to the study by Rivellese et al. [12] that showed unexpectedly higher NEFA level in the nondiabetic control compared to T2DM patients with good glycemic control. In the presence of insulin resistance, the reduced action of insulin on adipocytes through its action on hormone-sensitive lipase resulted in reduced suppression of lipolysis, causing raised fasting and postprandial NEFA levels [13]. Poorly controlled diabetes is associated with higher insulin resistance, leading to the higher NEFA level as seen in this study. At normal concentration, NEFA is a source of energy for β-cell. However, studies have shown that the presence of elevated level for prolonged period is toxic to the β-cell, causing decreased glucose induced insulin secretion [14], impaired insulin gene expression [15], and increased cell death [16]. This is called lipotoxicity, and is another cause of progressive decline in β-cell function leading to reduced insulin production seen in diabetes patients with poor glycaemic control.
In concordance with previous studies by Rivellese et al. [12] and Phillips et al. [7], this study also showed that glycemic control affect postprandial plasma glucose after a meal challenge, with statistically significant higher level seen in the poor glycemic control subjects. Many epidemiological studies such as the Chicago Heart Study [2] and DECODE study [3] have shown that plasma glucose 2 hours after an oral challenge with glucose is a powerful predictor of cardiovascular risk. Furthermore, STOP-NIDDM trial has provided data indicating that treating subjects with impaired glucose tolerance using acarbose, a compound that specifically reduced postprandial hyperglycemia, is associated with 49% reduction in cardiovascular event [4]. In this study, the significantly lower postprandial plasma glucose seen in the good glycemic control group would translate into reduction in cardiovascular risk, with subsequent decline in cardiovascular event and its associated mortality and morbidity.
In non-diabetic subjects, circulating TG showed pronounced elevation within an hour of meal ingestion and can remain elevated for 5 - 8 hours following consumption of a typical fat containing meal. The response of plasma TG to standard fat load is much greater in T2DM subjects, with delayed peak concentration at 4 - 6 hours after the fat load [17]. The result of this study also showed elevation in postprandial plasma TG in both groups, with delayed peak level at 4 hours after meal ingestion, although the difference between the 2 groups did not reach statistical significance.
Data from this study on postprandial TC, LDL-C, and HDL-C showed downward trend after the test meal, although the difference between the 2 groups were not statistically significant. This is similar to finding from Rivellese et al. [12], which showed decreased level in TC after the test meal. The increased in triglyceride-richlipoprotein (TRL) in postprandial state of T2DM patients lead to prolonged residence time of TRL in circulation. These favour the exchange of core lipids, mediated by cholesterol ester transfer protein ( CETP) , between both HDL-C and LDL-C with TRL, leading to triglyceride enrichment of both particles with less cholesterol content, causing the reduction in HDL-C and LDL-C seen the postprandial state.
Limitation of the study is that measurement of oxidative stress markers to support its role in the deterioration of β-cell function in diabetes patients with poor glycemic control was not done. Another limitation is the inability to accurately characterised postprandial lipid parameters such as the ApoB-48, ApoB-100, cholesterol, and triglyceride of chylomicron and very low density lipoprotein (VLDL) due to the unavailability of centrifugation machine.
Thus, future studies would aim at determining the ROS level in diabetes patients and comparing between the good and poor glycemic control patients. Establishing antioxidant enzyme level and comparing between both groups of patients would also be important in supporting the relationship between ROS and antioxidant in the pathophysiology of type 2 diabetes. In addition to that, possible study would involve accurate characterization of the different lipoprotein contributing to increased atherogenecity observed in diabetes dyslipidemia. Furthermore, study looking at the different enzymes involved in lipid metabolism such as lipoprotein lipase and cholesterol ester transfer protein would greatly improve knowledge in this area.
5. CONCLUSION
In conclusion, this study showed that good glycemic control improved first phase insulin response to a meal challenge, and is associated with significant lowering of postprandial plasma glucose. Glycemic control also affects postprandial NEFA after a standardised meal, where a significant lower level was observed in T2DM subjects with good glycemic control. T2DM is a progressive disease where the presence of chronic hyperglycemia and hyperlipidemia, among other things, are toxic to the β-cell and lead to declining insulin production and secretion. Achieving good glycemic control meant minimising the effect of glucotoxicity and lipotoxicity on the β-cell, thus preserving its function.
6. ACKNOWLEDGEMENTS
The authors wish to thank all staff in the pathology, endocrine, and central laboratories of Hospital Universiti Sains Malaysia for their help in the biochemical analysis, and to Clinical Trial Unit for the use of their facilities during the study. The authors also want to thank Prof Emeritus Mustaffa Bin Embong for his help during the study.
![]()
![]()
REFERENCES
- Taskinen, M.R. (2003) Diabetic dyslipidaemia: From basic research to clinical practice. Diabetologia, 46, 733- 749. doi:10.1007/s00125-003-1111-y
- Lowe, L.P., Liu, K., Greenland, P. et al. (1997) Diabetes, asymptomatic hyperglycemia, and 22-year mortality in black and white men: The Chicago heart association detection project in industry study. Diabetes Care, 20, 163- 169. doi:10.2337/diacare.20.2.163
- The DECODE Study Group, the European Diabetes Epidemiology Group. (1999) Glucose tolerance and mortality: Comparison of WHO and ADA diagnostic criteria. Lancet, 354, 617-621. doi:10.1016/S0140-6736(98)12131-1
- Chiasson, J.L., Josse, R.G., Gomis, R., Hanefeld, M., Karasik, A. and Laakso, M. (2003) The STOP-NIDDM Trial Research Group: Acarbose treatment and the risk of cardiovascular disease and hypertension in patients with impaired glucose tolerance: The STOP-NIDDM trial. Journal of the American Medical Association (JAMA), 290, 486-494. doi:10.1001/jama.290.4.486
- Bansal, S., Buring, J.E., Rifai, N., Mora, S., Sacks, F.M. and Ridker, P.M. (2007) Fasting compared with nonfasting triglycerides and risk of cardiovascular events in women. Journal of the American Medical Association (JAMA), 298, 309-316. doi:10.1001/jama.298.3.309
- Nordestgaard, B.G., Benn, M., Schnohr, P. and Tybjaerg-Hansen, A. (2007) Nonfasting triglycerides and risk of myocardial infarction, ischaemic heart disease, and death in men and women. Journal of the American Medical Association (JAMA), 298, 299-308. doi:10.1001/jama.298.3.299
- Phillips, C., Murugasu, G., Owens, D., Collins, P., Johnson, A. and Tomkin, G.H. (2000) Improved metabolic control reduces the number of postprandial apolipoprotein B-48-containing particles in type 2 diabetes. Atherosclerosis, 148, 283-291. doi:10.1016/S0021-9150(99)00275-0
- Turner, R.C., Cull, C.A., Frighi, V. and Holman, R.R. (1999) Glycaemic control with diet, sulfonylurea, metformin, or insulin in patients with type 2 diabetes mellitus: Progressive requirement for multiple therapies (UKPDS 49). UK Prospective Diabetes Study (UKPDS) Group. Journal of the American Medical Association (JAMA), 281, 2005-2012. doi:10.1001/jama.281.21.2005
- Matthews, D.R., Cull, R.A., Stratton, I.M., Holman, R.R. and Turner, R.C. (1998) UKPDS 26: Sulfonylurea failure in non-insulin-dependent diabetic patients over six years. UK Prospective Diabetes Study (UKPDS) Group. Diabetic Medicine, 15, 297-303. doi:10.1002/(SICI)1096-9136(199804)15:4<297::AID-DIA572>3.3.CO;2-N
- Robertson, P.R., Harmon, J., Tran, O.P., Tanaka, Y. and Takahashi, H. (2003) Glucose toxicity in β-cell: Type 2 diabetes, good radicals gone bad, and the glutathione connection. Diabetes, 52, 581-587. doi:10.2337/diabetes.52.3.581
- Tiege, M., Lortz, S., Munday, R. and Lenzen, S. (1998) Complementary action of antioxidant enzymes in the protention of bioengineered insulin-producing RINm5F cells against the toxicity of reactive oxygen species. Diabetes, 47, 1578-1585. doi:10.2337/diabetes.47.10.1578
- Rivellese, A.A., De Nalate, C., Di Marino, L., Patti, L., Iovine, C., Coppola, S., et al. (2004) Exogenous and endogenous postprandial lipid abnormalities in type 2 diabetic patients with optimal blood glucose control and optimal fasting triglyceride levels. Journal of Clinical Endocrinology and Metabolism, 89, 2153-2159. doi:10.1210/jc.2003-031764
- Valabhji, J. and Elkeles, R.S. (2003) Dyslipidemia in type 2 diabetes: Epidemiology and biochemistry. The British Journal of Diabetes and Vascular Disease, 3, 184-189.
- Zhou, Y.P. and Grill, V. (1995) Long term exposure to fatty acids and ketones inhibits B-cell function in human pancreatic islets of Langerhans. Journal of Clinical Endocrinology and Metabolism, 80, 1584-1590. doi:10.1210/jc.80.5.1584
- Briaud, I., Harmon, J.S., Kelpe, C.L., Segu, V.B. and Poitout, V. (2001) Lipotoxicity of the pancreatic B-cell is associated with gliucose—Dependent esterification of fatty acids into neutral lipids. Diabetes, 50, 315-321. doi:10.2337/diabetes.50.2.315
- Maedler, K., Spinas, G.A., Dyntar, D., Moritz, W., Kaiser, N. and Donath, M.Y. (2000) Distincts effects of saturated and monosaturated fatty acids on b-cell turnover and function. Diabetes, 50, 69-76. doi:10.2337/diabetes.50.1.69
- Kahn, S.E. (2001) The Importance of β-cell failure in the development and progression of type 2 diabetes: Clinical review. Journal of Clinical Endocrinology and Metabolism, 86, 4047-4058. doi:10.1210/jc.86.9.4047
NOTES
*Author disclosures: N. Yahaya, W. M. Kyi, N. Mohd Noor, W. M. Wan Bebakar, no conflict of interest.
Grant Support (from Universiti sains Malaysia): RU Grant 1001/ PSSP/812044.