Journal of Diabetes Mellitus
Vol.1 No.4(2011), Article ID:8416,8 pages DOI:10.4236/jdm.2011.14011
Urinary corticosterone and normetanephrine levels after voluntary wheel and forced treadmill running in the db/db mouse
![]()
1Department of Physiology, Laboratory of Diabetes and Exercise Metabolism, Midwestern University, Glendale, USA; *Corresponding Author: tbrode@midwestern.edu
2Department of Biomedical Sciences, College of Health Sciences, Midwestern University, Glendale, USA.
Received 26 August 2011; revised 30 September 2011; accepted 10 October 2011.
Keywords: Diabetes; Db/Db; Treadmill; Stress;Corticosterone; Normetanephrine
ABSTRACT
Exercise is recommended for the treatment of type 2 diabetes because of its benefits on body weight and glycemic control. Our recent work using the db/db mouse, a model that mimics the phenotype of type 2 diabetes, demonstrated that forced treadmill training exerted detrimenttal effects on obesity, hyperglycemia and insulin resistance. We investigated whether this response is explained by increased corticosterone and norepinephrine secretion, measured as urinary byproducts, since these hormones are known to alter glucose homeostasis. Male db/db mice and lean littermates serving as controls, were assigned to sedentary, voluntary wheel, and forced treadmill training groups for a period of 5 weeks. After 5 weeks of treadmill running, db/db mice remained hyperglycemic compared to sedentary db/db mice and were hyperinsulinemic compared to db/db voluntary runners. Urine glucose and corticosterone levels were also highest in db/db treadmill runners compared to all groups. Urine normetanephrine levels, although lower in db/db mice compared to control mice, were increased after treadmill running. Our results indicate that treadmill running leads to perturbations in plasma levels of hormones associated with glucose homeostasis. A greater stress response may be invoked by treadmill training, worsening glycemic control in this model of type 2 diabetes.
1. INTRODUCTION
Regular exercise is recommended for the treatment of diabetes mellitus because of its beneficial effects on obesity, glucose tolerance and insulin sensitivity. Epidemiological studies have shown that an active lifestyle to control these factors is pivotal in reducing the risk of major cardiovascular complications associated with diabetes such as myocardial infarction, stroke, and microvessel related diseases [1,2]. The benefits of exercise in the regulation of glucose metabolism and prevention of cardiovascular events have been well-established in the diet-induced and spontaneous insulin resistant models of type 2 diabetes [3-7]. However, recent evidence using the db/db mouse model of diabetes to investigate the impact of exercise training on glycemic control revealed unexpected and conflicting results [8].
The db/db mouse is a model of type 2 diabetes characterized by obesity, hyperglycemia and insulin resistance owing to a mutation in the leptin receptor gene. It is considered to be a close counterpart to the human condition [9]. Exercise training decreases lipid accumulation and vascular dysfunction in this model of diabetes [10,11]. However, convincing evidence suggests that benefits of exercise on other risk factors appear to be dependent on the type of exercise performed and the intensity of exercise sessions [12]. Interestingly, increased exercise intensity does not always correlate with greater weight loss and better metabolic control. We and others have shown that forced treadmill running, at moderate intensity, failed to reduce the obesity and hyperglycemia compared to a low intensity voluntary wheel running training regimen [8,11]. This finding indicates that the forced treadmill exercise paradigm may produce unfavorable physiological responses in the db/db mouse.
While forced treadmill running has positive gains on cardiovascular and metabolic function, it also results in short-term stresses with negative outcomes such as suppressed lymphocyte proliferation, adrenal gland hypertrophy [13], and disruption of the hypothalamus pituitaryadrenal (HPA) axis. In support of this association, daily forced exercise is associated with increased cortisol secretion, insulin resistance and increased plasma renin activity in the obese hyperinsulinemic rabbit [13-17]. Forced treadmill exercise may induce aberrations in the HPA axis and sympathetic nervous system in the db/db mouse, leading to an exaggerated release of corticosteroids and norepinephrine, respectively. This would be a reasonable response to expect as adrenal gland hypertrophy and enhanced endogenous glucocorticoid synthesis are reported in the genetically obese and db/db models [18,19]. Further support for this adverse outcome is the observation that excessive norepinephrine secretion in response to acute exercise has been shown in hypertensive and non-hypertensive type 2 diabetic patients [20, 21].
Therefore, the present study was designed to investigate the effects of voluntary and forced treadmill running on urine corticosterone and normetanephrine concentrations in the db/db mouse. We hypothesize that treadmill running, by inducing a stress response, elicits a greater release of corticosterone and norepinephrine into systemic circulation, thereby exacerbating glucose control in the db/db model of diabetes.
2. MATERIALS AND METHODS
2.1. Mouse Model of Diabetes
The Midwestern University Research and Animal Care Committee approved this study. All animals used in this study were cared in accordance to the recommendations in The Guide for the Care and Use of Laboratory Animals, National Institute of Health, Publ. No. 85-23, 1986. Diabetic mice of the C57BL/KsJ strain were obtained from Jackson Laboratories (Bar Harbor, Me) and studied at the age of 4 weeks. The C57BL/KsJ-leptdb- leptdb strain contains two mutant copies of the leptin receptor gene (db+/db+), inducing a gradual onset of obesity, hyperglycemia, and subsequent hyperinsulinemia. This model also exhibits increased endogenous production of glucocorticoids [18,19]. The lean littermates, which possess one mutant and one normal copy of the leptin gene (db/+), were used as the control groups. Mice were provided with food and water ad libidum and maintained in a room with an alternating twelve hour light/dark cycle.
2.2. Exercise Training Protocol
The A total of 48 mice were used in this study. db/db (D) and lean (L) mice were randomly assigned to the following groups: sedentary (DS, n = 6; LS, n = 6), voluntary wheel running (DV, n = 6; LV, n = 6), and forced treadmill running (DT, n = 6; LT, n = 6). A separate group of age-matched db/db (n = 6) and lean mice (n = 6) not subjected to the experimental conditions described below were used to determine the plasma profile. DV and LV mice assigned were housed individually in cages (30.3 × 20.6 × 26 cm) equipped with digital magnetic counters to monitor daily running activity (Mini Mitter, Bend, Oregon) 6 days per week for a period of 5 weeks. DT and DV mice performed moderate intensity exercise 6 days per week on an electrically driven treadmill (Columbus Instruments, Ohio) also for a period of 5 weeks, based on a protocol used previously [8]. The training regimen for this group consisted of a graded increase in exercise duration and intensity as follows: 10 min at 6.5 m/min for week 1; 15 min at 8.5 m/min in week 2, 20 min at 10m/min in week 3, 30 min at 12 m/min in week 4, and 30 min at 15 m/min in week 5 for a total distance of 7.12 km.
2.3. Urine Collection, Food Intake and Blood Sampling
Mice from each group were placed in individual metabolic cage systems (Mini Mitter, Bend, OR) between 8:00 and 9:00 am during the final week of study for a 24-hour period for the collection of urine. Urine samples were collected and immediately stored at –80˚C for later measurement of corticosterone, normetanephrine and glucose. Measurement of food intake was recorded beginning on week 2 and performed weekly until the end of the study. At the end of the exercise training period, overnight-fasted mice were sacrificed between 9:00 am and 11:00 am 48 hours after the last exercise session. This 48-hour period was selected to eliminate any effect exercise many have on insulin sensitivity and the metabolic parameters measured [22]. Non-anesthetized mice were kept warm on a heating pad for a period of 30 minutes before blood was obtained from a submandibular vein puncture. Blood was collected, centrifuged at 3000 rpm for 5 minutes at 4˚C, and plasma was stored at –80˚C for subsequent measurement of glucose and insulin concentrations. Mice were immediately sacrificed by cervical dislocation.
2.4. Measurement of Plasma and Urine Metabolites
Urine glucose and plasma glucose concentrations were determined using colorimetric assay kits (Wako Chemicals USA, Richmond, VA). Plasma insulin and urine normetanephrine concentrations were measured using an ultrasensitive mouse ELISA kits (Alpco Diagnostics, Salem, NH). Urine corticosterone concentrations were measured using an ultrasensitive mouse immunoassay kit (Cayman Chemical, Ann Arbor, MI).
2.5. Statistical Analysis
All values are presented as mean ± SEM. ANOVA, followed by a Tukey-Kramer comparison for post hoc analysis, was performed to determine differences in plasma and urine concentrations after exercise training, and to locate differences in food intake between groups during exercise training. A one-way repeated measured ANOVA followed by a Tukey-Kramer comparison for post hoc analysis was used to determine differences within groups for voluntary running activity and food intake. The Student’s unpaired and paired t-test was used to compare all other data. Results with p < 0.05 were considered statistically significant.
3. RESULTS
3.1. Body Weight and Plasma Metabolites
Selected plasma characteristics consistent with the db/ db mouse model of type 2 diabetes are shown in Table 1. Body weight, plasma levels of glucose, insulin, and corticosterone were significantly higher in db/db mice compared with lean mice. There were no differences in plasma levels of NEFA between db/db and lean mice.
3.2. Voluntary Wheel Running Activity
Voluntary running wheel activity expressed as weekly averages in kilometers over the 5-week period of training is illustrated in Figure 1. Significant changes in running activity were observed at 2 weeks (P < 0.05) in DV mice and at 3 weeks (P < 0.01) in LV mice compared with week 1. Throughout the entire period, however, running activity was consistently lower in DV mice compared with LV mice.
3.3. Food Intake
Food intake is shown in Table 2. At week 2, food intake was increased (P < 0.05) in DS and DV mice compared with LS and LT mice. Food intake at week 3 was
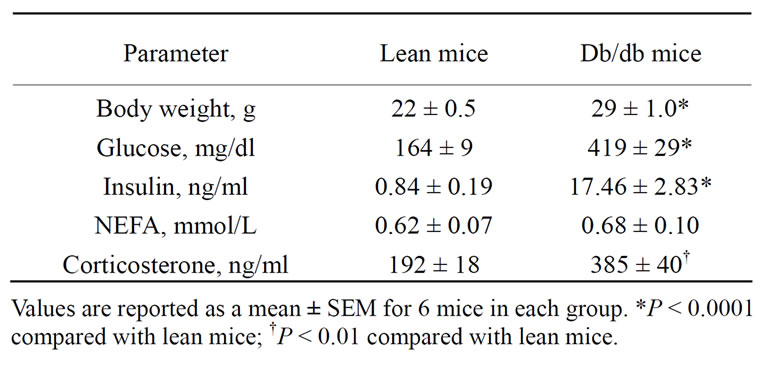
Table 1. Selected plasma parameters and hormones in lean and db/db mice.

Figure 1. Running activity in lean and db/db mice during the 5-week training period. Values are reported as a mean ± SEM for 6 mice in each group. *P < 0.05, compared with lean mice. †P < 0.05, compared with week 1. ‡P < 0.001, compared with week 1.

Table 2. The effects of voluntary wheel and treadmill running on food intake in lean and db/db mice.
also increased in DS and DV compared with LS (P < 0.01) and LT (P < 0.05) mice. During this same period, food intake was lower in DT mice compared with DS (P < 0.05, week 2; P < 0.01, week 3) and DV (P < 0.01, week 2; P < 0.001, 3) mice. At weeks 4 and 5, there were no differences in food take between groups or with exercise training. However, food intake was higher in DT mice at week 4 compared with weeks 2 and 3 (P < 0.05).
3.4. Body Weight and Weight Gain
Body weight and weight gain in lean and db/db mice are shown in Table 3" target="_self"> Table 3. Throughout the 5-week period, body weight was significantly (P < 0.001) higher in all groups of db/db mice compared to lean mice.

Table 3. The effects of voluntary wheel and treadmill running on body weight in lean and db/db mice.
There were no differences in body weight between LS, LV and LT mice, as well as between DS, DV, and DT mice. However, following exercise training, body weight of DT mice was higher compared with DV mice (P < 0.05). Weight gain in db/db mice was 2- to 3-times greater compared to lean mice over the 5-week period. Interestingly, weight gain was lower (P < 0.05) in DV mice compared with DS mice db/db mice, but was significantly higher (P < 0.01) in DT compared to DV mice.
3.5. Plasma Glucose, Insulin and Urine Glucose Levels
Plasma glucose concentrations are shown in Figure 2.

Figure 2. Effects of voluntary wheel and treadmill running on plasma glucose concentrations in lean and db/db mice. Values are reported as a mean ± SEM for 6 mice in each group. *P < 0.001, compared with db/db mice.
As expected, plasma glucose levels were increased (P < 0.001) by the diabetic state. No differences in plasma glucose levels were observed within groups, regardless of the form of exercise training.
Concentrations of plasma insulin levels are illustrated in Figure 3" target="_self"> Figure 3. Insulin levels were also increased (P < 0.001) by the diabetic state. However, insulin levels were decreased in DV mice compared with DS mice (7.18 ± 1.39 vs 3.89 ± 1.27 ng/ml, P < 0.05), and were increased in DT mice compared with DV mice (3.89 ± 1.27 vs 9.37 ± 1.69 ng/ml, P < 0.01). No change in insulin levels were observed in lean mice with exercise training.
Urine glucose concentrations are illustrated in Figure 4. Urine glucose concentrations were increased (P < 0.001) in db/db mice compared with lean mice. No differences in urine glucose concentrations were seen between LS, LV, and LT mice.
However, urine glucose levels were altered by exercise training in db/db mice. Urine glucose levels were highest in DT mice compare with DS (P < 0.05) and DV (P < 0.001) mice.
3.6. Urine Corticosterone and Normetanephrine Levels
Figure 5 shows that urine corticosterone levels were not altered by exercise training in lean mice. However, the highest levels of urine corticosterone levels were observed in DT mice compared with all other groups. Corticosterone levels were increased in DT mice compared with DS (820 ± 226 vs 294 ± 37 pg/ml, P < 0.05) and DV (820 ± 226 vs 241 ± 96 pg/ml, P < 0.01) mice.

Figure 3. Effects of voluntary wheel and treadmill running on plasma insulin concentrations in lean and db/db mice. Values are reported as a mean ± SEM for 6 mice in each group. *P < 0.05, †P < 0.01, ‡P < 0.001, significant between group(s) where indicated.

Figure 4. Effects of voluntary wheel and treadmill running on urine glucose concentrations in lean and db/db mice collected during a 24-hour period. Values are reported as a mean ± SEM for 6 mice in each group. *P < 0.05, †P < 0.001, significant between group(s) where indicated.

Figure 5. Effects of voluntary wheel and treadmill running on urine corticosterone concentrations in lean and db/db mice. Values are reported as a mean ± SEM for 6 mice in each group. *P < 0.05, †P < 0.01, significant between group(s) where indicated.
As shown in Figure 6, urine normetanephrine levels were decreased (P < 0.01) by the diabetic state. Urine normetanephrine levels were significantly higher in DT mice compared with DS mice (3.65 ± 0.37 vs 2.71 ± 0.11 ng/ml, P < 0.05). However, there were no differences in urine normetanephrine levels between LS, LV, and LT mice.
4. DISCUSSION
While several studies have investigated the effects of exercise training on glucose regulation in the diet-induced or spontaneous insulin resistant rat model [3-7],
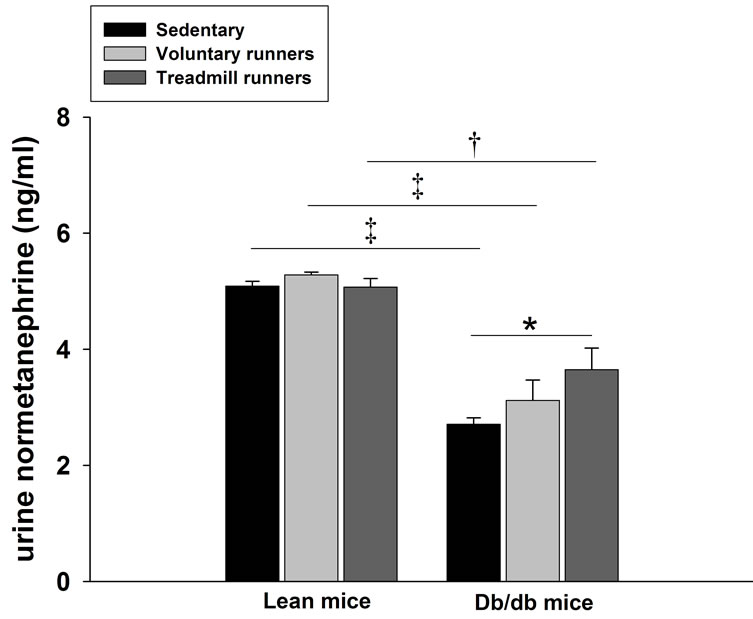
Figure 6. Effects of voluntary wheel and treadmill running on urine normetanephrine concentrations in lean and db/db mice. Values are reported as a mean ± SEM for 6 mice in each group. *P < 0.05, †P < 0.01, ‡P < 0.001, significant between group(s) where indicated.
far less attention has been given to explore the impact of exercise training in the db/db mouse. This model is associated with the metabolic disturbances commonly associated with type 2 diabetes, occurring secondary to defective leptin signaling [9,23]. We have recently demonstrated that forced treadmill exercise training, compared to voluntary wheel running, aggravated the metabolic state in this model [8]. Although mice subjected to forced treadmill running underwent a high volume of training, this exercise regimen failed to reduce the hyperglycemia, hyperinsulinemia, and obesity. We believe that forced treadmill running likely presented a stress response overriding any beneficial effects of exercise. The present study was designed to further explore the role of glucocorticoids and norepinephrine as a potential mechanism for this response in the db/db mouse. Our results demonstrate that voluntary wheel running reduced weight gain and insulin levels in diabetic mice, whereas diabetic mice subjected to treadmill running exhibited the greatest weight gain, remained hyperglycemic and had the highest urine glucose concentrations compared to sedentary mice. Our main results indicate that these changes were accompanied by a greater stress-related corticosterone and normetanephrine response compared to voluntary wheel running.
Increased endogenous synthesis of glucocorticoids is linked to insulin resistance and increased hepatic gluconeogenesis, and excess production of glucocorticoids is related, in part, to the development of hyperglycemia in the db/db mouse [18,24]. The observation that forced treadmill running exacerbated insulin resistance suggests that corticosterone secretion would be elevated in the db/db mouse [8]. Indeed, levels of corticosterone in urine levels were the highest in db/db mice following treadmill running compared to all other groups studied. The finding that these mice remained hyperinsulinemic and exhibited the greatest glucosuria provides evidence that treadmill running exacerbates metabolic control in these mice. Our results are supported by the observation that the stress induced by forced treadmill running was associated with disruption of the HPA axis and hypertrophy of the adrenal glands in the obese hyperinsulinemic rabbit [13].
Excessive secretion of norepinephrine with repetitive forced exercise training would be expected to worsen the diabetic state by enhancing hepatic gluconeogenesis and glycogenolysis [20], and by increasing glucocorticoid synthesis through catecholaminergic pathways [25]. Interestingly, our results reveal that diabetic mice had decreased urinary normetanephrine levels compared to lean littermates, which is consistent with the development of autonomic neuropathy in mice with defective leptin signaling. The presence of abnormal nervous system morphology consistent with neuropathy has been reported in the 20-week old db/db mouse [26], and the shift toward smaller fiber diameter and lack of axonal growth cone extension can be partially reversed by leptin treatment [27]. The ob/ob mouse also displays signs of peripheral neuropathy as early as 11 weeks of age, exemplified by deficiencies in sciatic and digital nerve conduction velocity [28]. Reports have shown that idiopathic and diabetic autonomic neuropathies are associated with low plasma concentrations of catecholamines [29], and obese patients without impaired glucose control exhibit a reduced catecholamine response to intense exercise [30]. Despite reduced urinary normetanephrine levels in db/db mice, forced treadmill running was associated with increased normetanephrine levels compared to sedentary mice. Increased urine normetanephrine can be attributed to greater sympathetic output and increased adrenal phenylethanolamine N-methyltransferase synthesis from corticosterone with treadmill running [31].
Food intake, appetite suppression, and regulation of energy balance are partly controlled by the anorexigenic hormone leptin. Administration of leptin to leptin-deficient mice effectively induces satiety and reduces food intake, controlling obesity [32]. In the db/db mouse, normal regulation of satiety is disrupted from a mutation in the leptin receptor gene, resulting in increased food intake and obesity. Increased physical activity and excess glucocorticoid production typically induce a hyperphagic response in the db/db mouse [33,34]. Our data show that food intake was transiently decreased in db/db mice subjected to treadmill running compared to sedentary mice during the first 3 weeks of training. The reason for this behavior remains unclear because exercise generally stimulates both insulin and leptin signaling in hypothalamus, even in the presence of glucocorticoid treatment [35]. Because the db/db mouse is hyperinsulinemic and hyperleptinemic, it is possible that treadmill running further induced resistance to these peptides contributing to this anorexigenic effect. Diabetes-related complications should not be ruled out and in fact, diabetic gastroparesis is associated with early satiety and loss of appetite in the ob/ob mouse [36], and alterations in the ghrelin-to-obestatin ratio and neurohumoral-intestinal axis are known to occur in type 2 diabetes [37].
5. CONCLUSIONS
In conclusion, we report clear differences between voluntary wheel and forced treadmill exercise training on indices of stress in the db/db mouse. Forced exercise training was associated with greater corticosterone and normetanephrine production compared to voluntary running, which could explain why the metabolic state of db/db mice was further aggravated by this exercise paradigm. The causes leading to this maladaptative response are unknown and care should be taken in the interpretation of our results. Leptin treatment in the leptin-deficient ob/ob mice stimulates greater ambulation, energy expenditure, and wheel running [38]. Leptin may be a significant physiological regulator of activity in mouse models of defective leptin signaling.
6. ACKNOWLEDGEMENTS
This study was supported by grants from the Graduate Education Program and Midwestern University Office of Research and Sponsored Programs (TLB).
REFERENCES
- Boule, N.G., Haddad, E., Kenny, G.P., Wells, G.A. and Sigal, R.J. (2001) Effects of exercise on glycemic control and body mass in type 2 diabetes mellitus: A meta-analysis of controlled clinical trials. Journal of the American Medical Association, 286, 1218-1227. doi:10.1001/jama.286.10.1218
- Tuomilehto, J., Lindstrom, J., Eriksson, J.G., Valle, T.T., Hamalainen, H., Ilanne-Parikka, P., et al. (2001) Prevention of type 2 diabetes mellitus by changes in lifestyle among subjects with impaired glucose tolerance. New England Journal of Medicine, 344, 1343-1350. doi:10.1056/NEJM200105033441801
- Cortez, M.Y., Torgan, C.E., Brozinick, J.T. Jr. and Ivy, J.L. (1991) Insulin resistance of obese Zucker rats exercise trained at two different intensities. American Journal of Physiology Endocrinology and Metabolism, 261, E613-E619.
- Banks, E.A., Brozinick, J.T. Jr., Yaspelkis, B.B. III, Kang, H.Y. and Ivy, J.L. (1992) Muscle glucose transport, GLUT-4 content, and degree of exercise training in obese Zucker rats. American Journal of Physiology, 263, E1010-E1015.
- Brozinick, J.T. Jr., Etgen, G.J. Jr., Yaspelkis, B.B. III, Kang, H.Y. and Ivy, J.L. (1993) Effects of exercise training on muscle GLUT-4 protein content and translocation in obese Zucker rats. American Journal of Physiology Endocrinology and Metabolism, 265, E419-E427.
- Podolin, D.A., Wei, Y. and Pagliassotti, M.J. (1999) Effects of a high-fat diet and voluntary wheel running on gluconeogenesis and lipolysis in rats. Journal of Applied Physiology, 86, 1374-1380.
- Davidoff, A.J., Mason, M.M., Davidson, M.B., Carmody, M.W., Hintz, K.K., Wold, L.E., et al. (2004) Sucroseinduced cardiomyocyte dysfunction is both preventable and reversible with clinically relevant treatments. American Journal of Physiology Endocrinology and Metabolism, 286, E718-E724. doi:10.1152/ajpendo.00358.2003
- Sennott, J., Morrissey, J., Standley, P.R. and Broderick, T.L. (2008) Treadmill exercise training fails to restore defects in glucose, insulin and muscle glut4 content in the db/db mouse model of diabetes. Pathophysiology, 15, 173-179. doi:10.1016/j.pathophys.2008.06.001
- Leibel, R.L., Chung, W.K. and Chua, S.C. Jr. (1997) The molecular genetics of rodent single gene obesities. Journal of Biological Chemistry, 272, 31937-31940. doi:10.1074/jbc.272.51.31937
- Esser, K.A., Su, W., Matveev, S., Wong, V., Zeng, L., McCarthy, J.J., et al. (2007) Voluntary wheel running ameliorates vascular smooth muscle hyper-contractility in type 2 diabetic db/db mice. Applied Physiology Nutrition and Metabolism, 32, 711-720. doi:10.1139/H07-058
- Moien-Afsahri, F., Ghosh, S., Elmi, S., Rahman, M.M., Sallam, N., Khazaei, M., Kieffer, T.J., et al. (2008) Exercise restores endothetial function independently of weight loss or hyperglycemic status in db/db mice. Diabetologia, 51, 1327-1337. doi:10.1007/s00125-008-0996-x
- Ghosh, S., Golbidi, S., Werner, I., Verchere, B. and Laher, I. (2010) Selecting exercise regimens and strains to modify obesity and diabetes in rodents: An overview. Clinical Science, 119, 57-74. doi:10.1042/CS20090389
- Moraska, A., Deak, T., Spencer, R.L., Roth, D. and Fleshner, M. (2000) Treadmill running produces both positive and negative physiological adaptations in Sprague-Dawley rats. American Journal of Physiology Regulatory Integrative and Comparative Physiology, 279, R1321-R1329.
- Tharp, G.D. (1975) The role of glucocorticoids in exercise. Medicine in Science and Sports, 7, 6-11. doi:10.1249/00005768-197500710-00003
- Rosmond, R., Dallman, M.F. and Bjorntorp, P. (1998) Stress-related cortisol secretion in men: Relationships with abdominal obesity and endocrine, metabolic and hemodynamic abnormalities. Journal of Clinical Endocrinology and Metabolism, 83, 1853-1859. doi:10.1210/jc.83.6.1853
- Rosmond, R. (2003) Stress induced disturbances of the HPA axis: A pathway to type 2 diabetes? Medical Science Monitor, 9, RA35-RA39.
- Carroll, J.F. and Kyser, C.K. (2002) Exercise training in obesity lowers blood pressure independent of weight change. Medicine in Science Sports and Exercise, 34, 596-601.
- Naeser, P. (1976) Adrenal function in the diabetic mutant mouse (gene symbol dbm). Acta Physiologica Scandinavia, 98, 395-399. doi:10.1111/j.1748-1716.1976.tb10327.x
- Coleman, D.L. and Burkart, D.L. (1977) Plasma corticosterone concentrations in diabetic (db) mice. Diabetologia, 13, 25-26. doi:10.1007/BF00996323
- Kjaer, M., Hollenbeck, C.B., Frey-Hewitt, B., Galbo, H., Haskell, W. and Reaven, G.M. (1990) Glucoregulation and hormonal responses to maximal exercise in non-insulin-dependent diabetes. Journal of Applied Physiology, 68, 2067-2074.
- Raber, W., Raffesberg, W., Waldhäusl, W., Gasic, S. and Roden, M. (2003) Exercise induces excessive normetanephrine responses in hypertensive diabetic patients. European Journal of Clinical Investigation, 33, 480-487. doi:10.1046/j.1365-2362.2003.01155.x
- James, D.E., Burleigh, K.M., Kraegen, E.W. and Chisholm, D.J. (1983) Effect of acute exercise and prolonged training on insulin response to intravenous glucose in vivo in rat. Journal of Applied Physiology, 55, 1660- 1664.
- Bray, G.A. and York, D.A. (1997) Clinical review 90: Leptin and clinical medicine: A new piece in the puzzle of obesity. Journal of Clinical Endocrinology and Metabolism, 82, 2771-2776. doi:10.1210/jc.82.9.2771
- Wang, X., Hu, Z., Hu, J., Du, J. and Mitch, W.E. (2006) Insulin resistance accelerates muscle protein degradation: Activation of the ubiquitin-proteasome pathway by defects in muscle cell signaling. Endocrinology, 147, 4160- 4168. doi:10.1210/en.2006-0251
- Cunningham, E.T. Jr. and Sawchenko, P.E. (1988) Anatomical specificity of noradrenergic inputs to the paraventricular and supraoptic nuclei of the rat hypothalamus. Journal of Comparative Neurology, 274, 60-76. doi:10.1002/cne.902740107
- Robertson, D.M. and Sima, A.A. (1980). Diabetic neuropathy in the mutant diabetic mouse [C57BL/ks(db/db)]: A morphometric study. Diabetes, 29, 60-67. doi:10.2337/diabetes.29.1.60
- Valerio, A., Ghisi, V., Dossena, M., Tonello, C., Giordano, A., Frontini, A., et al. (2006) Leptin increases axonal growth cone size in developing mouse cortical neurons by convergent signals inactivating glycogen synthase kinase-3β. Journal of Biological Chemistry, 281, 12950- 12958. doi:10.1074/jbc.M508691200
- Drel, V.R., Mashtalir, N., IInytska, O., Shin, J., Li, F., Lyzogubov, V.V., et al. (2006) The leptin-deficient (ob/ob) mouse: A new animal model of peripheral neuropathy of type 2 diabetes and obesity. Diabetes, 55, 3335-3343. doi:10.2337/db06-0885
- Hilsetd, J. (1995) Catecholamines and diabetic autonomic neuropathy. Diabetic Medicine, 12, 296-297. doi:10.1111/j.1464-5491.1995.tb00479.x
- Vettor, R., Macor, C., Rossi, E., Liemonte, G. and Ferderspil, G. (1997) Impaired counterregulatory and metabolic response to exhaustive exercise in obese subjects. Acta Diabetologica, 34, 61-66. doi:10.1007/s005920050068
- Wong, D.L. (2006) Epinephrine biosynthesis: Hormonal and neural control during stress. Cellular and Molecular Neurobiology, 26, 891-900. doi:10.1007/s10571-006-9056-6
- Cowley, M.A., Smart, J.L., Rubinstein, M., Cerdán, M.G., Diano, S., Horvath, T.L., et al. (2001) Leptin activates anorexigenic POMC neurons through a neural network in the arcuate nucleus. Nature, 411, 480-484. doi:10.1038/35078085
- Tataranni, P.A., Larson, D.E., Snitker, S., Young, J.B., Flatt, J.P. and Ravussin, E. (1996) Effects of glucocorticoids on energy metabolism and food intake in humans. American Journal of Physiology Endocrinology and Metabolism, 271, E317-E325.
- Uchoa, E.T., Sabino, H.A., Ruginsk, S.G., Antunes-Rodrigues, J. and Elias, L.L. (2009) Hypophagia induced by glucocorticoid deficiency is associated with an increased activation of satiety-related responses. Journal of Applied Physiology, 106, 595-604.
- Park, S., Jang, J.S., Jun, D.W. and Hong, S.M. (2005) Exercise enhances insulin and leptin signaling in the cerebral cortex and hypothalamus during dexamethazone-induced stress in diabetic rats. Neuroendocrinology, 82, 282-293. doi:10.1159/000093127
- Asakawa, A., Ueno, N., Katagi, M., Ijuin, Y., Morita, Y., Mizuno, S., et al. (2006) Mosapride improves food intake, while not worsening glycemic control and obesity, in ob/ob obese mice with decreased gastric emptying. Journal of Diabetes and Complications, 20, 56-58. doi:10.1016/j.jdiacomp.2005.04.001
- Harsch, I.A., Koebnick, C., Tasi, A.M., Hahn, E.G. and Konturek, P.C. (2009) Ghrelin and obestatin levels in type 2 diabetic patients with and without delayed gastric emptying. Digestive Diseases and Sciences, 54, 2161- 2166. doi:10.1007/s10620-008-0622-2
- Morton, G.J., Kaiyala, K.J., Fisher, J.D., Ogimoto, K., Schwartz, M.W. and Wisse, B.E. (2011) Identification of a physiological role for leptin in the regulation of ambulatory activity and wheel running in mice. American Journal of Physiology Endocrinology and Metabolism, 300, E392-E401. doi:10.1152/ajpendo.00546.2010