Journal of Sensor Technology
Vol.06 No.03(2016), Article ID:69662,19 pages
10.4236/jst.2016.63003
Optimization of DNA Staining Technology for Development of Autonomous Microbe Sensor for Injection Seawater Systems
Mohammed A. Al-Moniee1*, Xiangyang Zhu1, Lone Tang2, Susanne Juhler2, Fuad I. Nuwaiser1, Peter F. Sanders1, Fahad N. Al-Abeedi1
1Saudi Arabian Oil Company (Saudi Aramco), Dhahran, Saudi Arabia
2Danish Technological Institute (DTI), Aarhus, Denmark

Copyright © 2016 by authors and Scientific Research Publishing Inc.
This work is licensed under the Creative Commons Attribution International License (CC BY 4.0).
http://creativecommons.org/licenses/by/4.0/


Received: June 22, 2016; Accepted: August 8, 2016; Published: August 11, 2016
ABSTRACT
Microbial activity in the water injection system in oil and gas industry leads to an array of challenges, including biofouling, injectivity loss, reservoir plugging, and microbiologically influenced corrosion (MIC). An effective mitigation strategy requires online and real-time monitoring of microbial activity and growth in the system so that the operators can apply and adjust counter-measures quickly and properly. The previous study [1] identified DNA staining technology-with PicoGreen and SYBR Green dyes―as a very promising method for automated, online determination of microbial cell abundance in the vast Saudi Aramco injection seawater systems. This study evaluated DNA staining technology on detection limit, automation potential, and temperature stability for the construction of automated sensor prototype. DNA staining with SYBR Green dye was determined to be better suited for online and real-time monitoring of microbial activity in the Saudi Aramco seawater systems. SYBR Green staining does not require sample pre-treatment, and the fluorescence signal intensity is more stable at elevated temperatures up to 30˚C. The lower detection limit of 2 × 10³/ml was achieved under the optimized conditions, which is sufficient to detect microbial numbers in Saudi Aramco injection seawater. Finally, the requirements for design and construction of SYBR-based automated sensor prototype were determined.
Keywords:
DNA Staining, Fluorescence Detection, Automated Monitoring, Real-Time Detection, Microbial Sensor Prototype, Injection Water

1. Introduction
Microbial activity is the cause of a variety of problems in water injection systems, e.g., microbiologically influenced corrosion (MIC), system or reservoir plugging, and biofouling [2] [3] . Therefore, monitoring of microbial growth and activity is a cornerstone in any mitigation strategy, enabling operators to apply and adjust counter-measures quickly and properly. In the oil industry, the microbial number and activity are traditionally monitored with conventional growth methods that require manual sampling and handling [4] - [8] . Saudi Arabian Oil Company (Saudi Aramco) has the largest water injection system in the world. An online and real-time microbial monitoring technology, suitable for the harsh environmental conditions in Saudi Arabia, is needed in order to guarantee the continued high quality of the water in the company’s seawater injection pipelines and at remote injection wells.
In the proof of concept study [1] , five single-analyte methods were evaluated in the laboratory setup for the suitability of automation, for detection of microbial activity in the Saudi Aramco injection seawater system. Staining of cells with DNA binding fluorescent dyes (PicoGreen and SYBR Green) followed by quantification of fluorescence signals was identified as a reliable single-analyte method, with a very promising potential for automated, online determination of microbial cell abundance in the injection seawater system. PicoGreen dye is very sensitive to double-stranded DNA (dsDNA), yielding high signal intensity with low background levels [9] [10] . But the dye is less tolerant to the Saudi Aramco injection seawater conditions as the stain fades fast in highly saline environments [11] - [13] , and the fluorescence signal decreases if pH is above 8 or below 7 [13] . SYBR Green is a less sensitive dye to dsDNA than PicoGreen [14] [15] , but it is more tolerant to the Saudi Aramco system conditions [16] [17] .
The objective of the current study is to optimize the DNA staining technology for the design of a robust and automated sensor prototype for real-time monitoring of the microbial load and activity in the vast Saudi Aramco injection seawater system. The study covers:
Optimizing DNA staining technology.
Simplifying the DNA staining procedure to overcome technical barriers for technology automation.
Testing the temperature stability of the DNA staining technology to determine the requirements for temperature control in the sensor prototype.
Developing design specifications and requirements for the automated sensor prototype.
2. Experimental Approaches
The DNA staining technology for automated detection of biomass has to be optimized and simplified to work under the typical conditions in Saudi Aramco seawater injection system and Saudi Arabia desert environment.
Salinity of the injection seawater is approximately at 5.5%.
pH of the injection seawater is between 6.8 and 7.5.
Biocides are injected once a week for 1 - 2 hours to minimize microbial growth.
The injection seawater contains approximately 600 - 1000 particles/ml larger than 2 µm.
Temperature in the dessert ranges from 5˚C to 53˚C.
The temperature of the injection seawater varies from 15˚C to 49˚C.
In our previous study, the DNA staining technology using PicoGreen and SYBR Green dyes was successfully applied for quantification of bacterial cells in high saline (5.5%) seawater with detection limit at 106 cells/ml and 104 cells/ml, respectively [1] . To clarify how low a detection limit is needed to obtain a successful sensor-based monitoring system, injection seawater samples were collected and analyzed to determine the baseline bacterial load using quantitative polymerase chain reaction (qPCR) method [8] and/or most probable number (MPN) tests [4] [6] . qPCR, a culture-independent genetic technique, targets 16S rRNA genes for the detection and quantification of total bacteria using Rotor-Gene Q real-time PCR cycler and QuantiTect Probe PCR Kits (Qiagen) [18] .
DNA staining technology was then optimized for the lower detection limit and simplified to overcome technical barriers for technology automation. Saudi Arabia desert environment presents a significant challenge to DNA staining technology since high temperature and temperature variation are likely to influence dye stability and signal intensity. Therefore, the requirement for temperature control in the sensor prototype was also investigated.
To be specific, the schematic diagram (Figure 1) illustrated the experimental approaches where various parameters were tested and optimized for the potential appli-

Figure 1. Schematic diagram of experimental approaches for the optimization of DNA staining technology.
cation of DNA staining technology in an automated sensor prototype using a high- sensitivity 920 FLS spectrofluorometer (Edinburgh Instruments, UK).
Finally, design specifications and technical requirements and solutions were determined for the construction of automated sensor prototype.
3. Results and Discussion
3.1. Baseline Cell Numbers in the Saudi Aramco Injection Seawater System
A microbial survey for the Saudi Aramco seawater injection system was conducted in March 2010. The seawater samples were collected from the outlet of originating seawater treatment plant (OSTP), intermediate water injection stations (IWIS), and an injection well for determination of total microbial load (total bacteria and archaea) using qPCR method.
The results of microbial survey were summarized in Table 1. Microorganisms were detected in the injection seawater system, occurring in numbers of 103 - 104 cells/ml. The water collected at the outlet of the OSTP contained a low number of microorganisms, in the order of 103 cells/ml. The number of microorganisms in the water increased from the OSTP to the IWIS. The increase was more significant in the uncoated shipping line than the coated line. At the injection well, the cell number had decreased a little. The reason for this decrease is not fully clear. According to our best judgment, a continued general increase in cell numbers throughout the system is more likely than a general decrease.
In February 2012, nine injection seawater samples were collected from injection wells in three oil fields, and the baseline microbial load was determined by qPCR method. Both bacteria and archaea were detected in low numbers in field samples from Saudi Aramco injection water wells (Table 2). The number of archaea ranged from being below detection limit (BDL) to 1.3 × 10³ cells/ml, while bacteria numbers ranged between BDL to 5 × 10³ cells/ml. It should be noted that the samples where no bacteria were detected are very likely due to the presence of biocides in the samples. High levels of formaldehyde are known to decrease the efficiency of the qPCR assay for cell enumeration [19] - [22] .
Finally, in May 2015, four seawater samples were collected from injection wells in two oil fields, four to five days after previous biocide dosing. The samples were sub-

Table 1. Number of bacteria and archaea in injection seawater samples determined by qPCR analysis in 2010.
Table 2. Baseline microbial load in injection seawater determined by qPCR analysis in 2012.
BDL = below detection limit; ND = not detected. *The sample appeared viscous and foamed during DNA extraction, suggesting that biocide may have been present at time of sampling.
jected to MPN test and qPCR analysis to determine the total number of bacteria and sulfate-reducing bacteria (SRB). The results were shown in Table 3. Compared to the results in 2010 and 2012, the injection seawater samples collected in 2015 showed higher bacteria number, ranging from 4.2 × 10⁴ to 8.8 × 10⁴/ml determined by qPCR method, and 9.3 × 10⁵ to 2.3 × 10⁶/ml determined by MPN test. qPCR analysis also detected SRB in range of 3.6 × 10³ to 9.2 × 10³/ml. The higher microbial number detected may be a result of recovery and growth of microbes from previous batch treatment of biocides.
In summary, the microbial number found in Saudi Aramco injection seawater varies widely depending on system, location, sampling season, and enumeration method. It ranges from 4.5 × 10² to 8.8 × 10⁴ cells/ml (qPCR analysis), and can be as high as 2.3 × 10⁶ cells/ml (MPN test). With proper optimization and sensitive signal detection system, DNA staining technology can provide useful information about the microbial numbers in the vast Saudi Aramco seawater injection system and at remote injection wells, and whether the countermeasures to reduce the microbial load should be taken.
3.2. Optimization of DNA Staining Technology
3.2.1. Determination of Optimal Excitation and Emission Spectra
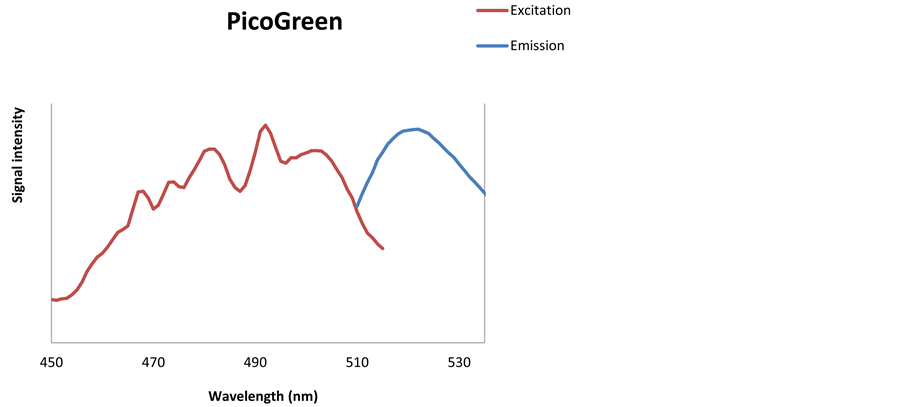
The signal intensity obtained from the stained cells can be improved significantly by performing the detection of the fluorescent signal at certain excitation and emission spectra. The optimal excitation and emission spectra are dye dependent and can furthermore be influenced by environmental conditions such as salinity [11] [13] [16] .
A detailed analysis of the excitation (EX) and emission (EM) spectra for PicoGreen and SYBR Green dyes was performed to determine which spectra should be implemented in the sensor prototype to obtain the lowest possible detection limit. A high-sensitivity 920 FLS spectrofluorometer was applied for the experiments. The tests were performed in seawater from Aarhus bay spiked with NaCl to match the salinity of Saudi Aramco injection seawater. An example of the test results is presented in Figure 2, which shows the variation in the signal intensity for the PicoGreen and SYBR Green
Table 3. Number of bacteria and SRB in injection seawater determined by qPCR and MPN tests in 2015.
 (a)
(a)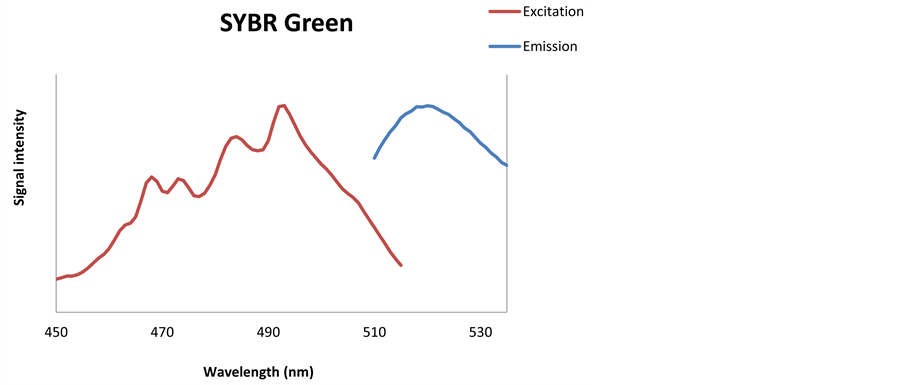 (b)
(b)
Figure 2. Excitation (red line) and emission (blue line) spectra for PicoGreen (a), SYBR Green (b) dyes.
stain, when different EX and EM spectra were applied. The optimal EX and EM spectra for PicoGreen and SYBR Green dyes were determined to be EX490 - 505 nm/EM 518 - 523 nm and EX490 - 498 nm/EM 518 - 522 nm, respectively. The optimal spectra were used for the optimization of DNA staining and for the selection of sensitive and highly specific detector implemented in the sensor prototype.
3.2.2. Effect of Sample Pre-Treatment on Fluorescence Signal Intensity
SYBR Green is a cell permeable DNA stain, while PicoGreen cannot penetrate the cell membrane and needs cell permeation treatment prior to staining to increase DNA binding efficiency and thereby improve the bacterial detection limit [11] . Several permeation treatment methods [11] [13] - [15] [23] , including ionic and nonionic detergents (sodium dodecyl sulfate or SDS, and Triton X-100), formaldehyde fixation, and cell destruction by liquid nitrogen, have been tested with enrichment culture grown in artificial seawater media with 5.5% salinity and pH 6.8 to mimic the conditions in Saudi Aramco injection seawater system.
The signal intensity for PicoGreen could be significantly increased by either destroying cells with liquid nitrogen or treating cells with Triton X-100 (Figure 3(a)). SYBR Green staining showed equally high signals with destroyed cells and non-treated cells (Figure 3(b)). This illustrates that SYBR Green is able to penetrate efficiently into the living cells without any pre-treatment. Triton X-100 method was excluded from further testing as this viscous material is likely to cause tubing clogging in the sensor and erroneous measurement of the cell density caused by air bubbles formed during mixing [24] . SDS pre-treatment and formaldehyde fixation were also excluded, as they did not improve the fluorescent signal. The treatment marked with green in Figure 3 was selected for further experiments to determine the detection limit of DNA staining technology.
3.2.3. Detection Limits Obtained with the Optimized DNA Staining Technology
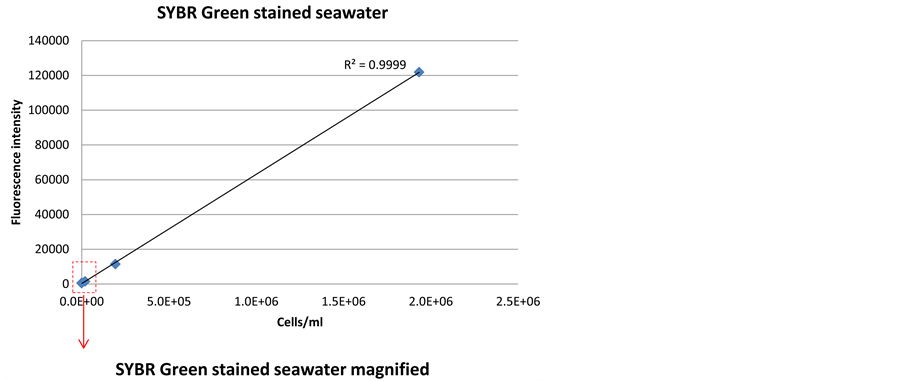
The detection limit of the DNA staining technology was tested for PicoGreen and SYBR Green stains, applying the optimum excitation and emission spectra and the optimum pre-treatment of the cell sample. The detection limits were determined by applying the staining technologies on a serial dilution of bacteria in seawater with 5.5% salinity.
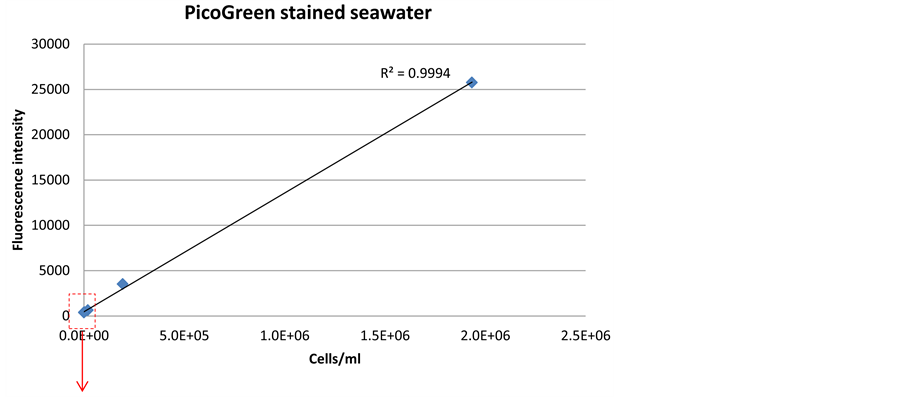
Both SYBR Green and PicoGreen stains had detection limits down to 2 × 10³/ml without any preceding treatments of the cells (Figure 4 and Figure 5). This confirms that the optimized method for these stains will be sufficient to detect the low cell numbers in the Saudi Aramco injection seawater system. The signal intensity for SYBR Green (Figure 4(b)) was higher at low cell concentration than PicoGreen (Figure 5(b)), and therefore, SYBR Green was evaluated to be more reliable for detection of the low cell number found in Saudi Aramco injection seawater.
When applied on destroyed enrichment culture grown in artificial seawater media, the detection limit of SYBR Green and PicoGreen was 1 × 10⁵ cells/ml and 1 × 10⁴ cells/ ml, respectively (Figure 6 and Figure 7). The higher detection limit was very likely caused by high background fluorescence from residual DNA of yeast extract [25] ,
 (a)
(a)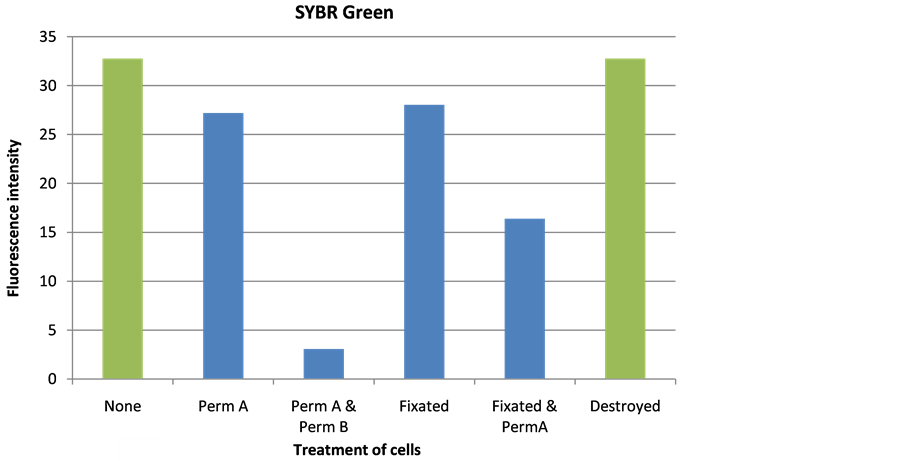 (b)
(b)
Figure 3. Influence of selected treatments on fluorescence intensity after staining with PicoGreen (a) and SYBR Green (b). Perm A―Triton X-100, Perm B―SDS, Fixated―formaldehyde, and Destroyed―liquid nitrogen.
which had been added to the artificial growth medium to stimulate bacterial growth. Therefore, the detection limit obtained in seawater will presumably best represent the detection limit in Saudi Aramco injection seawater.
The detection limit of 2 × 10³ cells/ml for SYBR Green and PicoGreen without prior treatment will be sufficiently low to detect the increases in biomass in Saudi Aramco injection seawater.
 (a)
(a)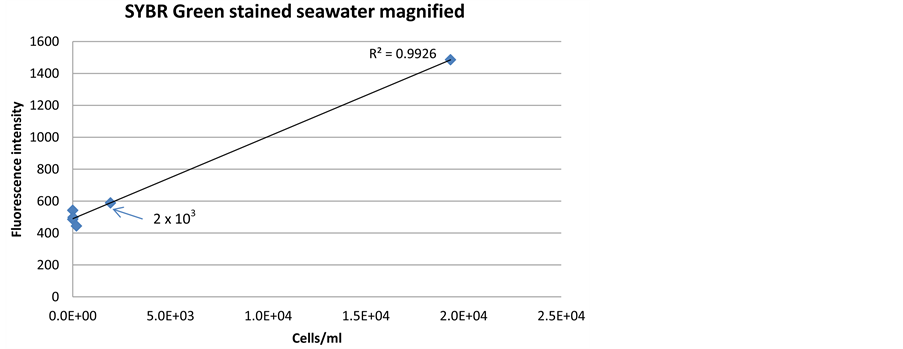 (b)
(b)
Figure 4. Correlation between fluorescence signal intensity and cell density, when staining a dilution series of bacterial cells in seawater with SYBR Green dye.
 (a)
(a)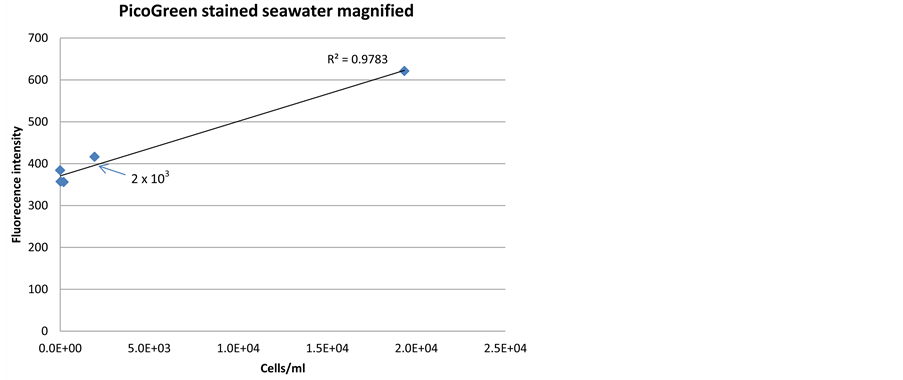 (b)
(b)
Figure 5. Correlation between fluorescence signal intensity and cell density, when staining a dilution series of bacterial cells in seawater with PicoGreen dye.
 (a)
(a) (b)
(b)
Figure 6. Correlation between fluorescence signal intensity and cell density, when staining a dilution series of destroyed bacterial cells with SYBR Green dye.
 (a)
(a)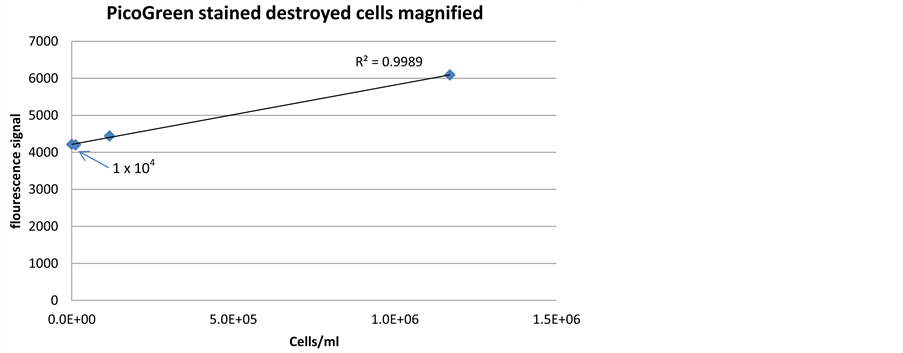 (b)
(b)
Figure 7. Correlation between fluorescence signal intensity and cell density, when staining a dilution series of destroyed bacterial cells with PicoGreen dye.
3.3. Simplification of Technology for Improved Automation Potential
To construct a robust automatic online monitoring sensor with minimal maintenance needs, it is important to apply as simple procedures as possible, required in the DNA staining technology. Method simplification was investigated in pre-treatment and pre- filtration of the sample.
3.3.1. Simplification of Sample Pre-Treatment
Pre-treatment of sample may increase signal intensity and sensitivity of the sensor technology, but will also complicate sensor construction. Several chemical and me- chanical pre-treatment methods were evaluated for SYBR Green and PicoGreen dyes (Figure 3). The results indicated that SYBR Green can penetrate into the living cells efficiently without any pre-treatment with a low detection limit of 2 × 10³ cells/ml (Figure 4(b)). PicoGreen also achieved the same detection limit without any preceding treatments of the cells; however, signal intensity was lower at low cell concentration than SYBR Green (Figure 5(b)).
The detection limit of destroyed cells with PicoGreen and SYBR Green was 1 × 10⁵ cells/ml and 1 × 10⁴ cells/ml, respectively, higher than the detection of non-treated cells with corresponding stains (Figure 6 and Figure 7). In addition, cell destruction procedure requires energy and will significantly complicate the construction of an online sensor.
SYBR Green staining of non-treated cells is therefore the recommended technology for application in the automated sensor prototype.
3.3.2. Necessity of Sample Pre-Filtration
Larger particles can interfere with fluorescence emission from the cells [26] . The particles interfere by causing scattering of the fluorescence signal, resulting in decreased detection limit. Pre-filtration at the sampling inlet of the sensor removes larger particles from the sample, but complicates automation of the technology, as filters may need frequent replacement due to clogging and/or bacterial growth on the filter surface. The need for incorporating a filtration step in the DNA staining technology was evaluated.
The Saudi Aramco injection seawater contains a low number of particles larger than 2 µm (approximately 600 - 1000 particles/ml). The majority of particles observed in the 2010 survey were very small, with only 10% of the particles being larger than 2.89 µm. Raw Danish seawater contains markedly more particles than Saudi Aramco injection seawater, and can be reckoned as a worst-case scenario. Filtration of raw Danish seawater samples (10-µm filter) did not influence the standard deviation of fluorescence readings (16 samples) compared to non-filtered seawater (Figure 8). The fluorescence reading before and after filtration was approximately the same. It is therefore concluded that pre-filtration of Saudi Aramco injection seawater was not necessary before bacterial quantification with DNA staining technology.
A simple automated microbe sensor can be designed and constructed based on the SYBR Green staining technology, where a low detection limit is achieved without
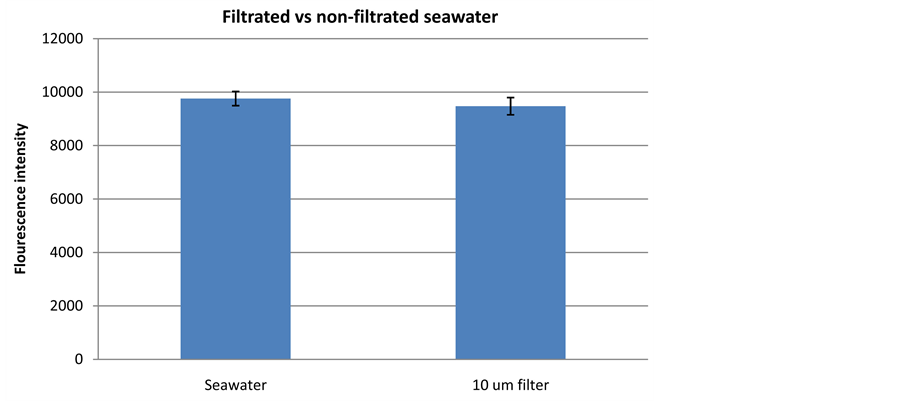
Figure 8. Fluorescence signal detected from Danish seawater without any preceding treatment (seawater) and coarse filter seawater (10 µm filter).
chemical or mechanical pre-treatment of the injection seawater sample. Furthermore, automation of the staining procedure can be further simplified by omitting sample filtration prior to analysis.
3.4. Requirements for Temperature Control in the Sensor Prototype
The automated sensor is designed to work under the conditions prevailing in the Saudi Arabian dessert where temperature varies between approximately 5˚C and 53˚C. High temperature variation will likely influence the stability of the staining solution and the fluorescence signal output. Therefore, the temperature sensitivity of the DNA staining technology was evaluated for three essential steps: i) stability of staining reagents during long-time storage; ii) fluorescence signal output; and iii) binding of the stain to cellular DNA.
3.4.1. Temperature Sensitivity of Staining Reagents during Storage
The fluorescent dyes may lose stability during prolonged storage at elevated temperatures [13] [14] . The demand for temperature regulation in the dye storage compartment of the sensor was tested by incubating the stain at different temperatures for prolonged time (26 days for SYBR Green and 30 days for PicoGreen).
SYBR Green storage stability was tested with concentrated and pre-diluted (1:10) dye at −20˚C, 5˚C, 20˚C and 30˚C. PicoGreen was incubated at 5˚C (recommended storage temperature), 20˚C and 40˚C. The fluorescent signal intensity of the concentrated SYBR Green was very stable and independent of storage temperature (Figure 9(a)). The signal intensity after staining with pre-diluted SYBR Green dye was more fluctuating (data not shown). We therefore recommend that SYBR Green is applied in the sensor prototype in its concentrated form, and that the solution is stored below 30˚C.
The signal intensity of the PicoGreen stain decreased gradually during 30 days’ storage at elevated temperature. The results indicated that storage at 5˚C is required for PicoGreen, to avoid a false decrease in detected cell densities, due to dye degradation (Figure 9(b)).
3.4.2. Temperature Sensitivity during Signal Detection
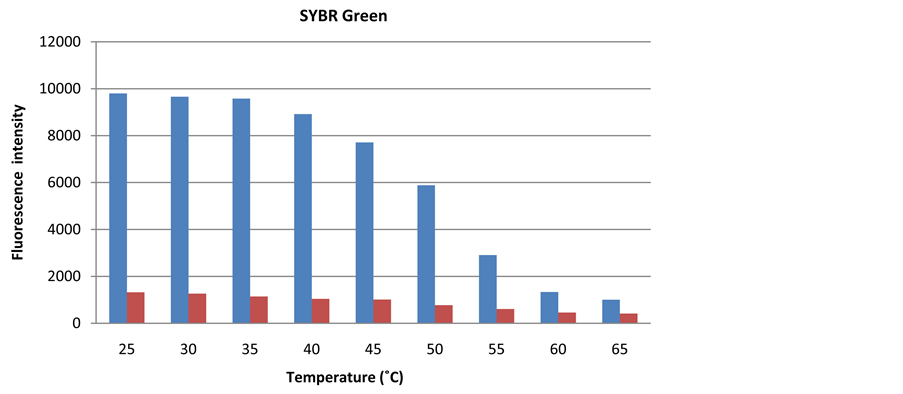
The temperature can affect the fluorescence signal intensity either by influencing dye stability or by causing dissociation of DNA strings and thereby hindering dye binding to cellular DNA [9] [10] [13] [14] . The need for temperature regulation during detection of the fluorescence signal was investigated by measuring the fluorescence intensity at different temperatures with 5˚C intervals from 25˚C to 65˚C on seawater and sterile seawater.
The fluorescence intensity of both PicoGreen and SYBR Green dyes was highly influenced by temperature during signal detection (Figure 10). Fluorescence signal from SYBR Green remained stable at temperatures between 25˚C and 35˚C, while PicoGreen fluorescence decreased as soon as the detection temperature increased from 25˚C. Due to the high temperature fluctuations expected in the Saudi Arabian dessert, it is re- commended to incorporate temperature regulation in the chamber of the sensor prototype where the fluorescence signal is detected.
 (a)
(a) (b)
(b)
Figure 9. Fluorescence intensity of samples stained with SYBR Green (a) and PicoGreen (b) after long-term storage (26 and 30 days, respectively) of the dye at selected temperatures. Blue bar = sterile seawater, orange bar = seawater, red bar = spiked seawater.
 (a)
(a) (b)
(b)
Figure 10. The temperature during fluorescence measurement influences the fluorescence intensity of SYBR Green (a) and PicoGreen (b) significantly (red bar = sterile filtered seawater, blue bar = seawater).
3.4.3. Temperature Sensitivity during Cell Staining
Temperature variations may influence binding of the dye to the cellular DNA and thereby influence signal intensity obtained [9] [10] . The need for temperature control during sample staining was tested by comparing the fluorescence signal obtained from cells, which had been incubated with stain at different temperatures.
PicoGreen fluorescence intensity was independent of whether the sample was incubated at 22˚C or 30˚C, while the fluorescence intensity for samples incubated at 37˚C decreased slightly (Figure 11(a)). The signal intensity from SYBR Green stained samples incubated at different temperatures showed no clear-cut pattern (Figure 11(b)). Overall, the fluorescence intensity was only slightly influenced by the incubation temperatures during staining.
Temperature control is needed for obtaining stable fluorescence signal intensity with DNA staining technology, if the sensor is required to take fluorescence readings at any given time. SYBR Green signal intensity was not influenced by elevated temperatures up to 30˚C, and SYBR Green is therefore again the better suited dye for the sensor prototype.
4. Conclusions of Optimization and Automation
1) Bacterial numbers in Saudi Aramco injection seawater
The total microbial numbers in Saudi Aramco injection seawater varied widely, from 4.5 × 10² to 8.8 × 10⁴ cells/ml (qPCR analysis), and up to 2.3 × 10⁶ cells/ml (MPN test).
2) Detection limit
 (a)
(a) (b)
(b)
Figure 11. Fluorescence intensity of PicoGreen and SYBR Green stained seawater after incubation of the staining reaction at 22˚C, 30˚C, and 37˚C for 10 and 20 minutes, respectively.
The DNA staining technology for bacterial quantification in seawater was successfully optimized to detect 2 × 10³ cells/ml, when applying the fluorescent stains SYBR Green, combined with a high-sensitivity fluorescence spectrophotometer adjusted to the optimal excitation and emission spectra.
The DNA staining technology is suited for detecting increases in cell numbers in the Saudi Aramco injection seawater system.
3) Automation potential
The optimized DNA staining technology could be simplified for method automation in the sensor prototype, by applying SYBR Green stain without any pretreatment and pre-filtration of the sample.
4) Requirements for temperature control
SYBR Green stain tolerated elevated temperature during storage (30˚C), without a significant reduction in signal intensity.
Cell staining and fluorescencemeasurement of SYBR Green dye are sensitive to high temperature (up to 35˚C).
Temperature control is recommended in the sensor prototype for obtaining stable fluorescence signal intensity with the DNA staining technology.
5. Requirement for Sensor Prototype Design and Construction
Based on the experimental outcome of the optimization, the following recommendations were made for the design and construction of the sensor prototype:
A simple sensor construction can be obtained with SYBR Green staining, as the stain can be added directly to the injection seawater sample without any additional chemical or mechanical treatment of the sample.
For optimal signal intensity, the sensor should incorporate a high sensitivity fluorescence detector with EX 490 - 498 nm and EM 518 - 522 nm.
With large temperature fluctuations in the Saudi Arabian dessert, temperature re- gulation within the sensor prototype is recommended to ensure stable fluorescence signal intensity.
Sensor prototype needs to be designed and constructed with robust components for equipment functionality and durability in challenging dessert environment.
The sensor prototype shall be designed to autonomously detect microorganisms in Saudi Aramco seawater injection systems based on system salinity, pH, temperatures, biocides and particle distribution. The prototype will be controlled by an automated timer, which turns on an industrial panel computer with custom-made sensor software. The software controls the sensor operation and equipment shut-down following measurements.
Future work consists of the determination of design specifications and construction of sensor prototype. The constructed autonomous microbe sensor will then be tested and optimized in laboratory and validated in the Saudi Aramco injection seawater system, which will be presented in a subsequent paper.
Acknowledgements
The authors would like to acknowledge the Saudi Aramco Oil Company (Saudi Aramco) for granting permission to publish this paper.
Cite this paper
Al-Moniee, M.A., Zhu, X.Y., Tang, L., Juhler, S., Nuwaiser, F.I., Sanders, P.F. and Al-Abeedi, F.N. (2016) Optimization of DNA Staining Technology for Development of Autonomous Microbe Sensor for Injection Seawater Systems. Jour- nal of Sensor Technology, 6, 27-45. http://dx.doi.org/10.4236/jst.2016.63003
References
- 1. Al-Moniee, M.A., Juhler, S., Sorensen, K., Zhu, X.Y., Lundgaard, T., Abeedi, F.N. and Sanders, P.F. (2016) Laboratory-Scale Evaluation of Single Analyte Bacterial Monitoring Strategies in Water Injection Systems. Journal of Sensor Technology, 6, 11-26.
http://dx.doi.org/10.4236/jst.2016.62002 - 2. Al-Moniee, M.A., Juhler, S., Sorensen, K., Al-Abeedi, F.N., Lundgaard, T. and Sanders, P.F. (2014) A Review of Saudi Aramco’s Water Flooding System and Methods for Monitoring Microbial Activity. Proceedings of 15th Middle East Corrosion Conference, Bahrain, 2-5 February 2014, 1-19.
- 3. Ren, H., Wang, W., Liu, Y., Liu, S., Lou, L., Cheng, D., He, X., Zhou, X., Qiu, S., Fu, L., Liu, J. and Hu, B. (2015) Pyrosequencing Analysis of Bacterial Communities in Biofilms from Different Pipe Materials in a City Drinking Water Distribution System of East China. Applied Microbiology and Biotechnology, 99, 10713-10724.
http://dx.doi.org/10.1007/s00253-015-6885-6 - 4. Teske, A., Wawer, C., Muyzer, G. and Ramsing, N.B. (1996) Distribution of Sulfate-Reducing Bacteria in a Stratified Fjord (Mariager Fjord, Denmark) as Evaluated by Most-Probable-Number Counts and Denaturing Gradient Gel Electrophoresis of PCR-Amplified Ribosomal DNA Fragments. Applied Environmental Microbiology, 62, 1405-1415.
- 5. Pope, D.H. and Pope, R.M. (1998) Guide for the Monitoring and Treatment of Microbiologically Influenced Corrosion in the Natural Gas Industry. GRI Report GRI-96/0488, Gas Research Institute, Des Plaines.
- 6. Vester, F. and Ingvorsen, K. (1998) Improved Most-Probable-Number Method to Detect Sulfate-Reducing Bacteria with Natural Media and a Radiotracer. Applied Environmental Microbiology, 64, 1700-1707.
- 7. Zhu, X.Y. and Kilbane II, J.J. (2004) Molecular Tools in Microbial Corrosion. In: Vazquez-Duhalt, R. and Quintero-Ramirez, R., Eds., Petroleum Biotechnology: Development and Perspectives, Elsevier Science, Amsterdam, 219-232.
- 8. Zhu, X.Y., Modi, H., Ayala, A. and Kilbane II, J.J. (2006) Rapid Detection and Quantification of Microbes Related to Microbiologically Influenced Corrosion Using Quantitative Polymerase Chain Reaction. Corrosion, 62, 950-955.
http://dx.doi.org/10.5006/1.3278233 - 9. Singer, V.L., Jones, L.J., Yue. S.T. and Haugland, R.P. (1997) Characterization of PicoGreen Reagent and Development of a Fluorescence-Based Solution Assay for Double-Stranded DNA Quantitation. Analytical Biochemistry, 249, 228-238.
http://dx.doi.org/10.1006/abio.1997.2177 - 10. Dragan, A.I., Casas-Finet, J.R., Bishop, E.S., Strouse, R.J., Schenerman, M.A. and Geddes, C.D. (2010) Characterization of PicoGreen Interaction with dsDNA and the Origin of Its Fluorescence Enhancement upon Binding. Biophysical Journal, 99, 3010-3019.
http://dx.doi.org/10.1016/j.bpj.2010.09.012 - 11. Tranvik, L.J. (1997) Rapid Fluorometric Assay of Bacterial Density in Lake Water and Seawater. Limnology and Oceanography, 42, 1629-1634.
http://dx.doi.org/10.4319/lo.1997.42.7.1629 - 12. Marie, D., Valout, D. and Partensky, E. (1996) Application of the Novel Nucleic Acid Dyes YOYO-1, YOPRO-1, and Pico-Green for Flow Cytometric Analyses of Marine Prokaryotes. Applied Environmental Microbiology, 62, 1649-1655.
- 13. Molecular Probes, Quant-iTTM PicoGreenR dsDNA Reagent and Kits, Protocol MP 07581, Revised June 10, 2008.
- 14. Marie, D., Partensky, F., Jacquet, S. and Vaulot, D. (1997) Enumeration and Cell Cycle Analysis of Natural Populations of Marine Picoplankton by Flow Cytometry Using the Nucleic Acid Stain SYBR Green I. Applied Environmental Microbiology, 63, 186-193.
- 15. Dragan, A.I., Pavlovic, R., McGivney, J.B., Casas-Finet, J.R., Bishop, E.S., Strouse, R.J., Schenerman, M.A. and Geddes, C.D. (2012) SYBR Green I: Fluorescence Properties and Interaction with DNA. Journal of Fluorescence, 22, 1189-1199.
http://dx.doi.org/10.1007/s10895-012-1059-8 - 16. Noble, R.T. and Fuhrman, J.A. (1998) Use of SYBR Green I for Rapid Epifluorescence Counts of Marine Viruses and Bacteria. Aquatic Microbial Ecology, 14, 113-118.
http://dx.doi.org/10.3354/ame014113 - 17. Shibata, A., Goto, Y., Saito, H., Kikuchi, T., Toda, T. and Taguchi, S. (2006) Comparison of SYBR Green I and SYBR Gold Stains for Enumerating Bacteria and Viruses by Epifluorescence Microscopy. Aquatic Microbial Ecology, 43, 223-231.
http://dx.doi.org/10.3354/ame043223 - 18. Zhu, X.Y., Ayala, A., Modi, H. and Kilbane II, J.J. (2005) Application of Quantitative, Real-Time PCR in Monitoring Microbiologically-Influenced Corrosion (MIC) in Gas Pipelines. Proceedings of the NACE International Annual Conference, Corrosion/2005, Houston, 3-7 April 2005, Paper #05493, 1-16.
- 19. Fiallo, P., Williams, D.L., Chan, G.P. and Gillis, T.P. (1992) Effects of Fixation on Polymerase Chain Reaction Detection of Mycobacterium leprae. Journal of Clinical Microbiology, 30, 3095-3098.
- 20. National Research Council (2006) Path to Effective Recovering of DNA from Formalin-Fixed Biological Samples in Natural History Collections: Workshop Summary. The National Academies Press, Washington DC.
- 21. Dietrich, D., Uhl, B., Sailer, V., Holmes, E.E., Jung, M., Meller, S. and Kristiansen, G. (2013) Improved PCR Performance Using Template DNA from Formalin-Fixed and Paraffin-Embedded Tissues by Overcoming PCR Inhibition. PLoS ONE, 8, e77771.
http://dx.doi.org/10.1371/journal.pone.0077771 - 22. Flury, B.B., Weisser, M., Prince, S.S., Bubendorf, L., Battegay, M., Frei, R. and Goldenberger, D. (2014) Performances of Two Different Panfungal PCRs to Detect Mould DNA in Formalin-Fixed Paraffin-Embedded Tissue: What Are the Limiting Factors? BMC Infectious Diseases, 14, 692.
http://dx.doi.org/10.1186/s12879-014-0692-z - 23. Hyka, P., Lickova, S., Pribyl, P., Melzoch, K. and Kovar, K. (2013) Flow Cytometry for the Development of Biotechnological Processes with Microalgae. Biotechnology Advances, 31, 2-16.
http://dx.doi.org/10.1016/j.biotechadv.2012.04.007 - 24. Petersen, J. and Nguyen, J. (2005) Comparison of Absorbance and Fluorescence Methods for Determining Liquid Dispensing Precision. Journal of Laboratory Automation, 10, 82-87.
http://dx.doi.org/10.1016/j.jala.2005.01.009 - 25. Hotzel, H., Müller, W. and Sachse, K. (1999) Recovery and Characterization of Residual DNA from Beer as a Prerequisite for the Detection of Genetically Modified Ingredients. European Food Research and Technology, 209, 192-196.
http://dx.doi.org/10.1007/s002170050478 - 26. Lakowicz, J.R. (2006) Instrumentation for Fluorescence Spectroscopy. In: Lakowicz, J.R., Ed., Principles of Fluorescence Spectroscopy, 3rd Edition, Springer, New York, 27-61.
http://dx.doi.org/10.1007/978-0-387-46312-4_2