Journal of Sensor Technology
Vol. 3 No. 1 (2013) , Article ID: 29055 , 5 pages DOI:10.4236/jst.2013.31001
Chemical Sensitivity of Luminescent Epitaxial Surface InP Quantum Dots
1Physics Department, University of Rome “Tor Vergata”, Rome, Italy
2INSTM, Research Unit of the University of Roma “Tor Vergata”, Rome, Italy
3Department of Physics, Humboldt University, Berlin, Germany
Email: *rdeangelis@roma2.infn.it
Received January 9, 2013; revised February 11, 2013; accepted February 21, 2013
Keywords: Vapour Sensitivity; Quantum Dot; Photoluminescence; InP; Organic Solvent
ABSTRACT
Surface InP quantum dots grown by gas source molecular beam epitaxy on In0.48Ga0.52P buffer layer lattice matched to GaAs substrate shows a broad-band near-infrared photoluminescence ranging from 750 to 865 nm dependent on their dimensions. A reversible luminescence intensity enhancement has been observed when the quantum dots were exposed to vapours of different chemical solvents with the highest sensitivity for alcohol (methanol and ethanol) vapours. The luminescent behaviour is dependent on the solvent type and concentration. The peak energy and band shape of the luminescence are not affected by the solvent vapour.
1. Introduction
Semiconductor quantum dots (QDs) show better suited photoluminescence (PL) properties as sensitive media in luminescence based devices, compared to commonly used dyes [1-5]. The suited PL properties include broad absorption band, size tuneable spectral emission, higher photostability, and emission lifetime ranging between several hundreds of picosecond and tens of nanosecond [6]. In the last ten years, authors reported the sensitivity of colloidal QDs embedded into polymeric matrix [7-11], sol-gel materials [12,13] or dispersed in Al2O3 nanopore array [13]. Per se they display sensitivity towards some commonly used solvents like methanol, ethanol, acetone and chloroform [12]. In addition selective detection has been achieved for colloidal QDs by means of chemical functionalization as reported by many authors [10,11, 13,14]. The sensitivity of QDs to environmental vapour depends on the interaction between the adsorbed organic species and the surface atoms [15]. This is a general property of the interaction between organics and semiconductor surfaces. Thanks to the high effective area available for the interaction with the solvent vapour, a higher PL sensitivity is expected for nanostructure compared to bulk surfaces and thin films [16-18]. In the case of bulk semiconductor surfaces and thin films, the adsorbed solvent chemical is thought to alter the electronic and optical properties of the material by affecting its surface states [15]. Such surface trap states capture the photoexcited electrons or holes causing the hindering of the radiative recombination of the charge carriers and reducing PL emission efficiency. For surface QDs, the presence of surface trap-states is mostly due to dangling bonds. These types of defects are particularly detrimental for PL efficiency. In order to reach high level of emission intensity in such systems, it is common practice to passivate these surface states with a cap layer of a different semiconductor having a wider band gap relative to the QD material. However, in this way, the sensitivity of such systems to external environment is strongly reduced. Recently, a series on studies of uncapped QDs appeared in literature [16,17]. They are related to application where the interaction between material and environment is mandatory. In this work we present a study on the luminescence properties of surface (uncapped) QDs. Such QDs are directly grown on semiconductor substrates which are better suited for integration with well-established semiconductor technology compared to colloidal QDs. Therefore they are very promising for miniaturized optical sensors application and lab-on-chip technology. Surface InP QDs grown by epitaxy on In0.48Ga0.52P buffer layer lattice matched to GaAs substrate present a sizeable PL emission up to room temperature [18] in the range 750 - 865 nm dependent on their dimension whose intensity is affected by the composition of the surrounding gaseous environment [16,17]. In the present work we extend previous preliminary studies on methanol sensitivity of surface InP QDs PL to the case of a series of commonly used solvents with the aim to clarify the sensitivity mechanism and to proceed in possible exploitation of such system as sensor devices. In particular we report on the effect on the PL intensity of solvents having different polarity namely methanol, ethanol, acetone and chloroform.
2. Experimental
2.1. Synthesis and Morphological Characterization
QDs composed of InP on 250 nm thick In0.48Ga0.52P layer were grown using gas-source molecular beam epitaxy (GSMBE) in a RIBER 21T system on (100) GaAs substrates. The synthesis procedure has been described in detail in previous papers [19-24]. The lattice mismatch of 3.8% between InP and In0.48Ga0.52P (lattice matched to GaAs) drives the strain-induced formation of QDs via the Stranski-Krastanow mechanism. The areal density and the size of QDs were controlled using the InP deposition rate and time [24]. InP deposition rate was 0.85 ML/s. The structural properties of the samples and the composition of the In0.48Ga0.52P layers were characterized using double-crystal x-ray diffractometry (DCXD) and atomic force microscopy (AFM). The results show latticematched In0.48Ga0.52P to GaAs with good crystal quality [22]. AFM was carried out using an ex-situ Nanoscope IIIa in the tapping mode to image the surfaces of the sample. An AFM image is reported in Figure 1. The inset of Figure 1 shows the cross-sectional sketch of
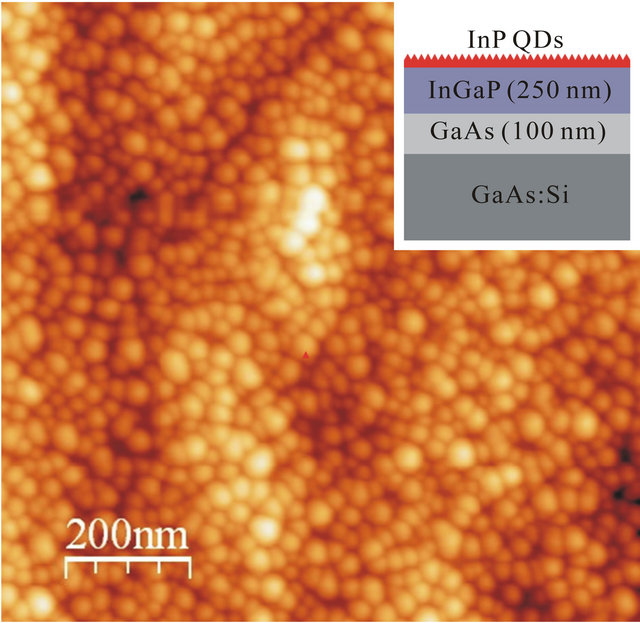
Figure 1. 1 μm × 1 μm AFM image of the investigated sample. The cross-sectional view of the sample is sketched in the inset.
the sample. The sample is homogeneously covered by QDs with a lateral size of about 20 - 30 nm and a height of 3 - 4 nm. These values have been obtained by a statistical analysis of the size distribution of about 100 dots by using the GwyddionTM software for the analysis of the AFM micrograph [25]. The dot density is 9 × 10¹⁰ dots/cm2.
2.2. Photoluminescence Characterization in Different Gaseous Environments
The optical excitation in the PL measurements was provided by a 450 nm diode laser with a power density of about 90 mW/cm2. Luminescence was collected and analysed by a 25 cm monochromator (ARC SpectraPro- 300i) and a photomultiplier (Hamamatsu 3610) using a lock-in technique. The sample was mounted rigidly in a sealed vacuum chamber. We studied the sample in a static atmosphere composed by a blend of the chosen solvent vapour and N2. The saturated vapour were obtained by fluxing N2 in a Drexel bottle which allows the bubbling of the liquid solvent. The vapour inside the chamber was inflated by a syringe which allowed us to select specified amount of solvent molecules. Methanol (99.8%), ethanol (99.8%), acetone (99.5%) and amylene 1% stabilized chloroform (99.8%) were purchased from Sigma-Aldrich and used without further purification. Analytical-reagent grade, anhydrous chemicals were used in the measurements. Saturated vapour pressure was calculated according to the Antoine’s law. The equation parameters were taken from NIST database [26]. Thermal fluctuations of the bubbler (~1˚C) give rise to an error of about ~5% on the determination of the vapour concentration. When the mixed N2/solvent vapour was injected into the chamber we maintained conditions of ambient pressure (monitored by a pressure gauge) and a temperature of 25˚C controlled by a thermocouple positioned on the sample stage with accuracy of ±1˚C. Gases and bubbler were stabilized at the same temperature. These precautions were required to discriminate the effect of changes in temperature from those induced by the vapour. An increase of temperature lowers QD PL intensity because the probability of non-radiative charge carriers recombination increases. Specifically, we estimated that a temperature change of 1˚C (around room temperature) determines a PL intensity change of about ~3%.
3. Results and Discussion
The PL spectrum of the investigated sample is showed in Figure 2. It presents a broad-band emission with the peak at 848 nm and full width at half maximum (FWHM) of 57 nm. The band does not present differences in the shape and intensity both in low vacuum (1 mbar) and pure N2 static atmosphere. The effect of injection of solvent vapour mixed with N2 is an enhancement of the PL intensity while the band energy position and width do not change. Such characteristic has been observed for all the solvents investigated. In Figure 2 the effect of 14,000 ppm of ethanol vapour on the emission band is shown. We monitored the PL intensity for a fixed wavelength (the maximum of the emission band) as a function of time. When we inflated a certain concentration of solvent vapour, in blend with N2, into the chamber we observed an increase of the signal intensity, while a decrease of the signal was recorded when we extracted the vapour. Figure 3 shows a typical trace where the effect of injection and extraction of different amount of methanol molecules is clearly visible.
We observed that the emission intensity change due to solvent vapour can be fully reversible by evacuating the chamber. The signal trace displays also an overall decay as indicated by the continuous black line in Figure 3. Such a decay, always present under continuous illumination with laser light, can be fitted to a single exponential decay law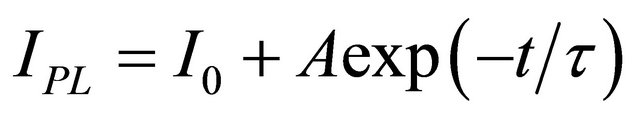 . It is almost inde-
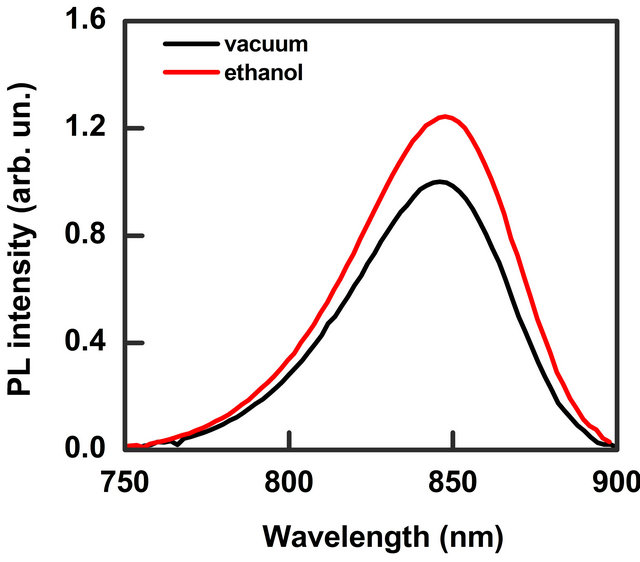
Figure 2. PL spectra in vacuum (black line) and in a static N2 atmosphere containing 14,000 ppm of ethanol vapour (red line). PL peak intensity increases of about 24% respect to vacuum.
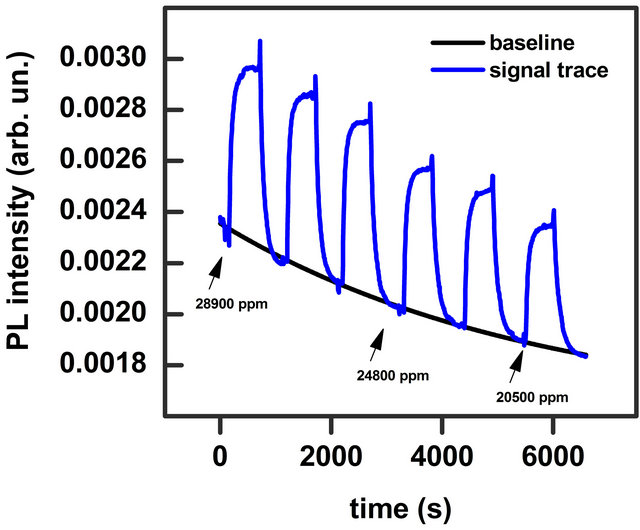
Figure 3. PL signal trace at fixed wavelength on the peak maximum during repeated injection of methanol vapour in blend with N2 (blue line). Concentrations are reported in the figure. Black line is a fit of the baseline, which is an overall exponential decay of the PL signal.
pendent on the type of the solvent and occurs also in vacuum and pure N2 atmosphere. It can be due to a local heating that cannot be avoided even with the careful thermal stabilization of our set-up, or a photodegradation process. This process however is reversible and the original emission intensity is recovered completely after few hours in dark. This decay can be subtracted in the data analysis in order to display the signal trace on a flat baseline. The fit parameters for methanol and ethanol signal traces are reported in Table 1.
The full reversibility of the PL enhancement as a function of the solvent presence indicates that the molecule adsorption is a type of physisorption. In this case the interaction between the solvent molecules and the QDs is weak and consequently it should not be very selective for the solvent type. On this regard, we evaluated the sensitivity (percentage relative intensity) towards the different solvents accordingly to the following formula:
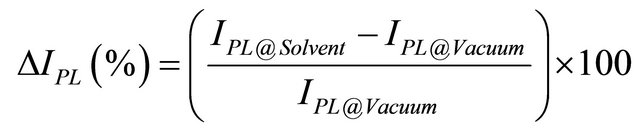 (1)
(1)
where IPL@Solvent represents the intensity at the peak position (l = 848 nm) 500 s after solvent vapour injection, while for IPL@Vacuum we considered the intensity at the same wavelength before injection. The value of 500 s has been chosen as a representative time when the luminescence signal reaches a constant value for a given vapour concentration. In Figure 4 an illustrative graph of the sensitivity for the analyzed solvents (for a fixed concentration of 10,000 ppm) is reported, while in Figure 5 the
Table 1. Baseline fit parameters for methanol and ethanol signal traces.
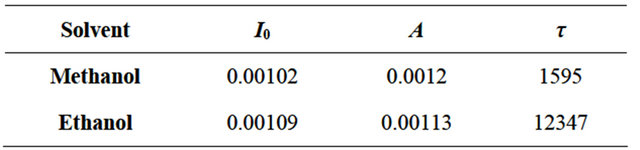
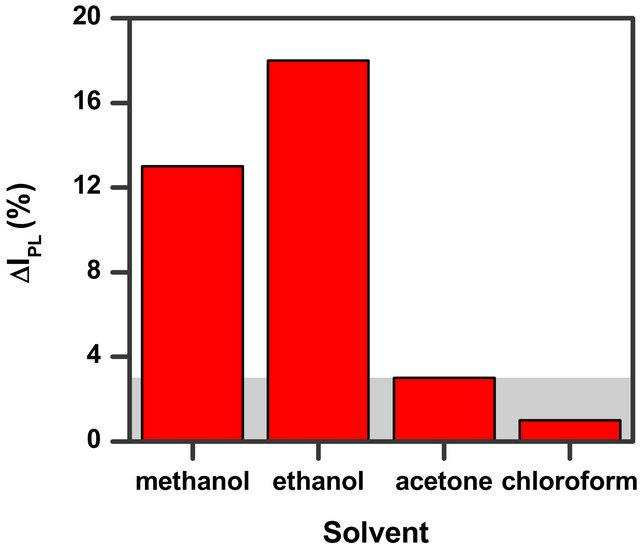
Figure 4. Comparison of the effect of solvent with different polarity (data for 10,000 ppm vapour concentration). The grey area in the figure indicates our data confidence limit.
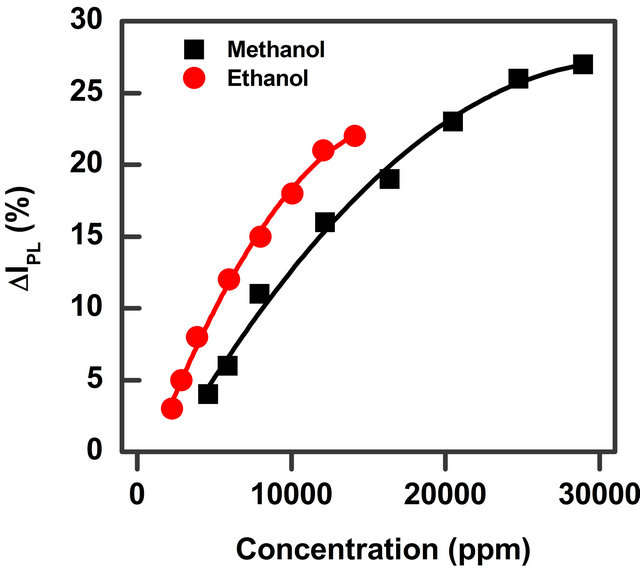
Figure 5. Percentage of the relative PL intensity of surface InP QDs exposed to vapour of two alcohols (methanol and ethanol) as a function of the two organic vapours’ concentration.
relative intensity percentage ΔIPL for methanol and ethanol solvent vapour is reported as a function of the solvent concentration. The data in Figure 4 show that methanol and ethanol—two polar protic solvents—give rise to a higher relative intensity percentage in respect to the other solvents. It is possible to observe that the values are very similar for the two polar protic molecules (methanol and ethanol) while polar aprotic (acetone) and non-polar (chloroform) solvents at the same concentration value give rise to less intense changes. It has to be noted that the changes for the last two solvents is only very low (less than 3%). Moreover our setup sensibility due to possible little thermal changes, small variation of the exciting laser light and error in the vapour amount determination give us a confidence on the results only for intensity changes greater than 3% as reported with a grey area in Figure 4. From the comparison we can conclude that chloroform and acetone are hardly detectable (up to 10,000 ppm concentration) while ethanol and methanol are easily detected.
We ascribe this behaviour to the different interaction strength between the solvent molecule and quantum dot. Ethanol and methanol have high dipole moment and therefore can interact with InP QD surface states more easily than the other two solvents. Such states are one of the main factors which hinders the radiative recombination of charge carriers in semiconductor QD [27,28]. Since the QD structures present a high surface/volume ratio the number of intrinsic surface states is quite high and this can produce a detectable effect on the PL intensity [28]. A possible physical mechanism which explains the luminescence enhancement in presence of solvents is the hindering of the surface states. Adsorbed molecules can reduce the effect of these states when their local electric field partially offsets the surface state fields. According to this assumption we expected that for adsorbates having stronger dipole moment the effect should be more pronounced. To check this hypothesis we tested a series of solvents of different polarities and we found that the two alcohols having high dipole moment display a more visible effect. Another argument supporting this hypothesis is the linear dependence of the PL signal change with the dot coverage (average dot surface area × dot density) as recently reported [17,29]. This observation seems to support that the involved process is a surface related phenomenon.
4. Conclusion
We characterized the photoluminescence sensitivity of epitaxial surface InP QDs grown on In0.48Ga0.52P buffer layer lattice matched to GaAs substrate exposed to vapour of four solvents (methanol, ethanol, acetone, chloroform). QD PL undergoes a reversible enhancement when the dots are in contact with methanol and ethanol solvent vapour dependent on solvent type and concentration, although the sensitivity is low. The effect of acetone and chloroform solvents is hardly detectable. The PL change is greater for solvent molecules presenting a permanent dipole respect to other solvents. A physisorption with different interaction strength on dot surface states can be invoked as an explanation. The obtained results are promising for the development of integrated miniaturized optical chemical sensors, fully compatible with fabrication process common for III-V semiconductor technology.
5. Acknowledgements
The authors thank F. Schnütte at the Leibniz-Institut für Kristallograpie Berlin for access to AFM equipment and measurements and the Italian CARIPLO foundation for financial support through the project number 2010-0525.
REFERENCES
- P. Alivisatos, “The Use of Nanocrystals in Biological Detection,” Nature Biotechnology, Vol. 22, No. 1, 2004, pp. 47-52. doi:10.1038/nbt927
- J. M. Costa-Fernández, R. Pereiro and A. Sanz-Medel, “The Use of Luminescent Quantum Dots for Optical Sensing,” Trends in Analytical Chemistry, Vol. 25, No. 3, 2006, pp. 207-218. doi:10.1016/j.trac.2005.07.008
- R. C. Somers, M. G. Bawendi and D. G. Nocera, “CdSe Nanocrystal Based Chem-/Bio-Sensors,” Chemical Society Reviews, Vol. 36, No. 4, 2007, pp. 579-591. doi:10.1039/b517613c
- P. Jorge, M. A. Martins, T. Trinidade, J. L. Santos and F. Faramarz, “Optical Fiber Sensing Using Quantum Dots,” Sensors, Vol. 7, No. 12, 2007, pp. 3489-3534. doi:10.3390/s7123489
- M. F. Frasco and N. Chaniotakis, “Semiconductor Quantum Dots in Chemical Sensors and Biosensors,” Sensors, Vol. 9, No. 9, 2009, pp. 7266-7286. doi:10.3390/s90907266
- U. Resch-Genger, M. Grabolle, S. Cavaliere-Jaricot, R. Nitschke and T. Nann, “Quantum Dots versus Organic Dyes as Fluorescent Labels,” Nature Methods, Vol. 5, No. 9, 2008, pp. 763-775. doi:10.1038/nmeth.1248
- A. Y. Nazzal, L. Qu, X. Peng and M. Xiao, “Photoactivated CdSe Nanocrystals as Nanosensors for Gases,” Nano Letters, Vol. 3, No. 6, 2003, pp. 819-822. doi:10.1021/nl0340935
- A. Y. Nazzal, X. Wang, L. Qu, W. Hu, Y. Wang, X. Peng and M. Xiao, “Environmental Effects on Photoluminescence of Highly Luminescent CdSe and CdSe/ZnS Core/Shell Nanocrystals in Polymer Thin Films,” Journal of Physical Chemistry B, Vol. 108, No. 18, 2004, pp. 5507-5515.
- R. A. Potyrailo and A. M. Leach, “Selective Gas Nanosensors with Multisize CdSe Nanocrystal/Polymer Composite Films and Dynamic Pattern Recognition,” Applied Physics Letters, Vol. 88, No. 13, 2006, Article ID: 134110. doi:10.1063%2F1.2190272
- O. V. Vassiltsova, Z. Zhao, M. A. Petrukhina and M. A. Carpenter, “Surface-Functionalized CdSe Quantum Dots for the Detection of Hydrocarbons,” Sensors and Actuators B: Chemical, Vol. 123, No. 1, 2007, pp. 522-529. doi:10.1016%2Fj.snb.2006.09.053
- Z. Zhao, M. Arrandale, O. V. Vassiltsova, M. A. Petrukhina and M. A. Carpenter, “Sensing Mechanism Investigation on Semiconductor Quantum Dot/Polymer Thin Film Based Hydrocarbon Sensor,” Sensors and Actuators B: Chemical, Vol. 141, No. 1, 2009, pp. 26-33. doi:10.1016%2Fj.snb.2009.06.036
- M. Hasani, A. M. Coto-García, J. M. Costa-Fernández and A. Sanz-Medel, “Sol-Gels Doped with PolymerCoated ZnS/CdSe Quantum Dots for the Detection of Organic Vapors,” Sensors and Actuators B: Chemical, Vol. 144, No. 1, 2010, pp. 198-202. doi:10.1016%2Fj.snb.2009.10.066
- T. Li, Y. Zhou, J. Sun and K. Wu, “Ultrasensitive Detection of Glyphosate Using CdTe Quantum Dots in SolGel-Derived Silica Spheres Coated with Calixarene as Fluorescent Probes,” American Journal of Analytical Chemistry, Vol. 3, No. 1, 2012, pp. 12-18.
- Z. Zhao, T. M. Dansereau, M. A. Petrukhina and M. A. Carpenter, “Nanopore-Array-Dispersed Semiconductor Quantum Dots as Nanosensors for Gas Detection,” Applied Physics Letters, Vol. 97, No. 11, 2010, Article ID: 113105.
- F. Seker, K. Meeker, T. F. Kuech and A. B. Ellis, “Surface Chemistry of Prototypical Bulk II-VI and III-V Semiconductors and Implication for Chemical Sensing,” Chemical Reviews, Vol. 100, No. 7, 2000, pp. 2505-2536. doi:10.1021%2Fcr980093r
- R. De Angelis, M. Casalboni, F. Hatami, A. Ugur, W. T. Masselink and P. Prosposito, “Vapour Sensing Properties of InP Quantum Dot Luminescence,” Sensors and Actuators B: Chemicals, Vol. 162, No. 1, 2012, pp. 149-152. doi:10.1016%2Fj.snb.2011.12.052
- R. De Angelis, L. D’Amico, M. Casalboni, F. Hatami, W. T. Masselink and P. Prosposito, “Surface InP Quantum Dots: Effect of Morphology on the Photoluminescence Sensitivity,” Procedia Engineering, Vol. 47, 2012, pp. 1251-1254. doi:10.1016%2Fj.proeng.2012.09.380
- K. Hestroffer, J. W. Tomm, A. Ugur, R. Braun and F. Hatami, “Properties and Carrier Dynamics of Surface InP/In0.48Ga0.52P Quantum Dots Grown by Gas-Source Molecular Beam Epitaxy,” E-MRS 2011, Symposium G, Nice, 2011.
- A. R. Goñi, C. Kristukat, F. Hatami, S. Dreßler, W. T. Masselink and C. Thomsen, “Electronic Structure of SelfAssembled InP/GaP Quantum Dots for High Pressure Photoluminescence,” Physical Reviews B, Vol. 67, No. 7, 2003, Article ID: 075301. doi:10.1103%2FPhysRevB.67.075306
- F. Hatami, W. T. Masselink, L. Schrottke, J. W. Tomm, V. Talalaev, C. Kristukat and A. R. Goñi, “InP Quantum Dots Embedded in GaP: Optical Properties and Carrier Dynamics,” Physical Reviews B, Vol. 67, No. 8, 2003, Article ID: 85306. doi:10.1103%2FPhysRevB.67.085306
- A. Ugur, F. Hatami, W. T. Masselink, A. N. Vamivakas, L. Lombez and M. Atature, “Single-Dot Optical Emission from Ultralow Density Well-Isolated InP Quantum Dots,” Applied Physics Letters, Vol. 93, No. 14, 2008, Article ID: 143111.
- A. Ugur, F. Hatami, M. Schmidbauer, M. Hanke and W. T. Masselink, “Self-Assembled Chains of Single Layer InP/(In,Ga)P Quantum Dots on GaAs (001),” Journal of Applied Physics, Vol. 105, No. 12, 2009, Article ID: 124308.
- A. Ugur, F. Hatami, A. N. Vamivakas, L. Lombez, M. Atatüre, K. Volz and W. T. Masselink, “Highly Polarized Self-Assembled Chains of Single-Layer InP/(In,Ga)P Quantum Dots,” Applied Physics Letters, Vol. 97, No. 25, 2010, Article ID: 253113.
- A. Ugur, F. Hatami and W. T. Masselink, “Controlled Growth of InP/In0.48Ga0.52P Quantum Dots on GaAs Substrate,” Journal of Crystal Growth, Vol. 323, No. 1, 2011, pp. 228-232. doi:10.1016%2Fj.jcrysgro.2011.01.033
- Gwyddion, Free SPM (AFM, SNOM/NSOM, STM, MFM, …), “Data Analysis Software,” http://gwyddion.net/
- National Institute of Standards and Technology. http://www.nist.gov/index.html
- M. G. Bawendi, P. J. Carrol, W. L. Wilson and L. E. Brus, “Luminescence Properties of CdSe Quantum Crystallites: Resonance between Interior and Surface Localized States,” Journal of Chemical Physics, Vol. 96, No. 2, 1992, pp. 946-954. doi:10.1063%2F1.462114
- X. Wang, L. Qu, J. Zhang, X. Peng and M. Xiao, “Surface-Related Emission in Highly Luminescent CdSe Quantum Dots, ” Nano Letters, Vol. 3, No. 8, 2002, pp. 1103-1106. doi:10.1021/nl0342491
- R. De Angelis, L. D’Amico, M. Casalboni, F. Hatami, W. T. Masselink and P. Prosposito, “Photoluminescence Sensitivity to Methanol Vapours of Surface InP Quantum Dot: Effect of Dot Size and Coverage,” Sensors and Actuators B: Chemicals. doi:0.1016/j.snb.2013.01.057
NOTES
*Corresponding author.