Journal of Sensor Technology
Vol.2 No.1(2012), Article ID:17910,7 pages DOI:10.4236/jst.2012.21001
Sensing of Moisture Content of In-Shell Peanuts by NIR Reflectance Spectroscopy
1United States Department of Agriculture, Agricultural Research Service, National Peanut Research Laboratory, Dawson, USA
2Bio-Systems Engineering, University of Nebraska, Lincoln, USA
Email: *chari.kandala@ars.usda.gov
Received October 21, 2011; revised December 1, 2011; accepted January 10, 2012
Keywords: In-Shell Peanuts; NIR Spectroscopy; Pretreatments; Partial Least Square; Standard Error of Prediction; Relative Percent Deviation
ABSTRACT
It was found earlier that moisture content (MC) of intact kernels of grain and nuts could be determined by Near Infra Red (NIR) reflectance spectrometry. However, if the MC values can be determined while the nuts are in their shells, it would save lot of labor and money spent in shelling and cleaning the nuts. Grain and nuts absorb low levels of NIR, and when NIR radiation is incident on them, a substantial portion of the radiation is reflected back. Thus, studying the NIR reflectance spectra emanating from in-shell peanuts, an attempt is made for the first time to determine the MC of in-shell peanuts. In-shell peanuts of two different market types, Virginia and Valencia, were conditioned to different moisture levels between 6% and 26% (wet basis), and separated into calibration and validation groups. NIR absorption spectral data from 1000 nm to 2500 nm in 1 nm intervals were collected from both groups. Measurements were obtained on 30 replicates within each moisture level. Reference MC values for each moisture level in these groups were obtained using standard air-oven method. Partial Least Square (PLS) analysis was performed on the calibration data, and prediction models were developed. The Standard Error of Calibration (SEC), and R2 of the calibration models were computed to select the best calibration model. The selected models were used to predict the moisture content of peanuts in the validation sets. Predicted MC values of the validation samples were compared with their standard air-oven moisture values. Goodness of fit was determined based on the lowest Standard Error of Prediction (SEP) and highest R2 value obtained for the prediction models. The model, with reflectance plus normalization spectral data with an SEP of 0.74 for Valencia and 1.57 for Virginia type in-shell peanuts was selected as the best model. The corresponding R2 values were 0.98 for both peanut types. This work establishes the possibility of sensing MC of intact in-shell peanuts by NIR reflectance method, and would be useful for the peanut and allied industries.
1. Introduction
Accurate measurement of peanut moisture content (MC) is critical in marketing, storing, and processing of peanuts [1]. Typically, peanuts are marketed after partially drying in the windrow and then further drying mechanically till the moisture content drops to 10.5% or lower. Storing the peanuts with higher moisture concentration increases the risk of microbial growth and may give raise to aflatoxin [2] contamination during storage. Over the years, several methods for MC measurement of peanuts were developed. Moisture sensing by DC conductance or resistance are common in Japan, and some other countries. Capacitance sensing is another common method, and presently available for peanuts. These instruments use capacitance measurements at a single RF frequency to estimate the MC. In this method, the capacitance of a peanut kernel sample of 300 g to 500 g is measured and the average MC value of the bulk sample is predicted from this. These moisture meters require the peanuts to be shelled and cleaned before the measurements could be done.
Techniques using near infrared (NIR) spectroscopy for food quality measurements are becoming more popular in food processing and quality inspection of agricultural commodities. Norris and Butler [3] investigated the properties of biological materials such as grains, using light scattering. Later they used the NIR transmittance through carbon tetrachloride or methanol slurries to measure the moisture content in grains and seeds [4]. Application of NIR reflectance spectroscopy to grain moisture sensing was made possible, after the problems arising due to scattering and interference could be handled using multiple regression techniques [5]. While there are commercial NIR instruments available that can measure the MC of intact kernels of nuts and grains of small size, such as wheat and corn, there do not seem to be any for larger size kernels like peanuts. It was found earlier that NIR reflectance method could be used to determine the MC of peanut kernels [6]. It would be very useful to the peanut industry if the NIR reflectance method could be used for determining the MC of peanuts while they are in their shells.
NIR spectroscopy was found to suit well for measurement of MC, since water O-H group overtone and combination bands are pronounced in this region of the spectrum. Water is a strong absorber in the NIR region, and samples with high water content are strongly dominated by the signature from water. NIR is readily adaptable and the low intensities of NIR absorptions permit the direct measurement of water, over wide concentration ranges in solid samples. Spectra obtained using NIR spectroscopy contain absorbance bands which are mainly due to three chemical bonds; the C-H bond, usually associated with fats and oil, the O-H bonds found with water, and the N-H bond, found in protein [7]. Other chemical bonds may appear in overtone bands in NIR region, but they are generally too weak to consider for analysis of complex food systems which contain water, oil, fat and protein. NIR spectroscopy needs minimal sample preparation, and has been used successfully in many other crops including soybean [8], sunflower [9], rape seeds [10], canola [11], and flax seeds [12], for oil analysis. NIR has also been used to determine oleic and linoleic fatty acid concentrations in individual peanut kernels [13]. In the work presented here an attempt was made, for the first time, to predict the MC of in-shell peanuts using NIR reflectance method. The primary objectives of this research are:
1) To develop calibration models to predict the moisture content of in-shell peanuts using a custom made NIR reflectance spectroscope.
2) To validate the developed calibration models by using them on unknown validation set of samples.
3) To check the suitability of the method, for MC prediction on in-shell peanuts of two different market types.
2. Materials and Methods
2.1. Basic Principles of NIR
Near infrared region is lying between the visible light region and the infrared region in the wavelengths between 730 nm and 2500 nm. When infrared radiation is incident on the sample, light is absorbed selectively according to a certain frequency of vibration of the molecules in the sample. In the region extending beyond 2500 nm, called the mid infrared region, the spectra obtained consists of sharp absorption bands that are useful to identify the organic compounds. However, because of the low signal to noise ratio they exhibit, they are not suitable for qualitative analysis of many food materials. NIR region is characterized by overtone and combination bands of fundamental vibrations that are occurring in the mid infrared region. All organic molecules have absorption bands in the NIR region. Since the hydrogen atom has light mass, overtones and combination bands of hydrogen bearing functional groups like C-H, O-H, N-H, COOH etc dominate in the NIR region. These show broad and overlapping bands that are not much suitable for structural studies but have advantages in the quantitative analysis of major components [14]. NIR instruments have very high signal to noise ratio. The spectral information is repeated as overtones and combination bands. The intensity of these bands is less towards the shorter wavelengths. However, the absorptivity of NIR bands is much lower than the mid-infrared bands, enabling the NIR radiation to penetrate deeper into a sample, and providing a much better opportunity to analyze the constituents of the sample. In the NIR spectroscopic process, the samples do not need to be diluted to lower concentration levels.
When the NIR radiation interacts with the sample it may be absorbed, transmitted or reflected. According to the Beer-Lambert law, the concentration of the component is directly proportional to the absorbance of the sample. It can be written as:
 (1)
(1)
where, al is the absorbance at wavelength, l, el is the molar absorption coefficient at the wavelength l, and b is the path length and c is the concentration of the absorbing component. The molar absorption coefficient (el) can be determined by measuring the absorbance of a calibration standard with known concentrations of the components of interest.
This fundamental relationship is relevant not only to the transmission measurements, but also in diffuse reflectance measurements. In absorption spectroscopy the radiation path length is kept constant. Scattering of incident radiation occurs in Transmittance and diffuse reflectance processes. Scattering is a function of the physical properties of the sample such as, particle size, surface texture, moisture content and temperature. Diffuse reflectance phenomenon is commonly used for qualitative analysis in the NIR region from 1100 nm to 2500 nm, and transmittance measurements are used in the region from 800 nm to 1100 nm.
2.2. In-Shell Peanut Sample Preparation
Approximately 50 kg of Virginia and Valencia type inshell peanuts (pods) were used to prepare the sub-samples with different MC values. The initial MC1 of the peanut pods was determined using the time/temperature protocol specified in the standard air-oven method [15]. A sample of in-shell peanuts that filled the sample holder (Petridish) weighed about 100 g. Peanut samples were placed in aluminum dishes and weighed. The dishes were then placed in an air oven and heated at 130˚C for 4 to 6 hours depending on the initial MC of the peanut samples. At the end of the drying time, the sample dishes were removed from the oven, allowed to reach the room temperature in a desiccator, and weighed. The percentage MC of the peanut sample was calculated and expressed as percentage MC on wet weight basis (w.b).
The initial MC of both Virginia and Valencia peanuts was about 6%. These peanut lots were divided into 12 Valencia and 15 Virginia sub-lots and each was placed in a separate air tight plastic container. Appropriate quantities of water were added to each container, to raise the moisture levels in steps of 2%. The containers were sealed and allowed to equilibrate at 4˚C for one week. The containers were periodically rotated during this period to allow uniform moisture distribution. This resulted in 12 and 15 moisture levels for Valencia and Virginia type peanuts respectively, in the moisture range of 6% to 26%. After a week, the containers were removed from cold storage and allowed to equilibrate to room temperature before taking the NIR measurements. The final MC of each sub-lot after the equilibration was determined, using the air-oven method described above, for three 100 g sub-samples from each sub-lot. The average of the three replicates was taken as the MC of each sub-lot (reference value) and each sub-lot was labeled accordingly.
2.3. NIR Spectral Measurements
The peanut pod samples, after conditioning, were separated into calibration and validation groups. NIR spectral measurements were made using a custom made NIR reflectance spectroscope with integrated sphere system. The optical system consists of a Michelson interferometer and five 12 V Osram2, Ministar bulbs as the light source. The detector is a 10 mm In Ga As type, usable in the wave length range between 800 nm and 2600 nm but with good sensitivity between 1000 nm and 2500 nm. The spectroscope offers resolutions of 2, 4, 8 and 16 cm–1. Spectral data were collected using software in SPC format. Each replicated sample consisted of 100 g - 200 g of in-shell peanuts in a Petridish kept under the NIR light source. The room temperature during the measurements was kept steady between 21˚C and 23˚C. NIR radiation was focused on the sample, where it would penetrate and interact with the sample, and then reflected. The reflected energy spectrum was collected and recorded over the wavelength range of 1000 nm to 2500 nm. Spectral data were collected for 30 replicates at each moisture level for both types of in-shell peanuts. Shown in Figure 1 is the NIR instrument used for measurements.
2.4. Spectral Data Analysis
NIR spectral data were analyzed using multivariate data analysis software (Unscrambler Version 9.7 CAMO ASA, USA). Reflection values of the spectra between 1000 nm and 2500 nm were taken as independent variables and the MC of the sample as the dependent variable for the analysis. The reflectance spectra of the calibration samples were used for the development of the calibration models. Partial least square (PLS) regression analysis was performed on the calibration set of peanuts to develop an empirical equation, suitable to estimate the moisture content. Before analyzing the data, certain mathematical pretreatments were given to the raw reflectance spectral data for improving the resolution of the individual spectra. Pretreatment makes the spectral information data more appropriate for statistical analysis to get relevant results. The pretreatments applied were maximum normalization, first derivative with respect to wavelength, and combination of normalization and derivative. PLS analysis was performed on both raw spectral data and pretreated data to develop four different calibration models. The best calibration model was identified based on Standard Error of Calibration (SEC)3 and coefficient of multiple determinations (R2). The pre-treatment and corresponding PLS models were then used to predict the peanut moisture content of the validation group of peanuts. Goodness of fit was evaluated based on the Standard Error of Prediction (SEP)4 obtained by comparing the reference (standard air-oven measured) MC values with those predicted by the models.
3. Results and Discussion
Strong NIR absorption bands near 1400 nm - 1440 nm and 1900 nm - 1950 nm have often been applied to the quantitative analysis of water concentration in foods. Absorption bands at 1454 nm are related with O-H stretch overtone bond, and at 1940 nm related with O-H bonds, which are mainly related with moisture concentration. Figures 2 and 3 show the representative graphs of primary NIR spectra for the in-shell peanuts of Virginia and
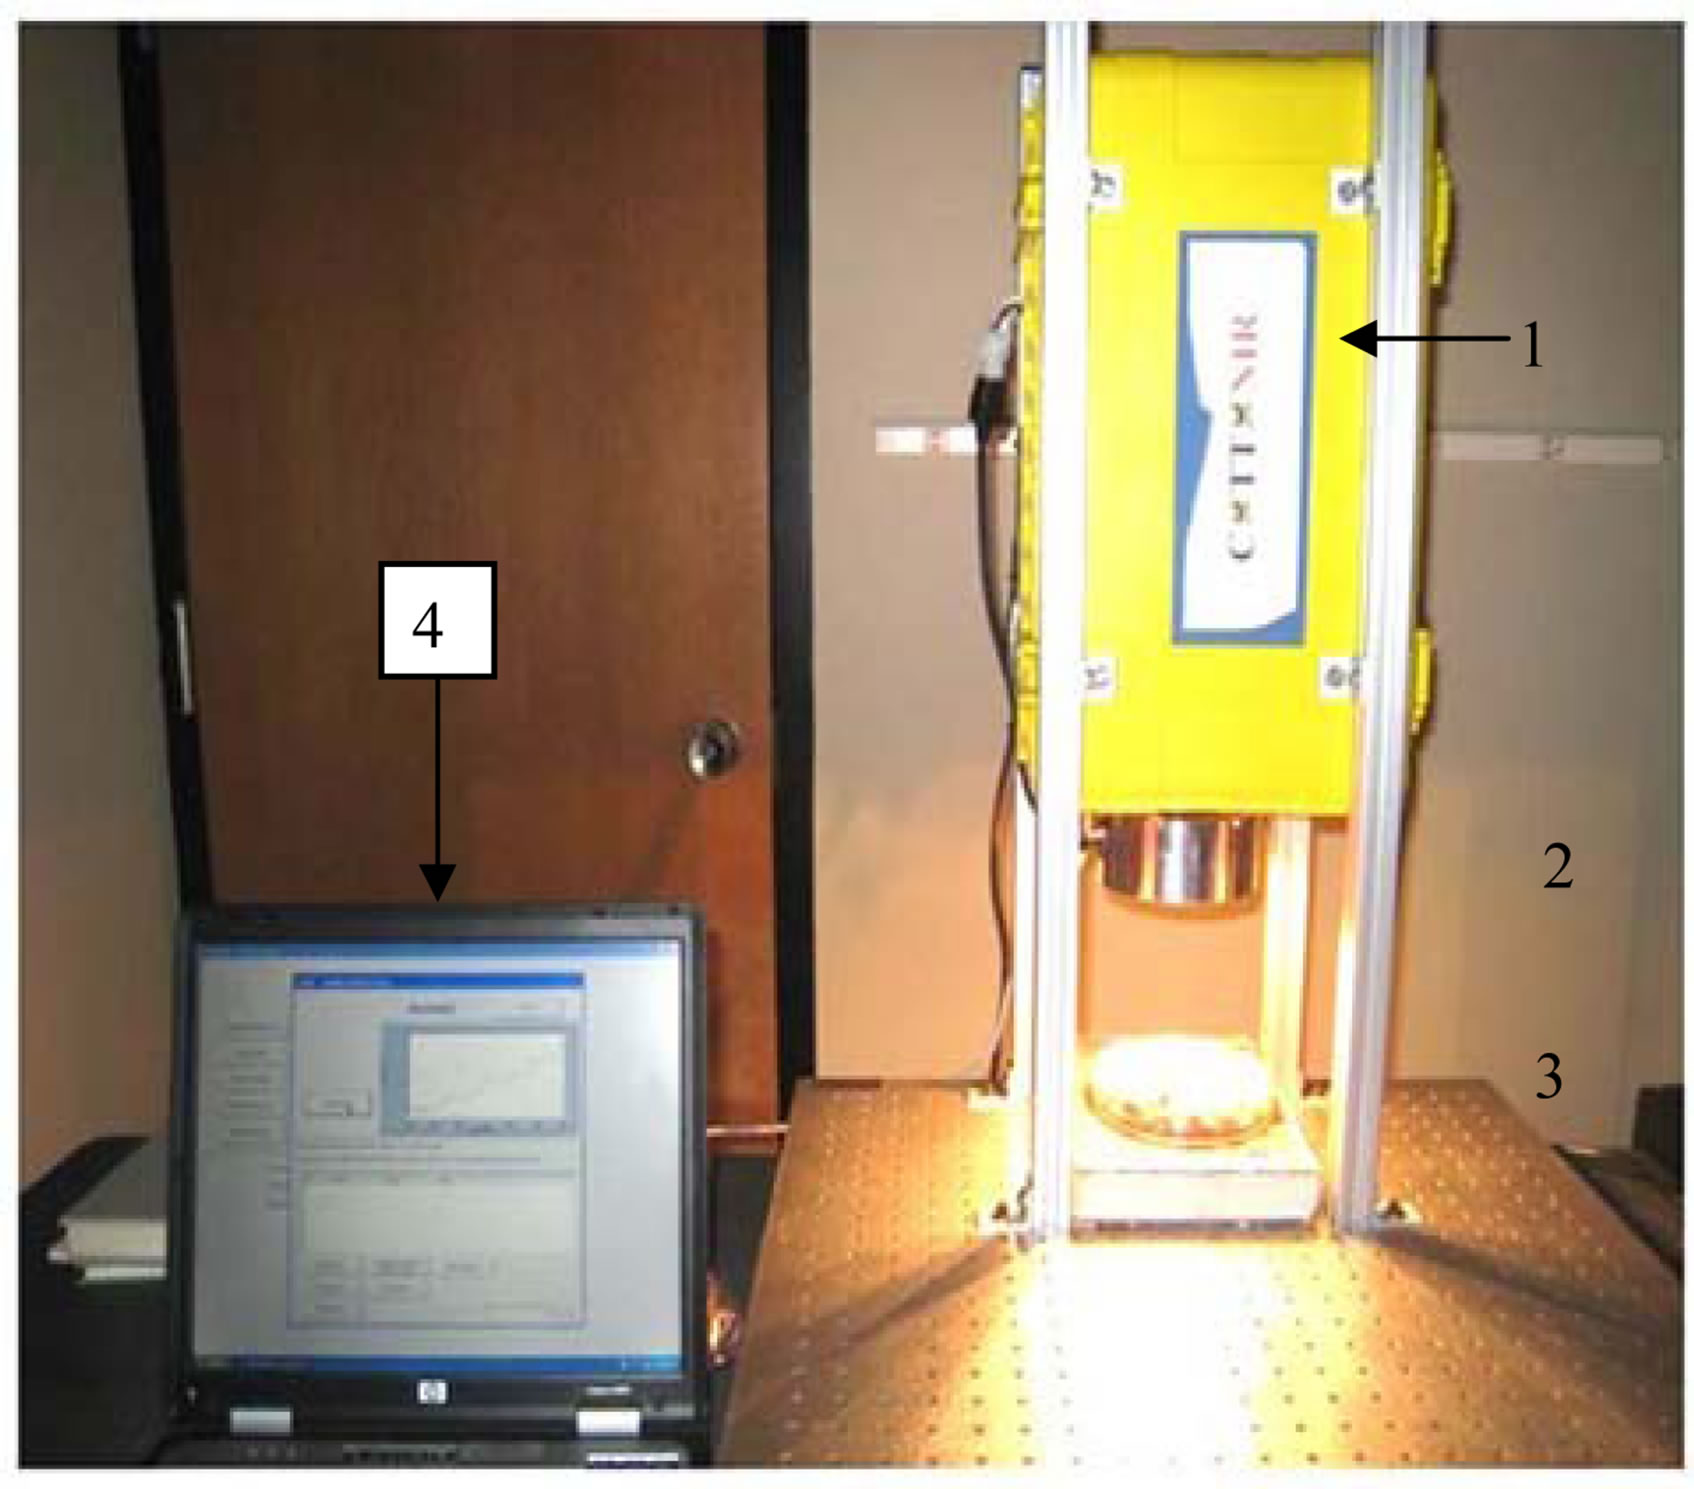
Figure 1. Experimental set up of NIR instrument: 1. Spectrometer; 2. Light source; 3. Petridish with peanuts; 4. Computer.
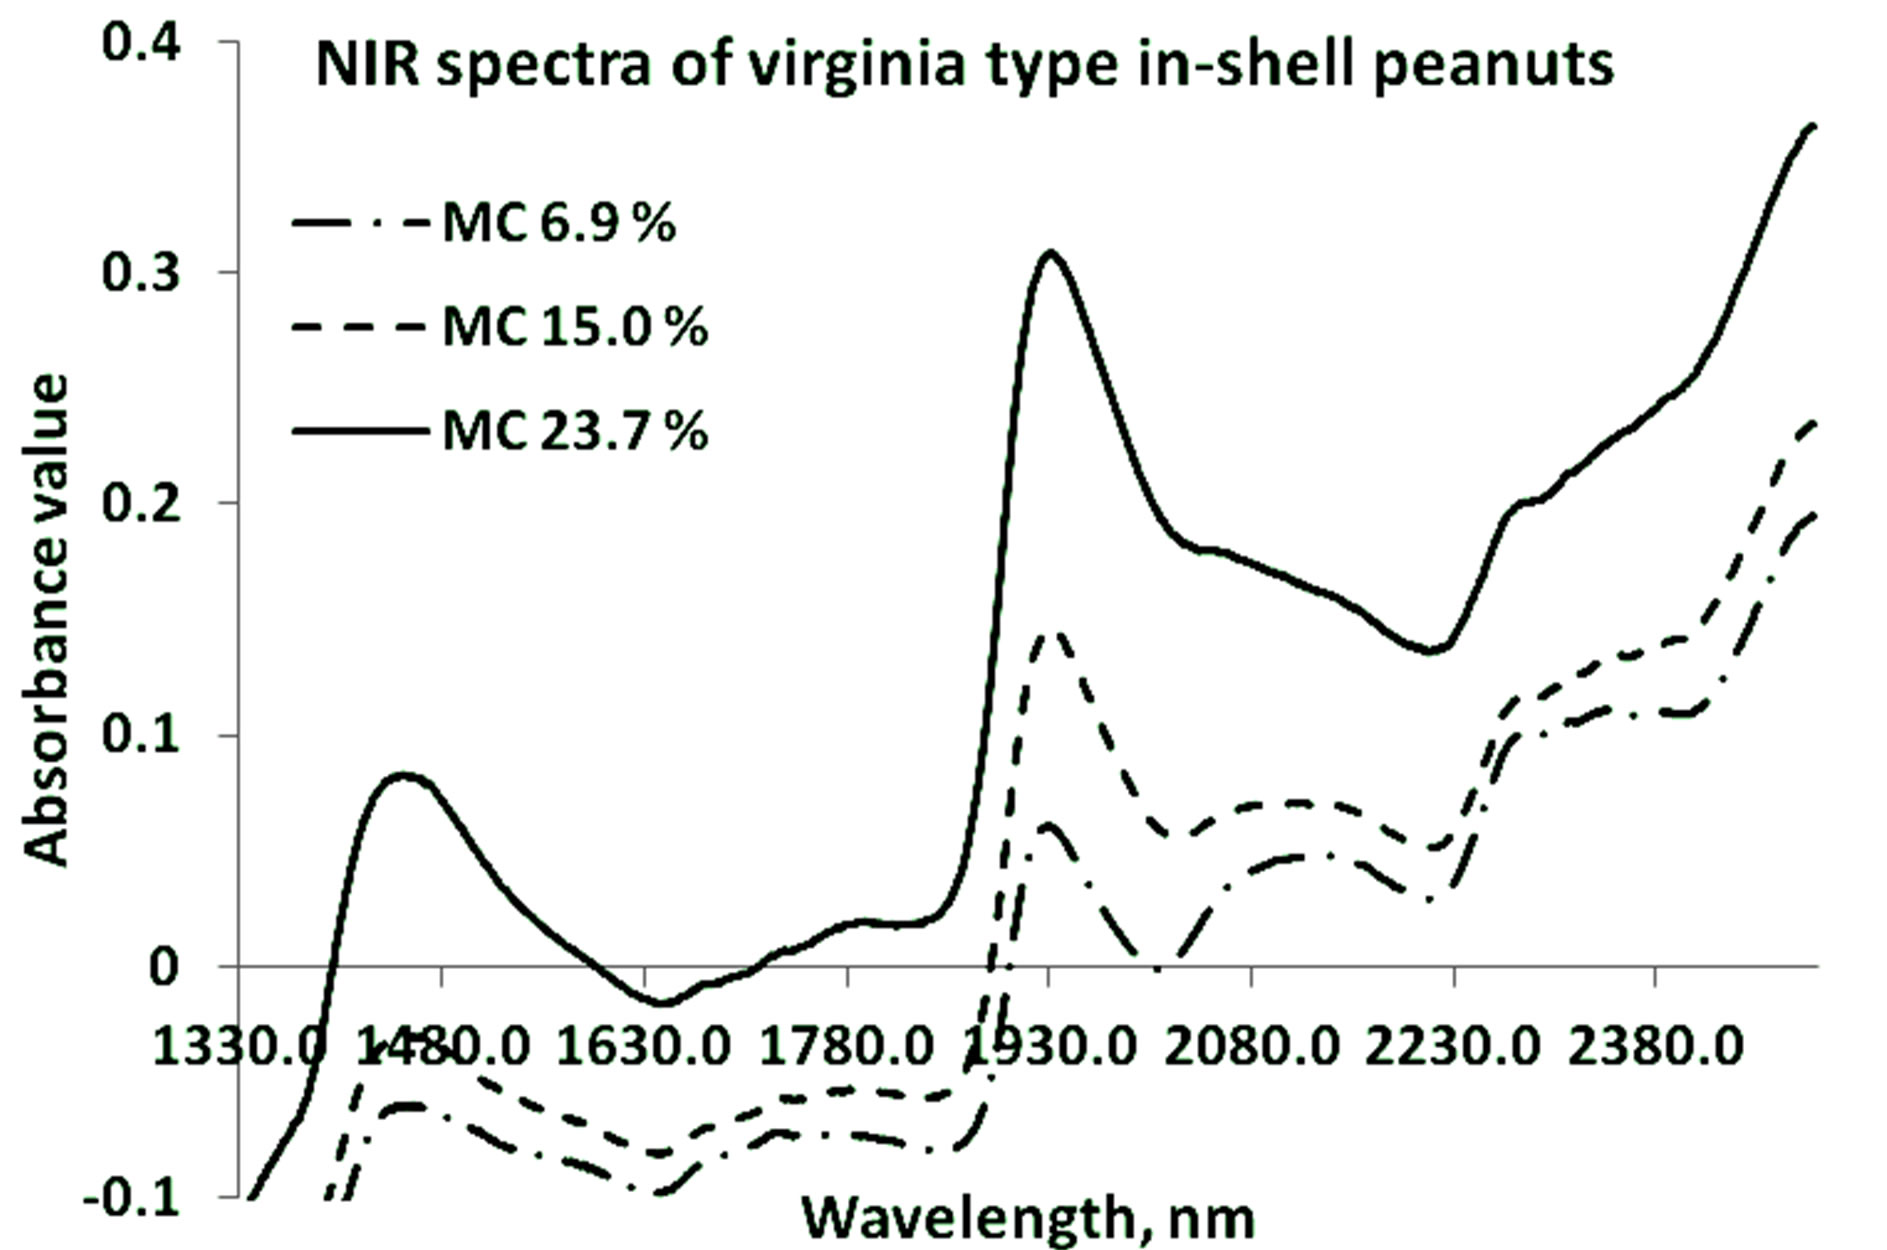
Figure 2. NIR specra of Virginia type in-shell peanuts at three different mositure levels.
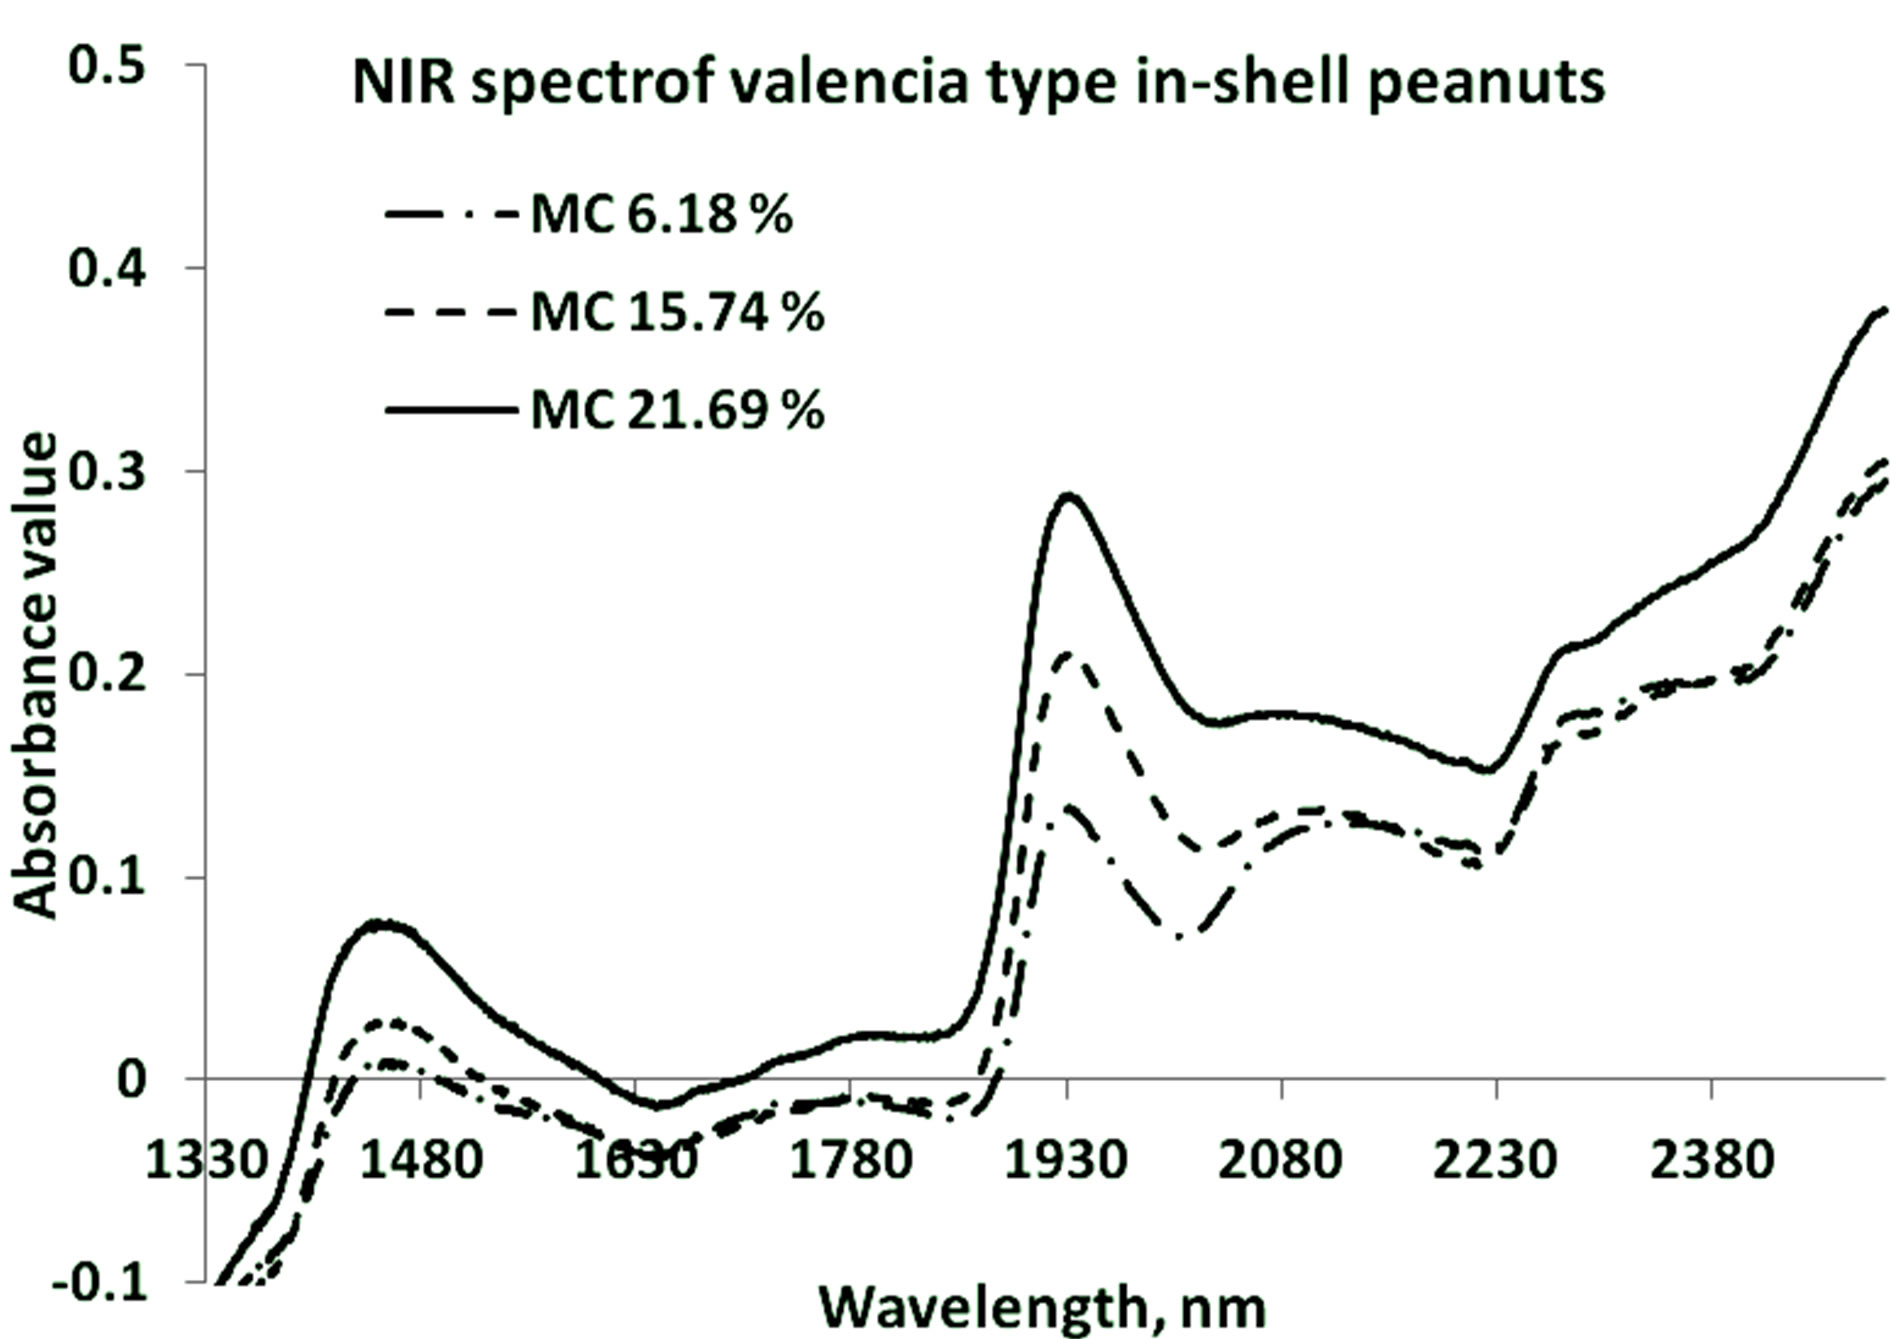
Figure 3. NIR specra of Valencia type in-shell peanuts at three different mositure levels.
Valencia types respectively at three different moisture content levels. Both types of peanuts show similar spectral peaks. The occurrence of the water peaks is similar for both types. The spectral signature for protein (around 2080 nm - 2230 nm) can also be seen.
Figures 4 and 5 show the representative graphs of derivative NIR spectra, for the Valencia and Virginia inshell peanuts, respectively. Both types of peanuts also show similar spectral peaks in the derivative spectra. However more additional spectral signatures have appeared in these figures than in Figures 2 and 3. The first derivative spectra of both varieties have a trough, corresponding to each moisture concentration peak in the original absorption spectra. There are O-H bands in this figure that indicate moisture concentration at 1412 nm, 1902 nm and 1970 nm. Peaks for protein concentration at 2258 nm and 2458 nm could be better seen here, than in the raw NIR absorption spectra.
Shown in Tables 1 and 2 are the fitness measures for the calibration groups of Valencia and Virginia types of in-shell peanuts respectively. All four models in the calibration set of Valencia and Virginia type’s in-shell peanuts gave an R2 of 0.99 and an SEC of less than 2. The bias values were also low (Tables 1 and 2). The lowest SEC obtained for Valencia in-shell peanuts was 0.33, for
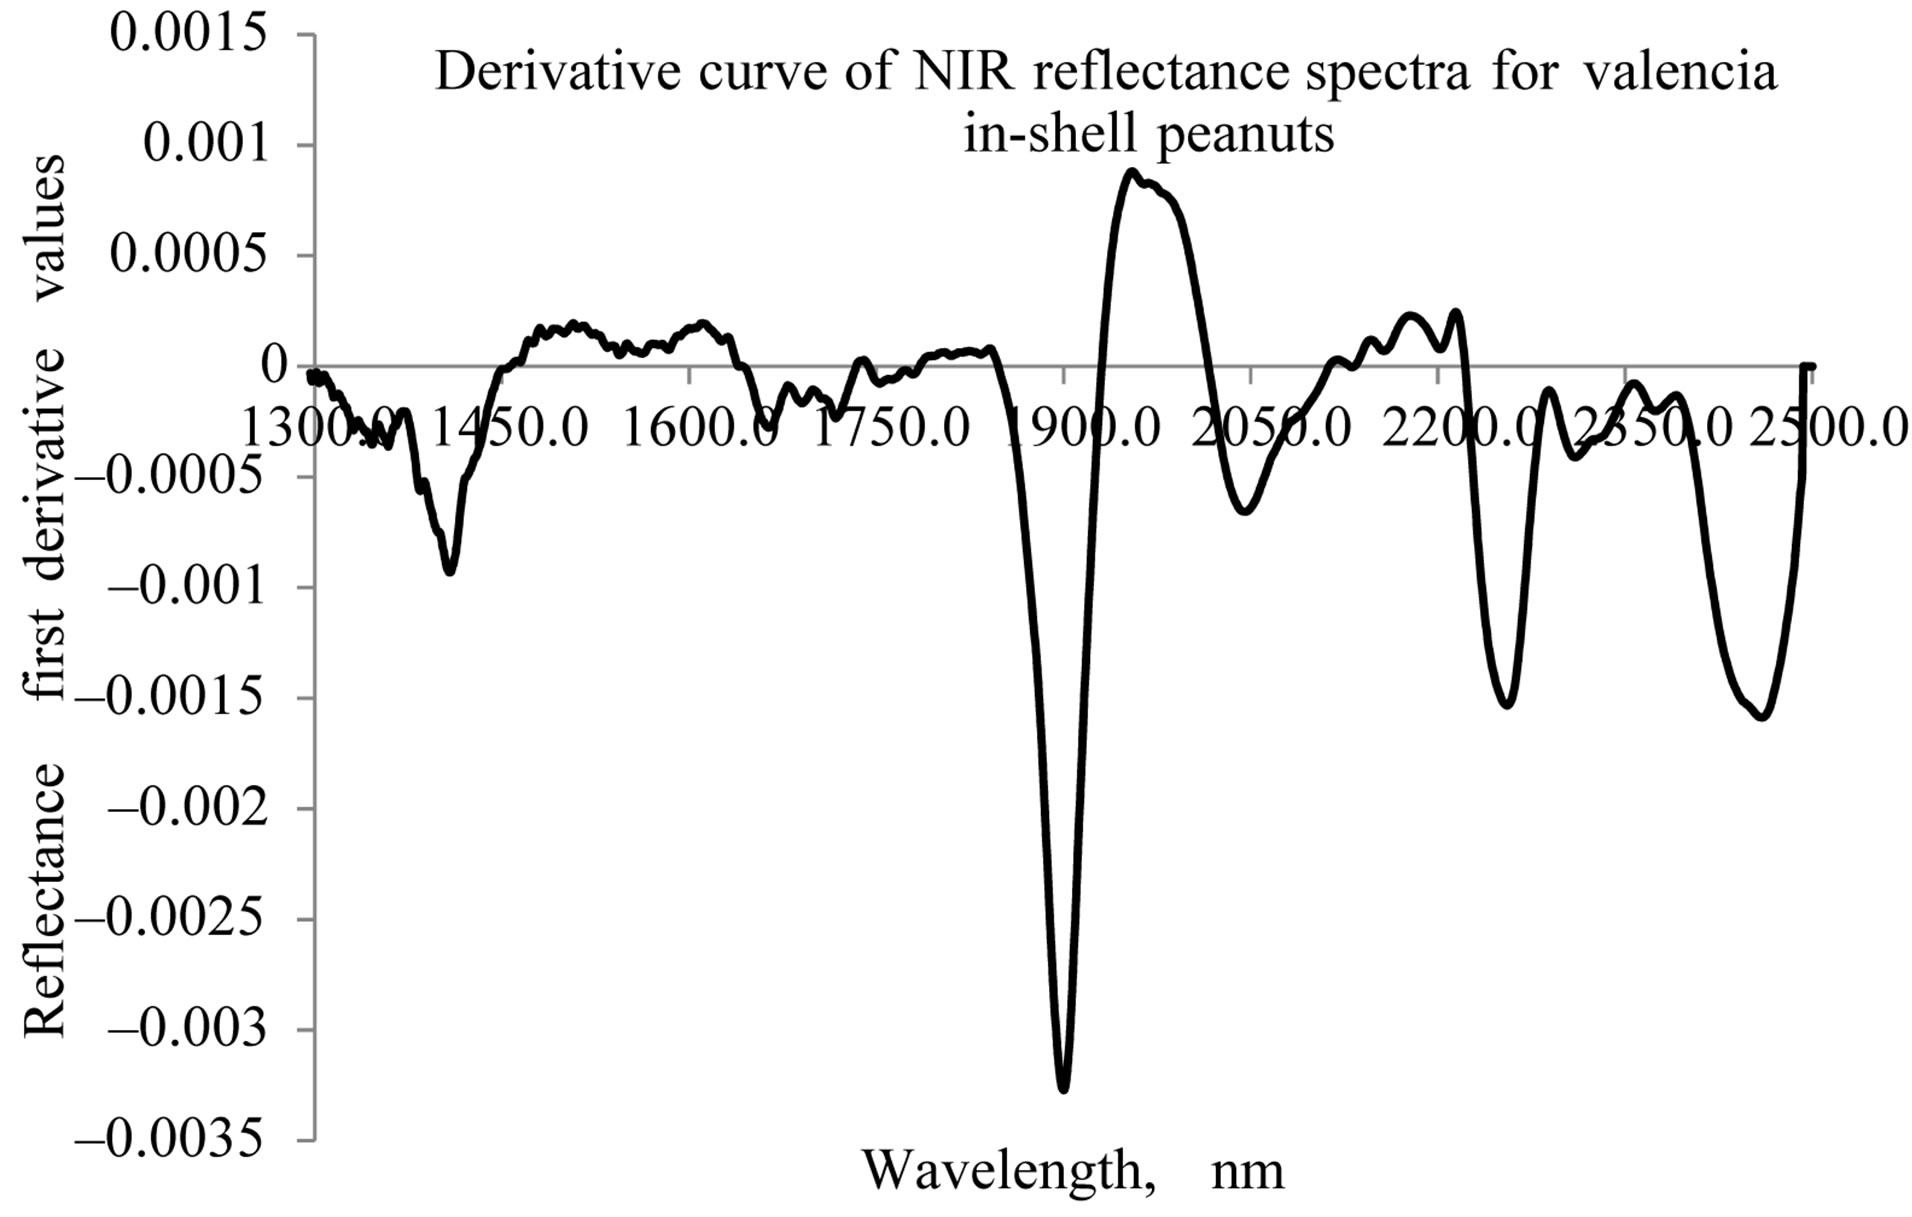
Figure 4. NIR derivative specra of Valencia type in-shell peanuts.
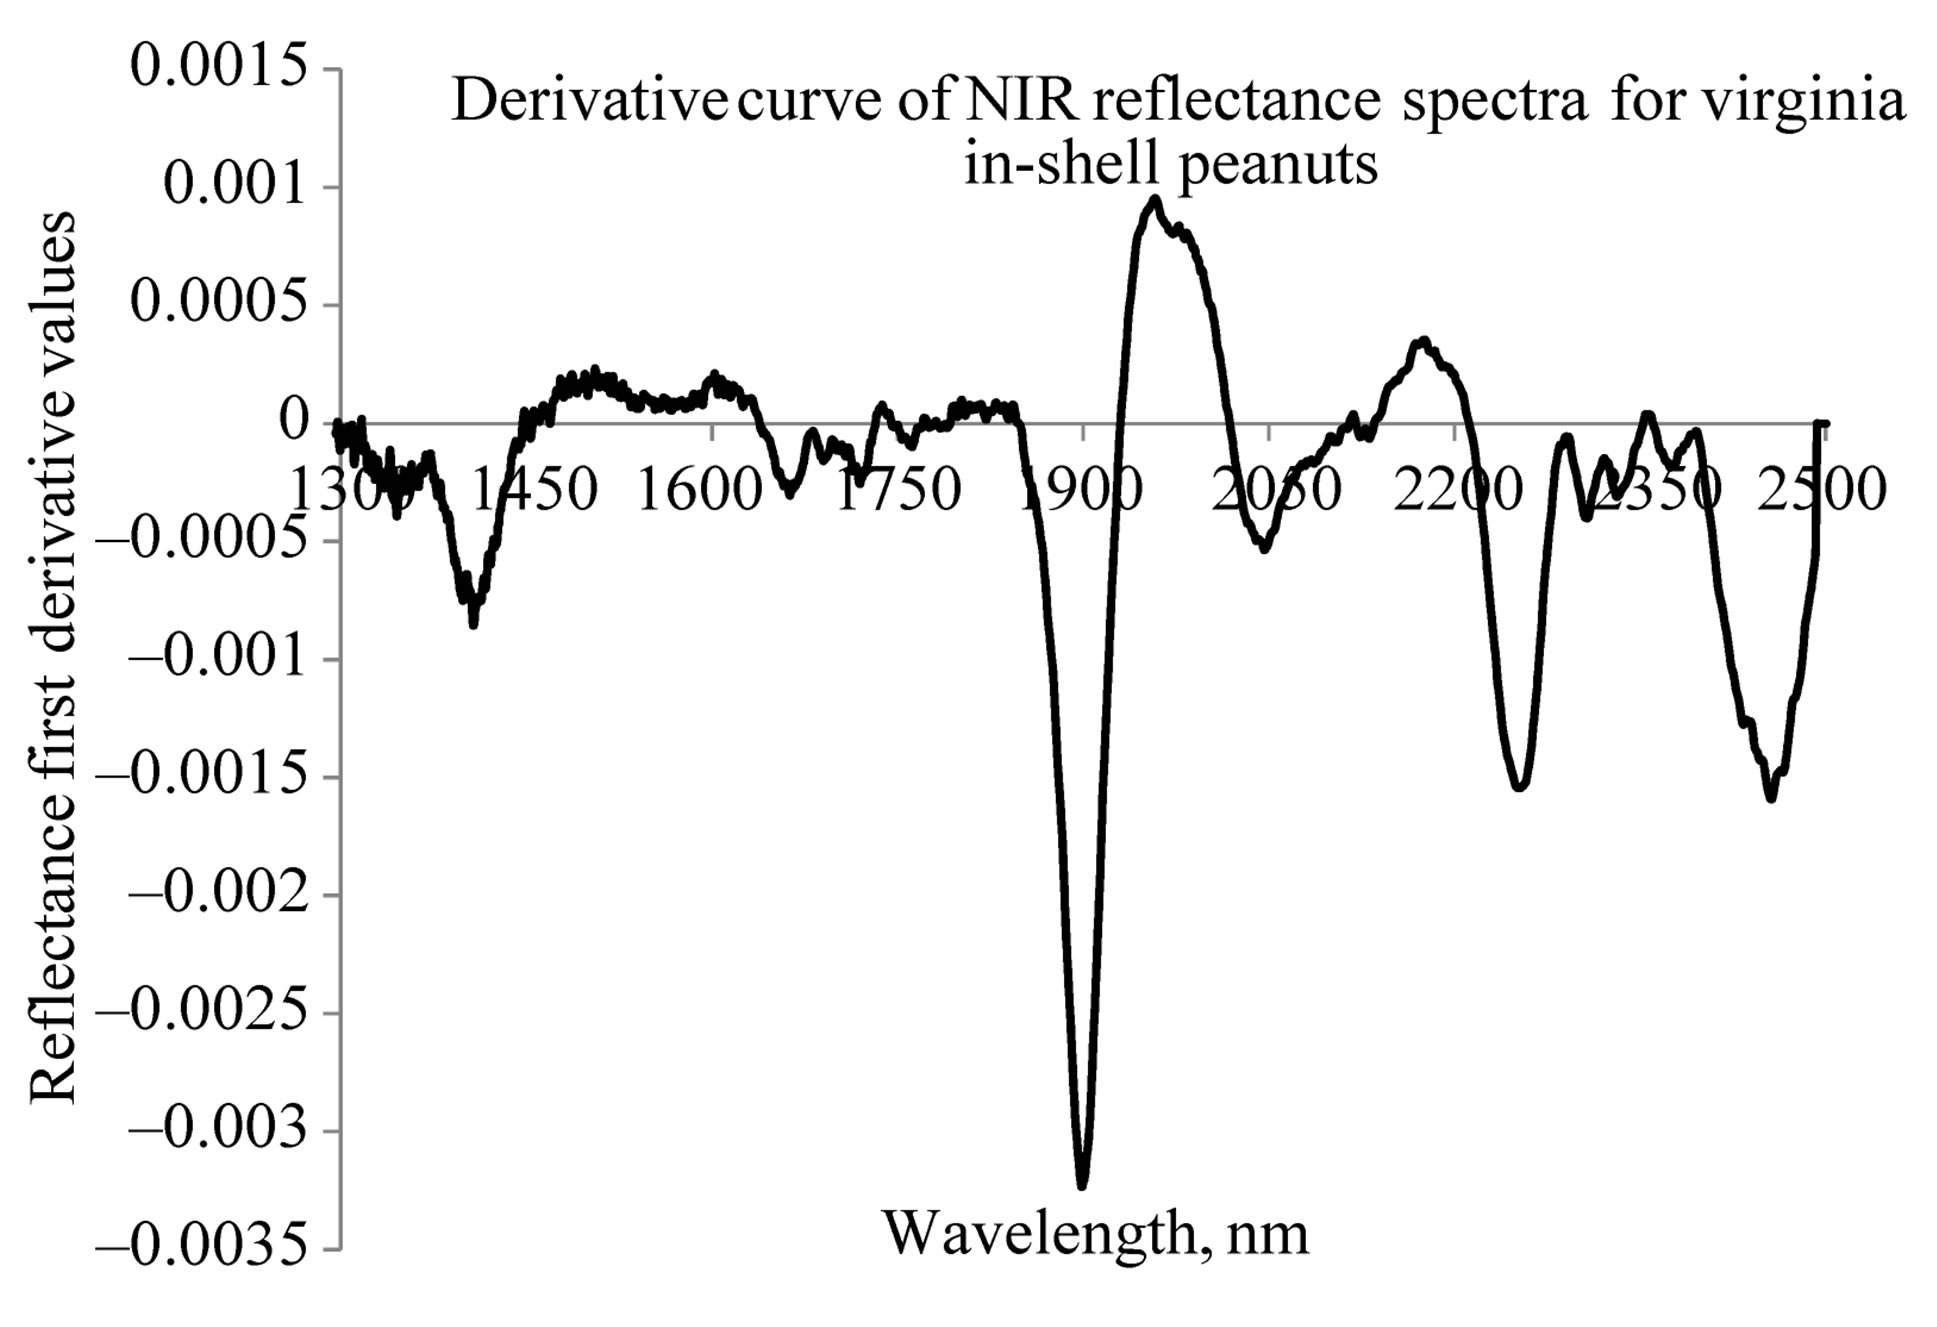
Figure 5. NIR derivative specra of Virginia type in-shell peanuts.
reflectance plus normalization model (model 3) with pretreated spectral data. Next to follow was the reflection raw data (model 1) that gave 0.39 SEC. Highest SEC value of 1.18 was obtained for reflectance plus derivative data (model 2). Since all the models gave good R2, bias, and SEC values they were all used for validation samples, to predict the moisture content. SEC values obtained for Virginia in-shell peanuts (Table 2) have an R2 value of 0.99. Lowest SEC of 1.51 was obtained for reflectance raw data model (model 1) and the highest for reflection plus derivative pretreated spectral data (model 2). In this case also, as all the models gave good R2, bias, and SEC values, all the four models were considered to predict the moisture content of the validation sets of Virginia inshell peanuts.
Table 3 shows the fitness measures of the validation set of samples, from the Valencia type for the various models developed using different pretreated and raw spectra. It can be seen that, the lowest SEP value of 0.74 was obtained for the model, reflectance plus normalization (model 3). It also had the highest R2 of 0.98. Based on this, model 3 was selected as the best fitted model for moisture content prediction of Valencia inshell peanuts. Table 4 shows the fitness measures of the validation set of Virginia type in-shell peanuts for the models developed using different pretreated and raw spectra. In case of Virginia in-shell peanuts, based on the values of R2, model 3 with reflection plus normalization pretreatment, which gave highest R2 of 0.98 among all the models with SEP of 1.57 and a bias of 0.19 was considered as the best model. The next good model was model 1, with reflectance raw spectral data. This model has an R2 of 0.95 and the lowest bias of –0.96 among all models, it has a SEP value of 1.93. By considering all three fitness measures, high R2, low SEP, and bias values model 3 with reflection plus normalization treatment was selected as the best model for prediction of moisture content of both types of in-shell peanuts.
Shown in Figure 6 are the moisture contents of the samples, predicted using the models with average spectra of each individual sample, and plotted against their standard air-oven values for Virginia type in-shell peanuts.
In Figure 7 similar results are shown for Valencia type in-shell peanuts. It can be seen that, the predicted mois-
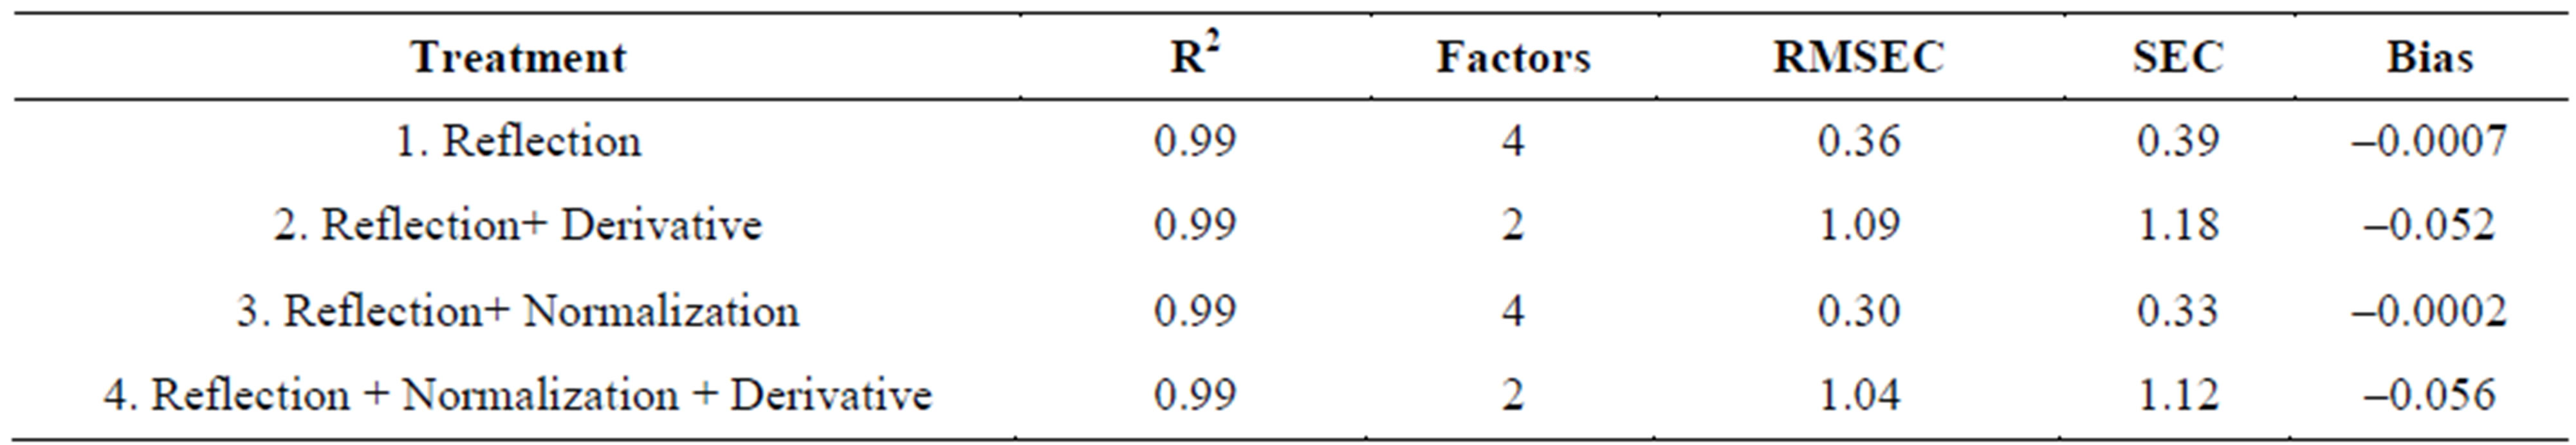
Table 1. Fitness measures for the calibration set: Valencia in-shell peanuts.
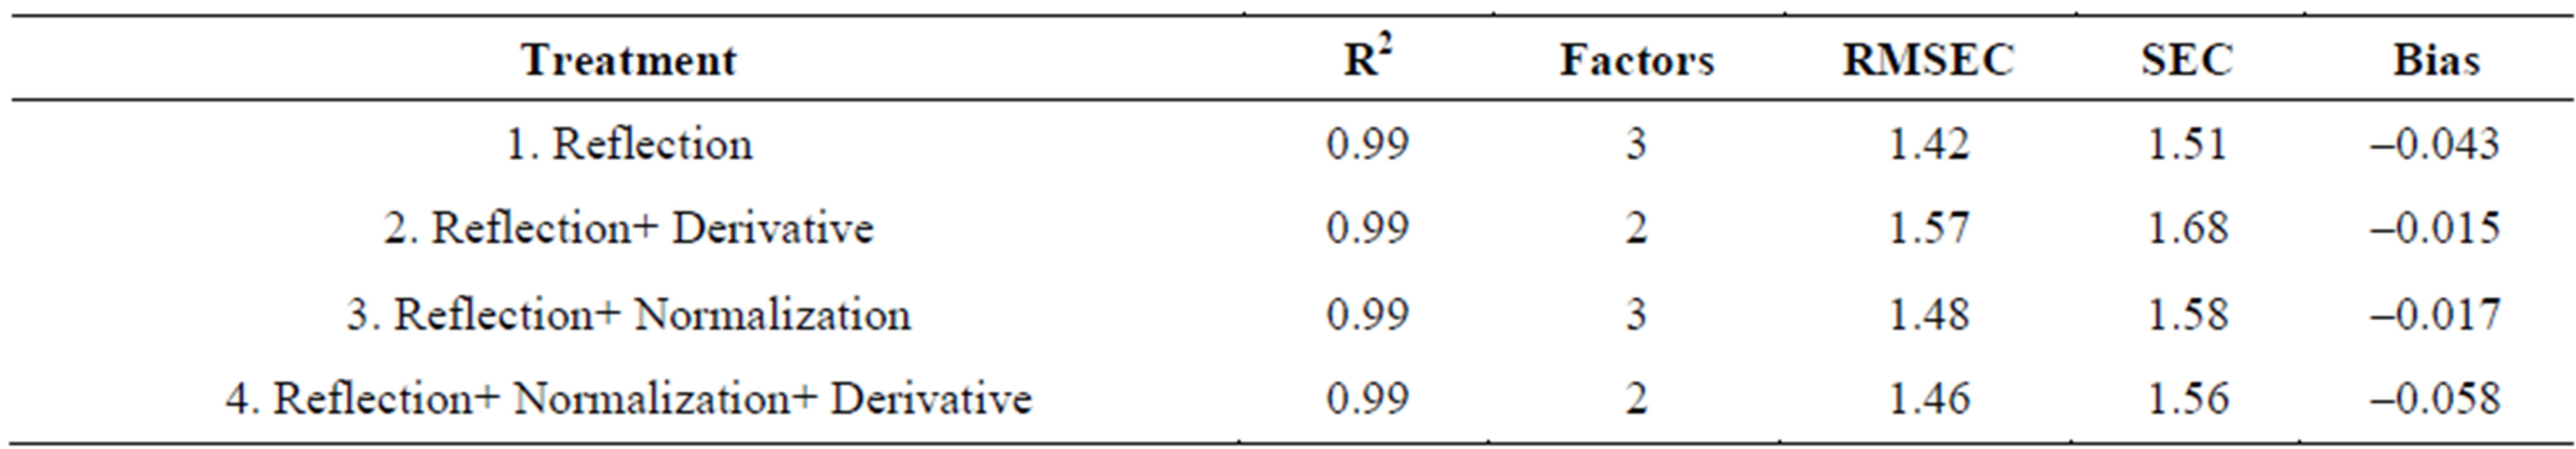
Table 2. Fitness measures for the calibration set: Virginia in-shell peanuts.
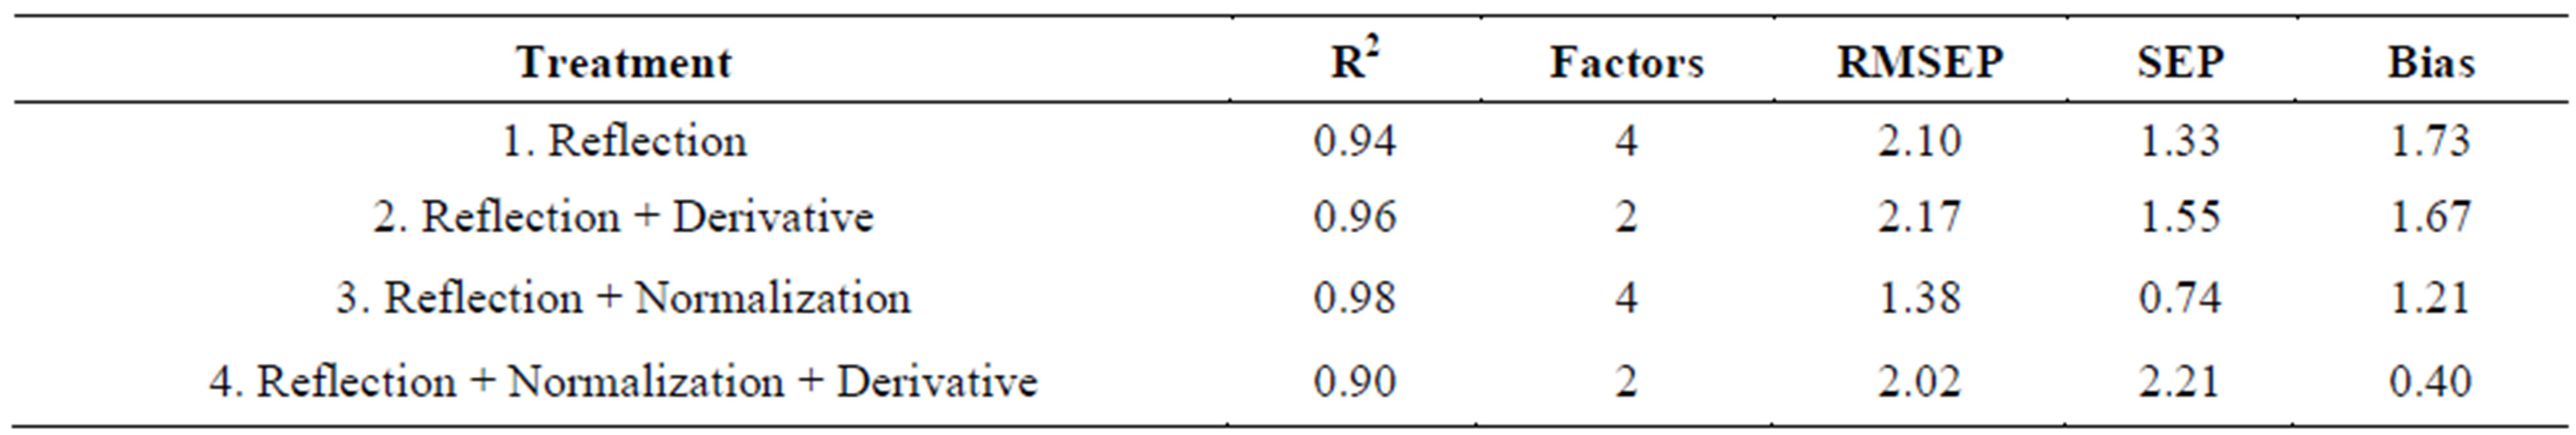
Table 3. Fitness measures for the validation set: Valencia in-shell peanuts.
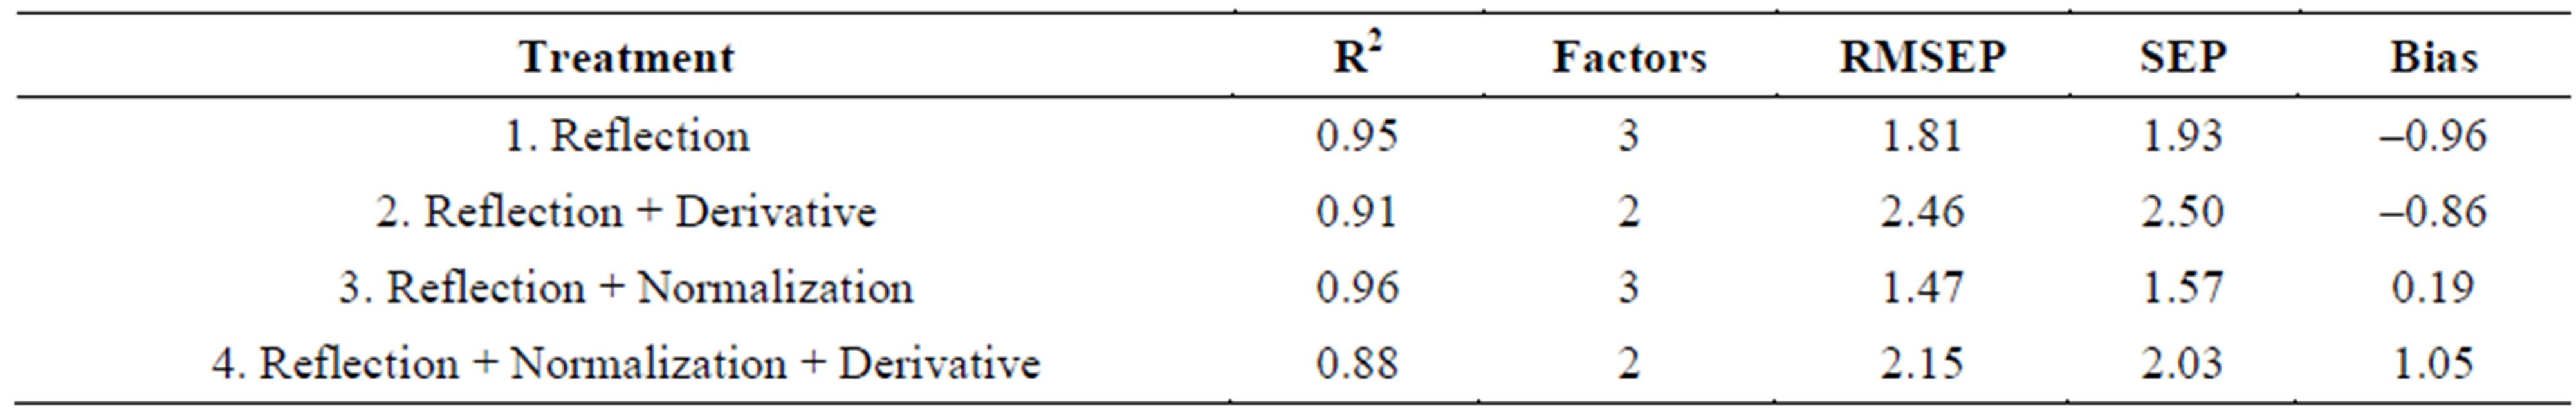
Table 4. Fitness measures for the validation set: Virginia in-shell peanuts.
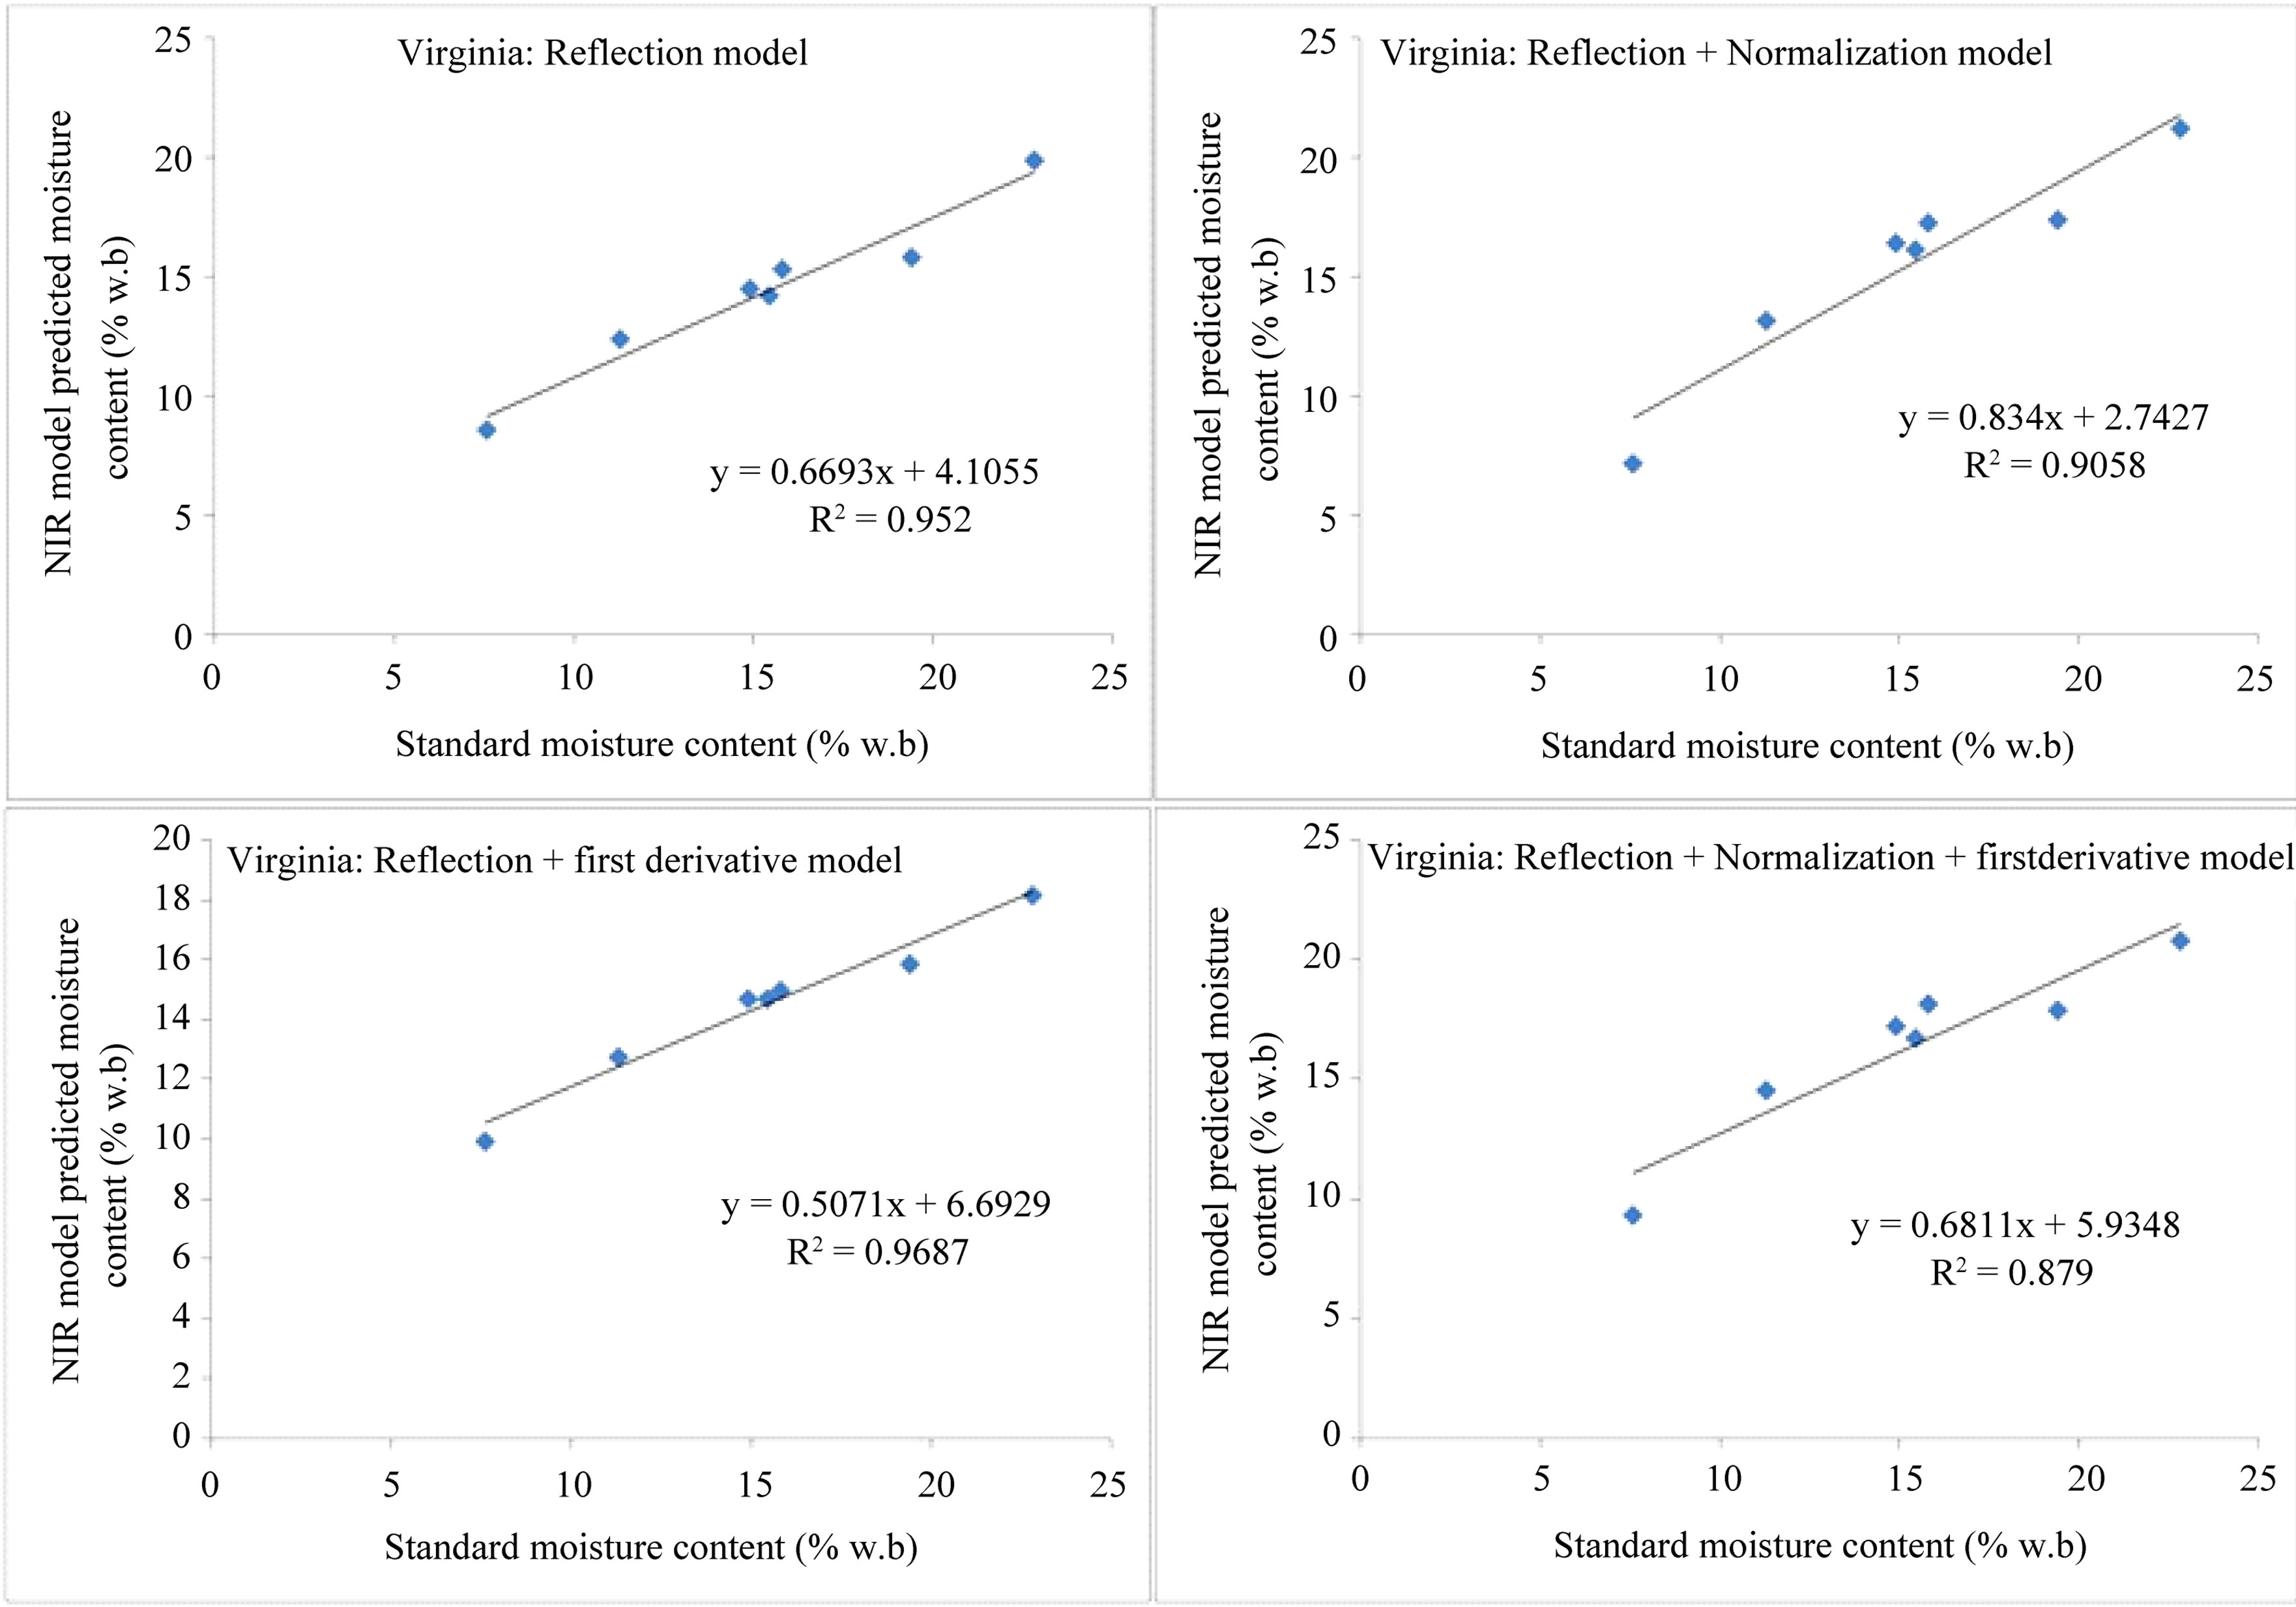
Figure 6. Average MC of Virginia in-shell peanuts predicted using the developed models vs the corresponding standard oven values.
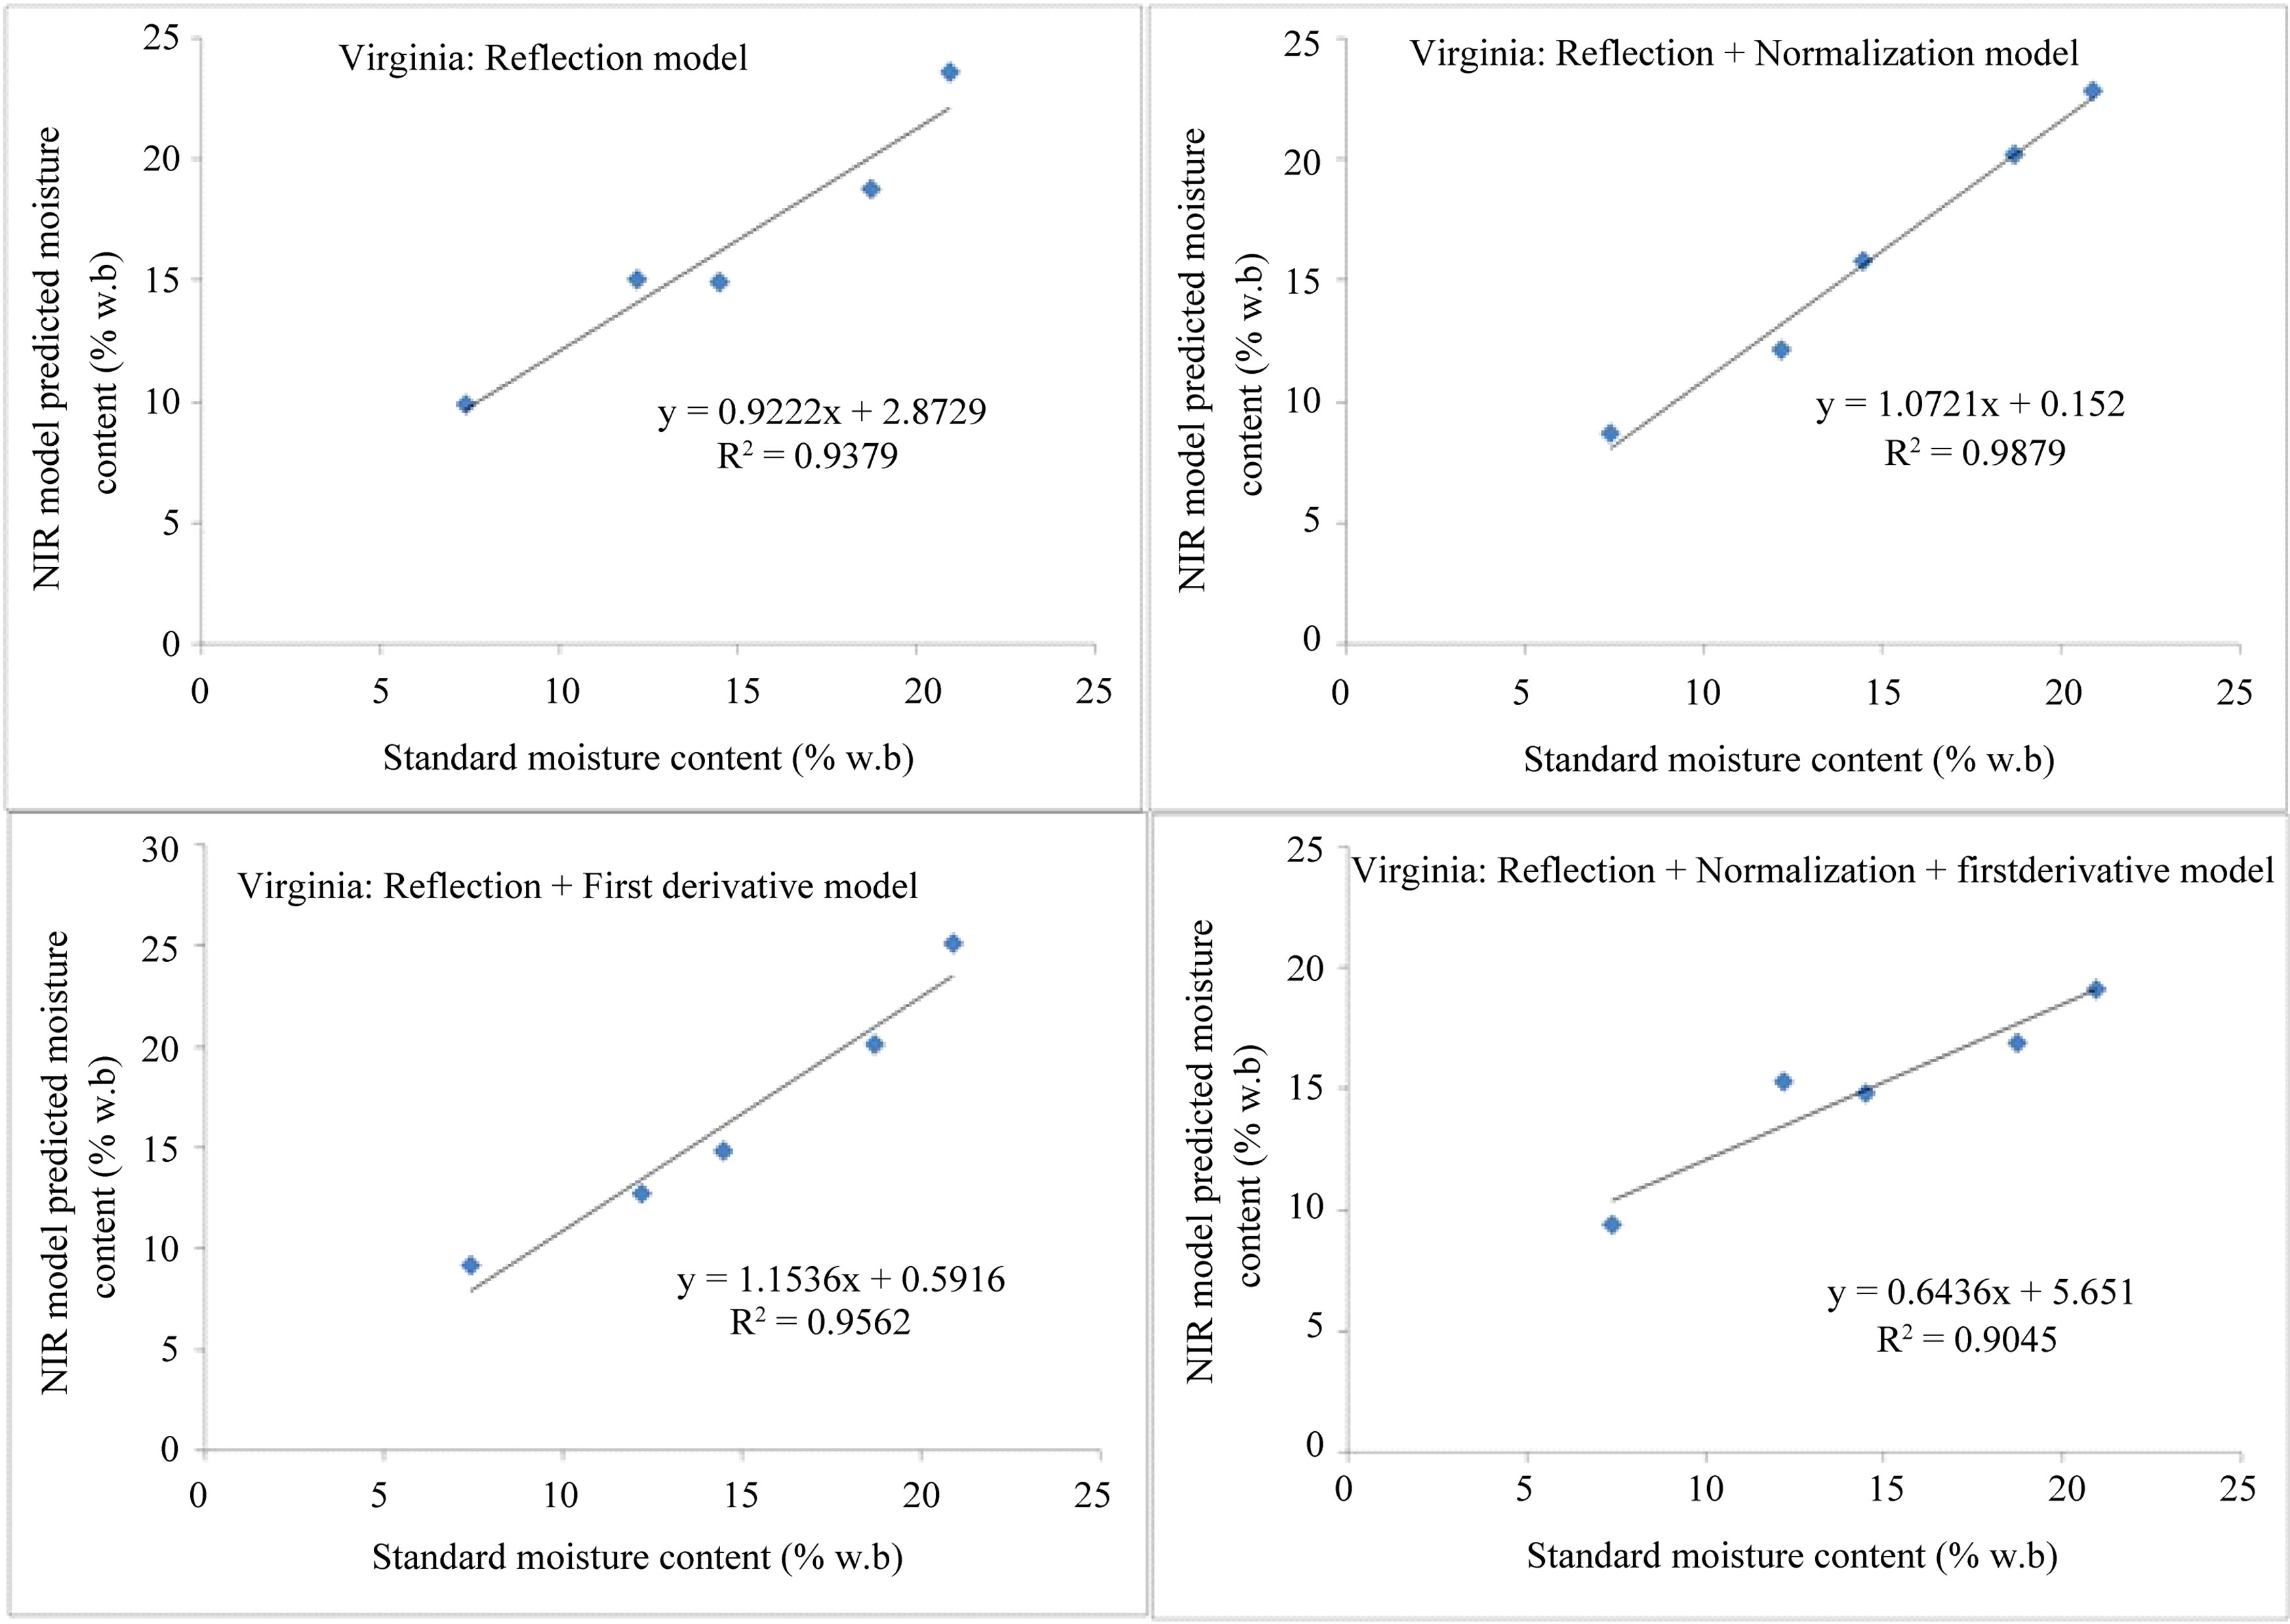
Figure 7. Average MC of the Valencia in-shell peanuts predicted using models vs the corresponding standard oven values.
ture contents correlated well with the standard oven moisture contents with R2 values of better than 0.9 for all models except for the reflection plus normalization plus derivative model of the Virginia type, for which the R2 value was 0.88.
4. Conclusion
NIR reflectance spectroscopy could be a useful tool for the analysis of moisture concentration of in-shell peanuts that requires minimal sample preparation. The calibrations were obtained using partial least square regression analysis. NIR measurements are procedurally simple and can considerably reduce the time required for measurements, compared with the standard air-oven methods or the conventional moisture meters that require the peanut samples to be shelled and cleaned. The use of NIR spectroscopy described in this paper would result in large savings in time and labor during drying, processing and storage of peanuts. By virtue of a low SEP and a high R2 value, the model obtained with reflectance data subjected to normalization was selected as the preferred calibration model, for MC prediction, for both Valencia and Virginia type in-shell peanuts.
REFERENCES
- USDA, “AMS Farmers Stock Peanut Inspection Instructions,” Washington DC, 2000.
- R. Rachaputi, “Primary Industries and Fisheries,” 2010. http://www.dpi.qld.gov.au/26_11899.htm
- K. H. Norris and W. L. Butler, “Techniques for Obtaining Absorption Spectra on Intact Biological Samples,” Transactions on Bio-Medical Electronics, Vol. 8, No. 1, 1961, pp. 153-157. doi:10.1109/TBMEL.1961.4322890
- K. H. Norris and I. R. Hart, “Principles and Methods of measuring Moisture Content in Liquids and Solids,” Reinhold, New York, 1965, pp. 19-25.
- K. H. Norris, “Early History of Near Infrared for Agricultural Applications,” NIR News, Vol. 3, 1992, pp. 12- 13.
- K. N. Govindarajan, C. V. K. Kandala and J. Subbiah, “NIR Reflectance Spectroscopy for Nondestructive Moisture Content Determination in Peanut Kernels,” Transactions of the ASABE, Vol. 52, No. 5, 2009, pp. 1661-1666.
- D. Cozzolino, M. J. Kwiatkowski, R. G. Dambergs, W. U. Cynkar, L. J. Janik, G. Skouroumounis and M. Gishen, “Analysis of Elements in Wine Using Near Infrared Spectroscopy and Partial Least Squares Regression,” Talanta, Vol. 74, No. 4, 2008, pp. 711-716. doi:10.1016/j.talanta.2007.06.045
- S. Nimaiyar, M. R. Paulsen and R. L. Nelson, “Rapid Analysis of Fatty Acids in Soybeans Using FTNIR,” ASABE Paper No. 046118, 2004.
- B. Pérez-Vich, L. Velasco and J. M. Fernández-Martínez, “Determination of Seed Oil Content and Fatty Acid Composition in Sunflower through the Analysis of Intact Seeds, Husked Seeds, Meal and Oil by Near-Infrared Reflectance Spectroscopy,” Journal of the American Oil Chemists’ Society, Vol. 75, No. 5, 1998, pp. 547-555. doi:10.1007/s11746-998-0064-1
- L. Velasco and H. C. Becker, “Estimating the Fatty Acid Composition of the Oil in Intact Seed Rapeseed (Brassica napus L.) by Near Infrared Reflectance Spectroscopy,” Euphytica, Vol. 101, No. 2, 1998, pp. 221-230. doi:10.1023/A:1018358707847
- J. K. Daun, K. M. Clear and P. Williams, “Comparison of Three Whole Seed near Infrared Analyzers for Measuring Quality Components of Canola Seed,” Journal of the American Oil Chemists’ Society, Vol. 71, No. 10, 1994, pp. 1063-1068. doi:10.1007/BF02675897
- R. S. Bhatty, “Measurement of Oil in Whole Flaxseed by Near-Infrared Reflectance Spectroscopy,” Journal of the American Oil Chemists’ Society, Vol. 68, No. 1, 1991, pp. 34-38. doi:10.1007/BF02660306
- B. L. Tillman, D. W. Gorbet and G. Person, “Predicting Oleic and Linoleic Acid Content of Single Peanut Seeds Using Near-Infrared Reflectance Spectroscopy,” Crop Science, Vol. 46, No. 5, 2006, pp. 2121-2126. doi:10.2135/cropsci2006.01.0031
- M. Iwamoto and S. Kawano, “Advantages and Disadvantages of NIR Applications for the Food Industry,” In: I. Murray and I. A. Cowe, Eds., Making Light Work: Advances in Near Infrared Spectroscopy, VCH, Weinheim, 1992, pp. 367-375.
- ASAE, “Moisture Measurement—Un-Ground Grain and Seeds,” 37th Edition, ASABE, St. Joseph, 1990.
NOTES
*Corresponding author.
1Moisture content is expressed in % wet basis throughout this paper.
2Mention of company or trade names is for the purpose of description only and does not imply endorsement by the US Department of Agriculture.
3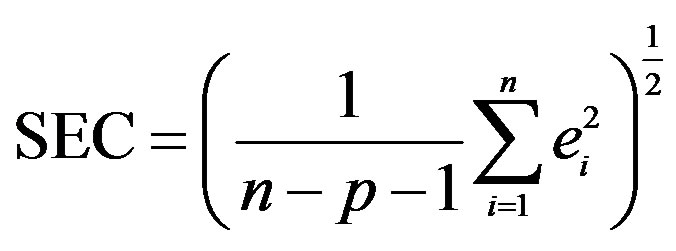 where n is the number of observations, p is the number of variables in the regression equation with which the calibration is performed, and ei is the difference between the observed and reference value for the ith observation.
4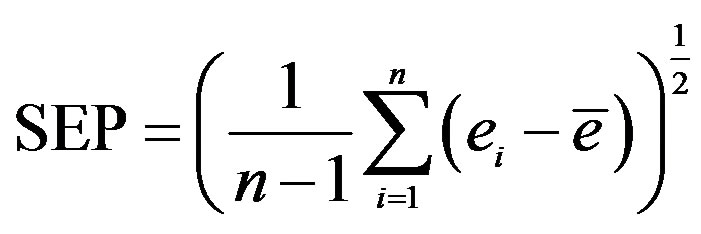 where n is the number of observations, ei is the difference in the moisture content predicted and that determined by the reference method for the ith sample, and
  is the mean of ei for all of the samples.