Advances in Molecular Imaging
Vol. 2 No. 3 (2012) , Article ID: 21215 , 10 pages DOI:10.4236/ami.2012.23004
Inhibition of Physiologic Myocardial FDG Uptake in Normal Rodents: Comparison of Four Pre-Scan Preparation Protocols
1Nuclear Medicine Division, Department of Radiology, Medical University of South Carolina, Charleston, USA
2Hospital Medicine Division, Department of Internal Medicine, Emory University Hospital, Atlanta, USA
3Division of Animal Imaging, Department of Radiology, Medical University of South Carolina, Charleston, USA
Email: *rummanpak@gmail.com
Received May 24, 2012; revised June 27, 2012; accepted July 5, 2012
Keywords: Small Animal Imaging; Fasting; High Fat Diet; PET
ABSTRACT
Background: Suppression of physiologic myocardial sequestration of glucose, and hence the 2-deoxy-18 fluorodeoxyglucose (FDG) is of critical importance to effectively evaluate intrinsic cardiac pathology and better delineate extracardiac FDG activity on Positron Emission Tomography (PET) imaging. In a rodent model, we studied the effect of duration of fasting with or without high fat diet (HFD) consumption on myocardial FDG uptake. Methods: 9 SpragueDawley rats underwent four different preparation protocols before obtaining micro PET imaging: Non-fasting (NF), 18-hrs/Prolonged fasting (PF), 12-hrs/Short fasting followed by High Fat Diet (SF-HFD) and 18-hrs/Prolonged fasting followed by High Fat Diet (PF-HFD). Region of interest were drawn on the myocardium (heart) and ascending aorta (blood pool) to generate maximum standard uptake values (SUVm) for the heart (H-SUVm) and blood pool (BPSUVm). Results: PF-HFD and SF-HFD preparation protocols resulted in significantly lower H-SUVm as compared to PF and NF protocols with H-SUVm of 1.49, 1.56, 4.38 and 10.19 respectively. Conclusion: PF-HFD and SF-HFD preparation protocols provide superior suppression of myocardial FDG uptake in comparison to PF and NF protocols. These findings offer an approach to study intrinsic cardiac disorders (vascular, infiltrative etc) and also provide better visualization of extra-cardiac pathologic disorders.
1. Introduction
Under baseline and fasting conditions, cardiomyocytes primarily utilize fatty acids for metabolism; however, they readily consume glucose, pyruvate, ketone or lactate, depending upon their availability [1,2]. Cardiomyocytes physiologically accumulate FDG, a D-glucose analogue, which is the most commonly used PET radiotracer. The transport of D-glucose and hence FDG in to cardiomyocytes is mediated through several different transporters of the GLUT family, predominantly via GLUT-4, an insulinsensitive transporter [3].
Myocardial sequestration of FDG decreases the sensitivity and specificity of FDG PET imaging, specifically in patients with thoracic malignancies with or without myocardial involvement. Therefore, it is a major barrier to the growing potential of FDG PET imaging for identification of pathologic processes involving myocardium, pericardium and coronary arteries [4,5].
To overcome this physiological barrier, either new radiotracers with different myocardial pharmacokinetics are required or physiologic FDG uptake by myocardium needs to be suppressed. Fasting the patients for 6 - 12 hours remains an accepted preparation protocol to reduce serum glucose levels in order to minimize myocardial FDG uptake [6,7]; however, short to moderate periods of fasting (6 - 12 hours) have been found to inconsistently and variably suppress physiologic myocardial FDG utilization [8,9]. Long term fasting (greater than 18 hours) appears to be considerably more reliable [10], likely because of elevated serum free fatty acids in addition to low glucose, but prospective evidence is lacking and compliance remains an issue. Carbohydrate restriction alone followed by short term fasting results in further reduction in serum glucose and serum insulin [11]. This reduces serum glucose levels, but in the presence of low serum fatty acids, may not be very effective in suppressing physiologic myocardial glucose or FDG uptake.
Inhibition of glucose oxidation by elevated serum fatty acid concentrations, and vice versa are well established phenomena “the glucose-fatty acid cycle [12]. Cook et al [13] suggested consumption of a fatty meal or administration of a pharmacological fatty acid agent prior to FDG dosing to maximize fatty acid metabolism, and thereby minimize glucose metabolism and restrict myocardial FDG uptake, specifically for mediastinal imaging. This has recently been studied by William et al. [14] with effective suppression of physiologic myocardial FDG uptake in oncology patients, to optimize pathologic sequestration of FDG. Direct comparison of protocols using different duration of fasting with or without high fat diet consumption has not been studied.
Rats have been extensively studied to provide insight in to various patho-physiological processes involving the human heart. We have prospectively examined the effects of different preparation protocols in an animal model, with each rodent (rat) serving as its own internal control.
2. Material and Methods
2.1. Subjects
The subjects were 8 - 20 weeks old male (n = 5) and female (n = 4) Sprague Dawley rats, which weighed between 257 - 396 g (389.57 ± 122.91) at the inception of the experiment and 188 - 596 g (440 ± 148.15) at the end of the experiment. They were purchased from Charles River Laboratories International, Inc. (Wilmington, MA 01887). Prior to the experiments, all the subjects were quarantined and acclimated for 7 days in a vivarium (set at 12 hrs light and dark cycle) in a dedicated small animal imaging center. At all times, the subjects received continuous food and water in their home-cages, except during the fasting phase and the high-fat-diet phase. All the experimental methods were approved by our Institutional Animal Care and Use Committee.
2.2. FDG dose Preparation
FDG was synthesized at an offsite cyclotron facility, managed and operated by PETNET.Inc./Siemens located in Columbia, SC. Prior to injection, the FDG doses were calibrated and decay-corrected based on the institutional PET center’s well-counter. After dose calibration and decay-correction, an injected dose averaging to 3.6 mCi (millicurie) or 133.2 MBq (megabacquerel) ranged from 2.9 to 4.1 mCi (107.3 - 151.7 MBq) across different preparation protocols. Each injected dose was diluted and suspended in a 0.5-0.7 ml of Dulbecco’s Phosphate Buffered Saline (pH 7.4; Invitrogen, Carlsbad, CA 92008). All the decay corrections, during and after the scans, were performed by the scanner’s software (IAW 2.2).
2.3. Experimental Method
A within-subject design was used in which each subject served as its own internal control. Figure 1 summarizes the experimental design and depicts the four preparation protocols completed for each rodent. All nine rodents received four preparation protocols, each separated by 2 - 3 weeks: baseline/non-fasting (NF), 18-hrs/prolonged fasting (PF), 12-hrs/Short fasting combined with high fat diet (SF-HFD) and 18-hrs/Prolonged fasting combined with high fat diet (PF-HFD). For 12-hrs/short fasting combined with HFD (SF-HFD) protocol, each subject underwent 12-hrs/short fasting followed by 3-hrs period of consuming the high-fat sunflower seeds, followed by another 2 - 3 hours of fasting before the FDG tracer injection. A similar protocol was followed for 18-hrs/prolonged fasting combined with HFD (PF-HFD) except for the duration of fasting. The high-fat diet consisted of sunflower seeds containing protein (16%) fat (40%), and fiber [35%] (www.bio-serv; product #S5137) with each rat consuming 4.53 g ± 1.40 g of sunflower seeds. Sun flower seeds were chosen due to their high fat and negligible absorbable carbohydrate content out of the other commercial diets available by vendors supplying animal diets for our small animal imaging facility. A few minutes prior to FDG administration, each subjects’ blood glucose level (mg/dl) was measured with an Abbott’s Precision Xtra Glucometer (calibrated according to the vender’s glucose standard strip; Almeda, CA 94502).
2.4. Micro-PET Specifications
All subjects were imaged in a Siemens’ Quicksilver Inveon PET/CT capable of acquiring PET only or CT only 3D volumetric data and docking into an easily co-registered PET/CT 3D-data acquisition mode. For this study, only 3D-PET acquisitions were obtained and no cardiac gating was performed. The Inveon scanner has a 12.7- and 16.1- cm axial and transaxial center field of view (FOV), respectively [15]. The PET camera contains 16 blocks of cerium doped lutetium oxyorthosilicate crystals [16] with a ring geometry construction. Each LSO block is composed of 20 × 20 crystal matrix and each has a dimension of 1.5 × 1.5 × 10 mm3. At 3D-mode, the LSO detectors have an intrinsic spatial resolution between 1.3- and 1.5- mm FWHM (Full Width at Half Maximum) and 10% - 12% detection efficiency. The PET scanner utilized a pair of build-in dual Co-57 point sources for immediate serial attenuation correction. Acquisition and operation of the PET scanner was interfaced by an external host and embedded Dual 3.20 GHz Intel Xeon processor computers under the Microsoft Window XP pro SP2 operating system, which have 4 GB RAM for viewing and reconstruction.
2.5. Anesthesia Details
Forty-five minutes after the FDG administration (Figure 1), each subject was anesthetized with inhalation anesthetic agent Isoflurane (Phoenix Pharmaceuticals, Inc., St. Joseph, MO 64507). Specifically, anesthesia was induced in a temperature controlled, Lucite induction chamber with 1% Oxygen and 3 - 4 MACs of Isoflurane. Once an acute anesthetic plane was established, the subjects were transferred to the scanner bed and maintained with 1% Oxygen and 1.5 - 2 MACs of Isoflurane via a nose cone in a prone position for the duration of the 60-min scan. After each scan, the subjects were allowed to recover from the anesthesia and monitored until they were fully mobile and conscious.
2.6. Data Acquisition and Reconstruction
Forty-five minutes after FDG administration, each rodent in a prone position was scanned for 60-minutes, while under Isoflurane anesthesia. Decay and residual corrections were implemented based on the initial dose assayed. Immediately after the emission scan, a 10 min Blank-corrected transmission scan was performed for attenuation correction. The raw emission and transmission data were in list-mode form and this data was then transformed into a sinogram for reconstruction purposes. For volumetric reconstruction, the emission sinogram (at Nyquist frequency cutoff) in conjunction with attenuation and scatter correction sinograms, along with component-based normalization coefficients [17] were entered into an iterative 3D-Ordered-Subsets Expectation Maximization (3D-OSEM) reconstruction algorithm in which the missing pixels due to detector gaps were estimated using Fourier rebinning [18,19]. The 3D-OSEM reconstruction algorithm parameters were set at 4 iterations with 16 subsets [20]. The voxel data were reconstructed into a 128 × 128 × 128 matrix with reconstructed spatial resolution of 0.776 mm3. We utilized 3D-OSEM rather than Filtered Back Projection (FBP) as this 3D-OSEM recon-

Figure 1. Describes the four preparation protocols as detailed in sub-heading “Experimental method” of section “Material and Methods”. NF: non-fasting; PF: prolonged fasting; SF-HFD: short (12 hour) fasting with high fat diet; PF-HFD: prolonged (18 hour) fasting with high fat diet; SF seeds: sun flower seeds.
struction algorithm has been shown to provide superior spatial resolution with less pixel variation and lower coefficients of variation [19]. The reconstructed images were in IMG format. The IMG images were converted into DICOM format using Siemens’ Inveon Research Workstation software (IRW, version 2.2) for quantification and 3D-visualization.
2.7. Data Processing and Analyses
The reconstructed volumetric, DICOM data were visualized and quantified using Siemens’ IRW quantification software. Region of interests (ROIs) were manually drawn on left ventricular myocardium and ascending aorta lumen (close to origin of aorta) to obtain respective heart and blood pool SUVm activity. The quantified activities for these ROIs were in the units of distribution volume (DV = Bq/ml) per pixel. Since the data were acquired with the 3D-static mode, the data of interest were the maximum DV pixel values (DVmax) in the myocardium and the blood pool ROIs, instead of average pixel values. The DVmax pixel values were converted into SUVm [21,22] using Equation 1, with the injected dose (in Bq) and bodyweight (in grams) :
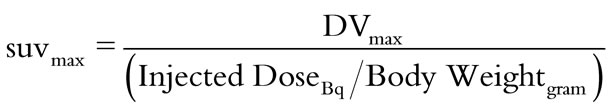 (1)
(1)
Maximum standard uptake value of heart (H-SUVm) and blood pool (BP-SUVm), and glucose values obtained across four different preparation protocols were subjected to one-way repeated analysis of variance (ANOVA). Pair-wise differences were performed using the least square planned contrasts using the total error term of the repeated ANOVA. The pair-wise planned contrasts were conducted via F-ratio statistics. The significant level was set at alpha of 0.05.
3. Results
Figure 2 demonstrates that H-SUVm is significantly lower in PF-HFD and SF-HFD preparation protocols compared to NF and PF protocols. H-SUVm is slightly lower in PF-HFD compared to SF-HFD protocol; however, the difference is non-significant. Similarly, H-SUVm in PF protocol is lower than NF protocol, but the difference is non-significant, secondary to significant overlap in H-SUVm among these protocols. In two subjects (A4, B3), the H-SUVm increased in PF protocol compared to NF protocol, which may be explained by the rodents not consuming enough carbohydrates during the non-fasting state, but under both PF-HFD and SF-HFD conditions, anticipated myocardial FDG suppression is observed. In subjects A5 and B4, significant H-SUVm suppression is noticed in PF protocol, essentially similar to SF-HFD and PF-HFD protocols, compared to NF protocol. This does endorse the significance of PF protocol in suppressing cardiac FDG uptake; however, it is less pronounced and inconsistent in other subjects.
Table 1 summarizes the H-SUVm of all subjects following each of the four different preparatory protocols. Overall, H-SUVm decreases significantly with fasting and
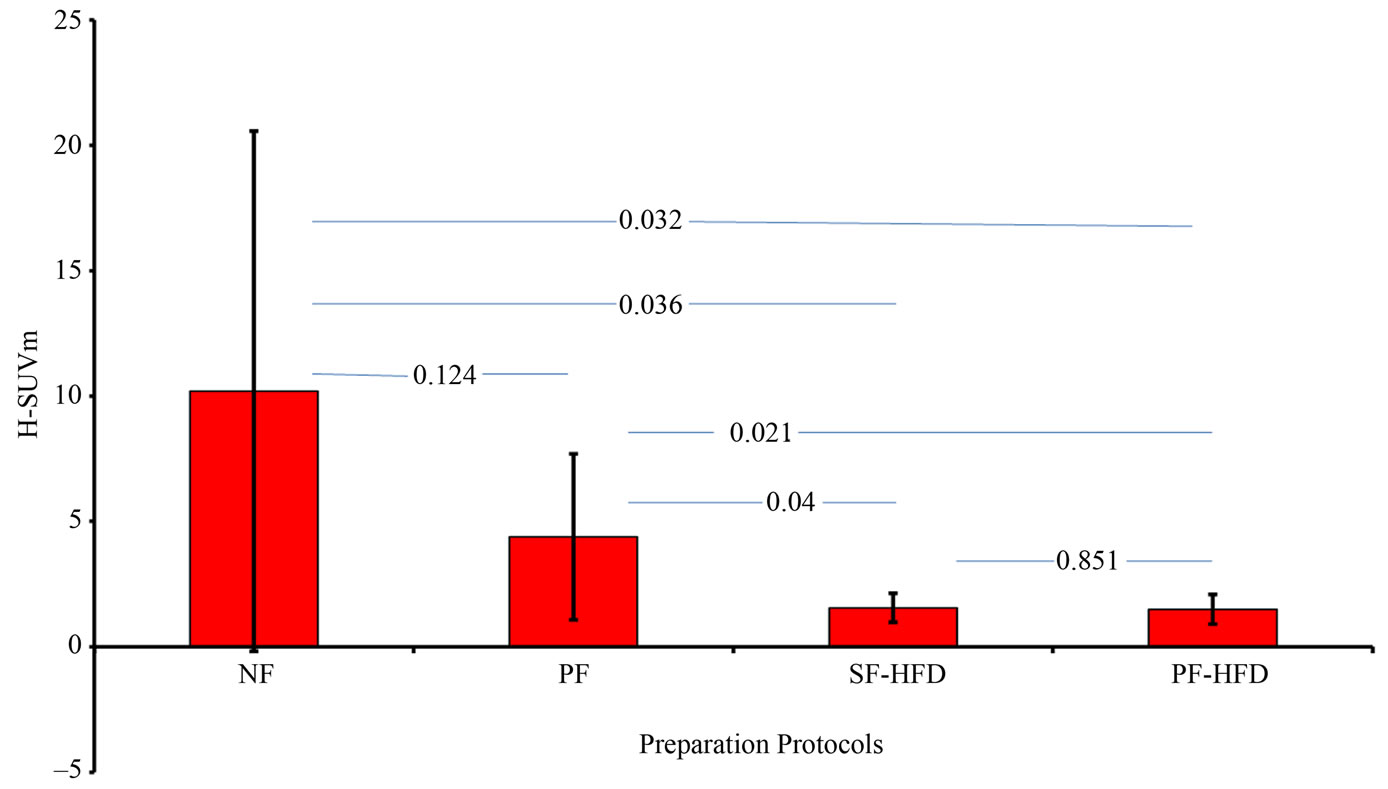
Figure 2. reveals that H-SUVm is significantly suppressed in SF-HFD and PF-HFD protocol groups as detailed in “Results” section, with respective p-values. H-SUVm: Heart SUVm; NF: non-fasting; PF: prolonged fasting; SF-HFD: short fasting with high fat diet; PF-HFD: prolonged fasting with high fat diet.
is suppressed further with HFD consumption. Of interest, the standard deviation for H-SUVm is greatly reduced in SF-HFD and PF-HFD protocols, relative to non-HFD protocols, indicating that addition of a high fat diet improves the reliability of fasting protocols. Large variations in H-SUVm are observed with the NF protocol with relatively smaller variations encountered with the PF protocol, as illustrated in Figure 2.
Figure 3 demonstrates a non-significant difference in the mean BP-SUVm among different preparation protocols, secondary to large variation in BP-SUVm in NF and PF protocols. BP-SUVm with its standard deviation (in parenthesis) for NF, PF, SF-HFD and PF-HFD were 1.32 (1.36), 1.19 (1.26), 0.44 (0.18), 0.43 (0.23) respectively A trend toward consistently lower BP-SUVm, with reduced standard deviations is observed in the SF-HFD and PF-HFD preparation protocols.
Serum glucose values with its standard deviation (in parenthesis) were 92.33 (10.54), 74.44 (13.02), 69.00 (12.72) and 64.88 (8.92) in NF, PF, SF-HFD and PFHFD groups respectively. Figure 4 reveals that serum glucose is significantly lower before FDG administration in PF, SF-HFD and PF-HFD protocols compared to NF protocol. The difference among the former three protocols was statistically non-significant.
The average consumption of high fat diet (sunflower seeds) in grams was similar in SF-HFD and PF-HFD groups with a mean of 4.24 and 4.03 grams respectively (p-value 0.84), as shown in Figure 5.
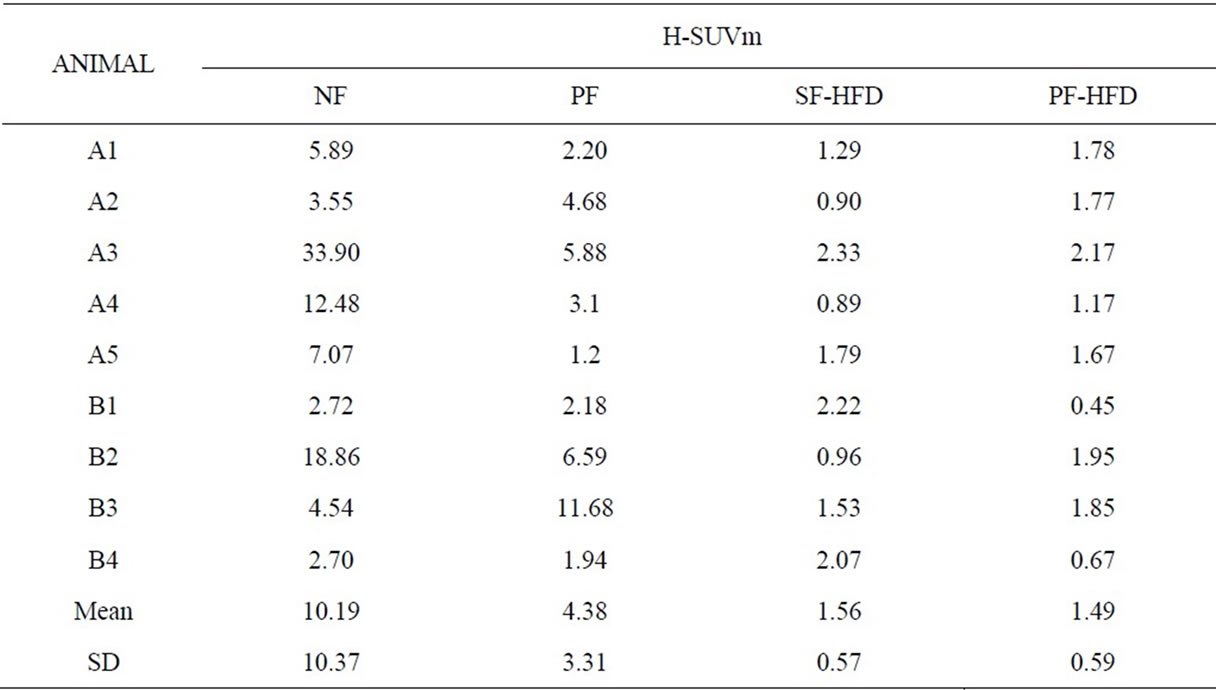
Table 1. Shows the maximum standard uptake value of heart (H-SUVm) across different preparation protocols. A = male rodents, B = female rodents.
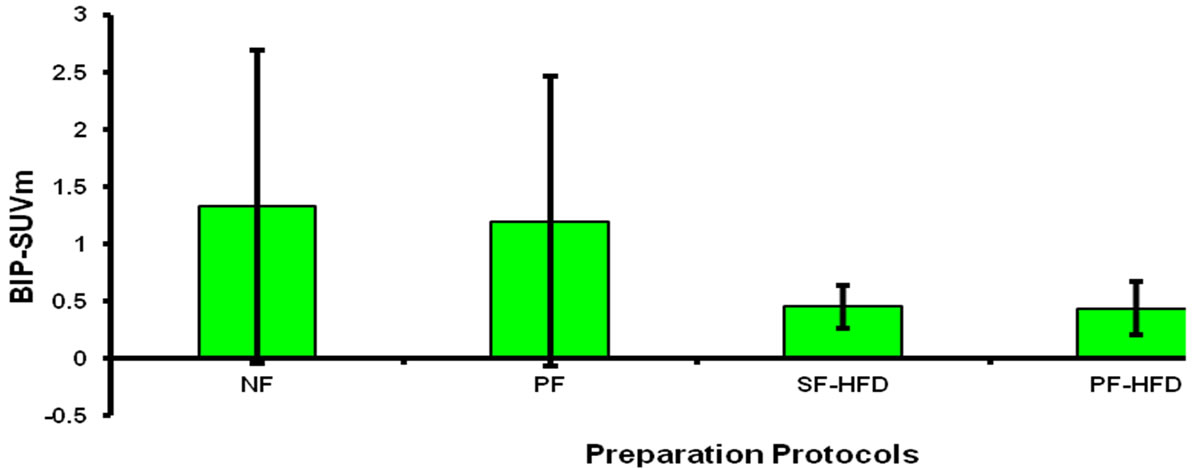
Figure 3. Demonstrates that BP-SUVm is significantly lower in SF-HFD and PF-HFD protocols; however, this difference is non-significant when compared to NF and PF protocols secondary to large variation in latter groups as described in “Results” section. BP-SUVm: Blood pool SUVm; NF: non-fasting; PF: prolonged fasting; SF-HFD: short fasting with high fat diet; PF-HFD: prolonged fasting with high fat diet.

Figure 4. Shows the blood glucose concentration is significantly higher in NF protocol compared to all other groups. NF: non-fasting; PF: prolonged fasting; SF-HFD: short fasting with high fat diet; PF-HFD: prolonged fasting with high fat diet.

Figure 5. Shows similar consumption of HFD consumption in both SF-HFD and PF-HFD groups. HFD: high fat diet; SF-HFD: short fasting with high fat diet; PF-HFD: prolonged fasting with high fat diet.
Figures 6(A) and (B) show PET images of two rats A1 and B2 respectively, under four different preparation protocols corroborating the importance of HFD protocols.
4. Discussion
The utility of cardiac PET currently is largely restricted for the evaluation of obstructive coronary artery disease. Sensitivity and resolution is improved in comparison to conventional nuclear SPECT images; however, SPECT scans provide the same information at relatively less costare extensively studied and have proven efficacy in detecting obstructive coronary artery disease [23]. Of the cardiac PET radiotracers, the most common and readily utilized is FDG, which is physiologically sequestered by cardiomyocytes and this distinguishes it from conventional SPECT perfusion radiotracers, such as Tc99m sestamibi or tetrofosmin. The kinetics of myocardial FDG uptake is summarized above in the introduction section.
PET imaging of the heart has successfully measured coronary flow reserve (CFR) [24]; however, efforts to elucidate coronary artery inflammation and/or myocardial inflammatory/infectious processes have been less productive [25]. A major reason of this impediment is the well known physiologic myocardial FDG localization. Our results indicate that physiologic inhibition of myocardial FDG uptake can be reliably accomplished, supporting the results of other studies. As observed in prior studies, our results also indicated significant overlap and variation among the H-SUVm in non-fasting and prolonged fasting groups, which essentially translates that prolonged fasting only protocol are also less reliable. A shorter fasting such as 6 - 8 hours with high fat diet was not technically achievable with rodents (as someone’s presence was necessary to enforce fasting); however yet, may have been of added value. Each rodent served as internal control and every single rodent completed each of the four different preparation protocols. This would have been difficult to prospectively accomplish in humans, secondary to significant radiation exposure. Finally, the observed changes in myocardial FDG uptake induced by distinctly different preparation protocols

Figure 6(A). Axial section of FDG PET images of a male rat (A1) under four preparation protocols Figure clearly shows a decrease in cardiac FDG uptake from NF to PF protocol with further decrease in SF-HFD and PF-HFD protocols. Arrows point to cardiac FDG activity, which is significantly markedly reduced in SF-HFD and PF-HFD groups. NF: non-fasting; PF: prolonged fasting; SF-HFD: short fasting with high fat diet; PF-HFD: prolonged fasting with high fat diet.
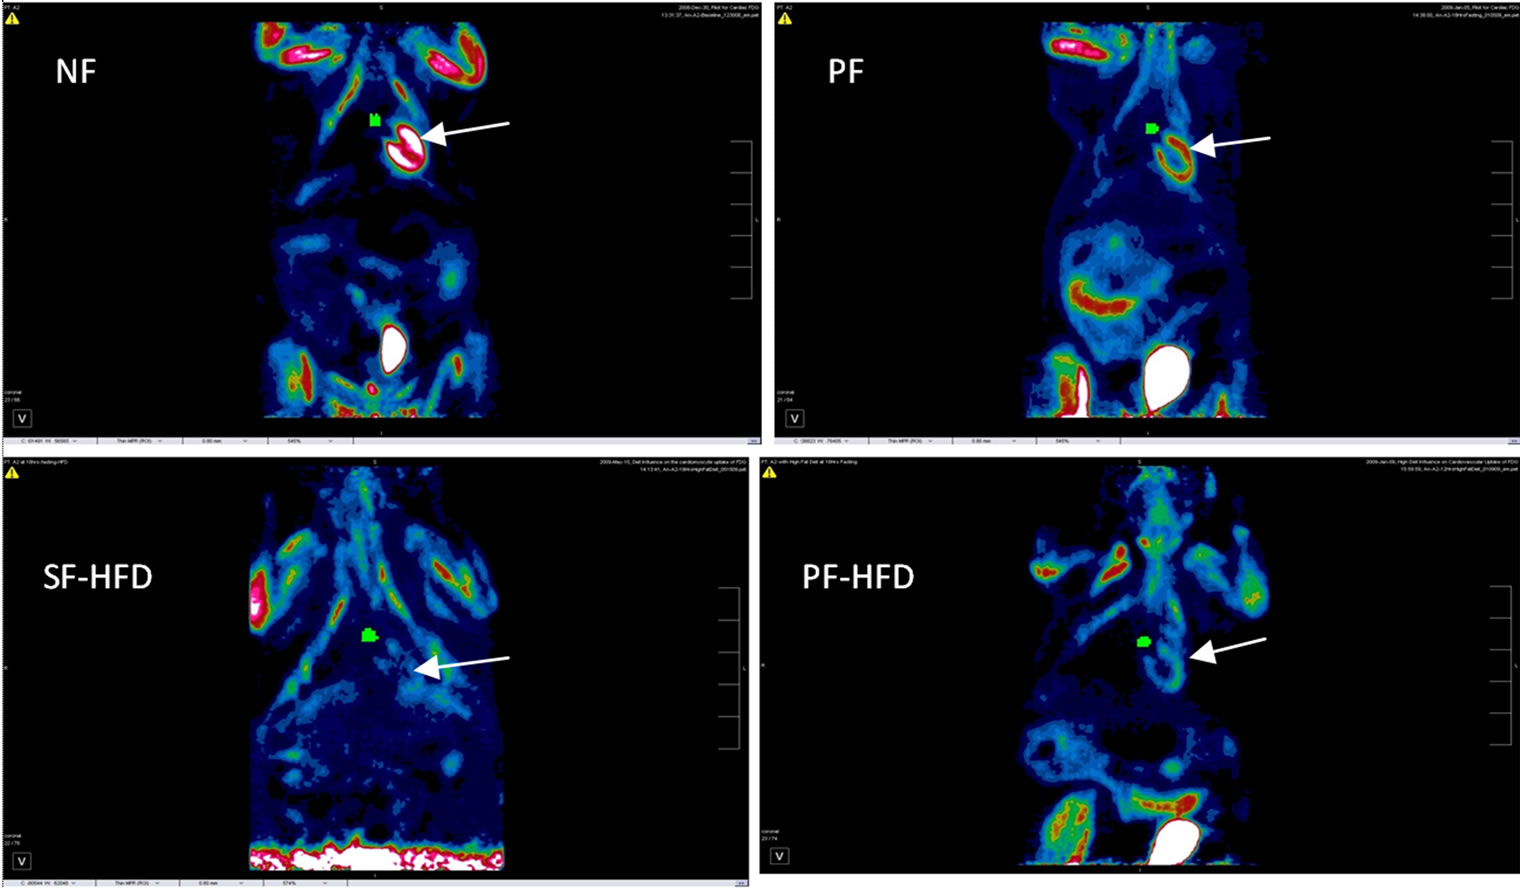
Figure 6(B). Coronal section images of female rat (B2), revealing a similar pattern of decrease in cardiac FDG uptake with HFD protocols as observed in Figure 6(A), with expected FDG activity also seen in urinary bladder and chest/limb musculature. Arrows point to cardiac FDG activity, which is significantly reduced in SF-HFD and PF-HFD groups. Green pixels (small circular region) medial to heart illustrate region of interest drawn at blood pool (aorta). NF: non-fasting; PF: prolonged fasting; SF-HFD: short fasting with high fat diet; PF-HFD: prolonged fasting with high fat diet.
demonstrate their relative effectiveness, which has not been studied before.
Several myocardial infiltrative diseases such as sarcoidosis, amyloidosis etc remain a diagnostic dilemma. Myocardial involvement is frequently diagnosed at later stages, when therapeutic options are limited. Early detection of myocardial inflammation in these disease processes is critical, as medical intervention at this point can prevent permanent damage which plays a major role in development of cardiomyoapthy and a nidus for fatal arrhythmias. Gallium scintigraphy has been used in past as a tool to elucidate active cardiac inflammation; however, its sensitivity and accuracy are significantly inferior to PET scans [10]. Also, cardiac MRI and cardiac CT are yet not effective in detecting active inflammatory/infectious process.
Cardiac MRI typically displays myocardial enhancement with delayed gadolinium washout on T-1 weighted images in regions of myocyte replacement by fibrosis [26], which is a late stage. At this stage, damaged myocardium cannot be salvaged, again highlighting the importance of early detection. Detection of early inflammation (edema) via cardiac MRI on T2 weighted images is less sensitive and non-specific [27]. Cardiac PET utilizing FDG, on the other hand, can provide essential information regarding early (active) inflammation. Similarly, coronary atherosclerosis is a known inflammatory process and FDG tracer shows great promise in detecting non-obstructive arterial inflammation, as well as active atherosclerotic plaques which can be an immensely important diagnostic tool in risk stratification [25]. Likewise, FDG PET has become an imaging modality of choice to evaluate several malignancies; and advances have been made to study primary malignancies and metastatic tumors of the heart [28] with some challenges.
These Pathologic processes involving the coronary arteries, myocardium and even pericardium can be studied with FDG PET, provided one can consistently accomplish effective suppression of physiologic myocardial FDG uptake. Inhibition of physiologic myocardial FDG uptake, as well as decreased FDG activity observed in blood pool regions after completing the SF-HFD and PFHFD protocols, indicates that an inexpensive, simplified patient preparation protocol may provide a means for studying various pathologic processes involving myocardium and cardiac vasculature using FDG PET.
5. Limitations
We used an animal rodent model and results of this study may not accurately reflect physiologic myocardial FDG uptake following different preparation protocols in humans. Although all rodents served as internal controls, higher myocardial FDG activity in some animals compared to others is not completely understood, but similar variation is frequently observed in human studies. Serum insulin and free fatty acids were not measured which would have been of added benefit in understanding the physiology of myocardial FDG uptake; however, significant suppression of myocardial FDG uptake in fasting combined with high fat diet conditions in comparison to fasting only and non-fasting conditions indirectly confirms lower serum insulin and higher serum FFA concentration in former group. These findings prove the utility of preparation protocol regardless of serum insulin or FFA levels.
6. Conclusion
Suppression of physiologic myocardial FDG uptake is achievable. Short (6 to 12 hour) fasting alone has not been proven to be effective in prior studies, whereas prolonged fasting faces inconsistency of myocardial FDG suppression, in part secondary to difficulties with compliance. Fasting combined with high fat diet shows great promise. Both short and long fasting combined with high fat diet protocols proved to be reliable and effective in the suppression of physiologic myocardial FDG uptake and blood pool FDG activity. Prolonged fasting followed by high fat diet consumption poses potential compliance issues; however, the readily accomplished 12 hour, overnight fast, followed by high fat consumption offers an optimal and practical protocol for human subjects. Compliance with this latter protocol might well be expected to far exceed the previously recommended 18 to 24 hour fasting only protocols. These findings provide an important opportunity to study both intrinsic cardiac pathology and to better delineate extra-cardiac disease processes utilizing FDG PET imaging.
REFERENCES
- J. R. Neely and H. E. Morgan, “Relationship between Carbohydrate and Lipid Metabolism and the Energy Balance of Heart Muscle,” Annual Review of Physiology, Vol. 36, 1974, pp. 412-459.
- A. Grynberg and L. Demaison, “Fatty Acid Oxidation in Heart,” Journal of Cardiovascular Pharmacology, Vol. 28, Suppl. 1, 1996, pp. S11-S17.
- J. E. Pessin and G. I. Bell, “Mammalian Facilitative Glucose Transporter Family: Structure and Molecular Regulation,” Annual Review of Physiology, Vol. 54, No. 1, 1992, pp. 911-930. doi:10.1146/annurev.ph.54.030192.004403
- P. D. Shreve, Y. Anzai and R. L. Wahl, “Pitfalls in Oncologic Diagnosis with FDG PET Imaging: Physiologic and Benign Variants,” RadioGraphics, Vol. 19, No. 1, 1999, pp. 61-77.
- D. Lum, S. Wandell, J. Ko and M. Coel, “Positron Emission Tomography of Thoracic Malignancies: Reduction of Myocardial Fluorodeoxyglucose Uptake Artifacts with a Carbohydrate Restricted Diet,” Clinical Positron Imaging, Vol. 3, No. 4, 2000, p. 155. doi:10.1016/S1095-0397(00)00067-4
- H. J. Ding, Y. C. Shiau, J. J. Wang, S. T. Ho and A. Kao, “The Influences of Blood Glucose and Duration of Fasting on Myocardial Glucose Uptake of [18F]Fluoro-2-deoxy-D-glucose,” Nuclear Medicine Communications, Vol. 23, No. 10, 2002, pp. 961-965. doi:10.1097/00006231-200210000-00005
- W. Okumura, T. Iwasaki, T. Toyama, et al., “Usefulness of Fasting 18F-FDG PET in Identification of Cardiac Sarcoidosis,” Journal of Nuclear Medicine, Vol. 45, No. 12, 2004, pp. 1989-1998.
- T. Kaneta, T. Hakamatsuka, K. Takanami, et al., “Evaluation of the Relationship between Physiological FDG Uptake in the Heart and age, Blood Glucose Level, Fasting Period, and Hospitalization,” Annals of Nuclear Medicine, Vol. 20, No. 3, 2006, pp. 203-208. doi:10.1007/BF03027431
- O. Israel, M. Weiler-Sagie, S. Rispler, et al., “PET-CT Quantitation of the Effect of Patient-Related Factors on Cardiac 18F-FDG Uptake,” Journal of Nuclear Medicine, Vol. 48, No. 2, 2007, pp. 234-239.
- R. Langah, K. Spicer, M. Gebregziabher, et al., “Effectiveness of Prolonged Fasting 18F-FDG PET-CT in the Detection of Cardiac Sarcoidosis,” Journal of Nuclear Cardiology, Vol. 16, No. 5, 2009, pp. 801-810. doi:10.1007/s12350-009-9110-0
- D. Lum, S. Wandell, J. Ko and M. N. Coel, “Reduction of Myocardial 2-Deoxy-2-[18F]Fluoro-D-glucose Uptake Artifacts in Positron Emission Tomography Using Dietry Carbohydrate Restriction,” Molecular Imaging and Biology, Vol. 4, No. 3, 2002, pp. 232-237. doi:10.1016/S1095-0397(01)00062-0
- P. J. Randle, P. B. Garland, C. N. Hales and E. A. Newsholme, “The Glucose-Fatty Acid Cycle: Its Role in Insulin Sensitivity and the Metabolic Disturbance of Diabetes Mellitus,” Lancet, Vol. 281, No. 7285, 1963, pp. 785-789. doi:10.1016/S0140-6736(63)91500-9
- G. J. Cook, I. Fogelman and M. N. Maisey, “Normal physiological and Benign Pathological Variants of 18- Fluoro-2-deoxyglucose Positron Emission Tomography Scanning: Potential for Error in Interpretation,” Seminars in Nuclear Medicine, Vol. 26, No. 4, 1996, pp. 308-314. doi:10.1016/S0001-2998(96)80006-7
- G. Williams and G. M. Kolodny, “Suppression of Myocardial 18F-FDG Uptake by Preparing Patients with a High-Fat, Low-Carbohydrate Diet,” American Journal of Roentgenology, Vol. 190, No. 2, 2008, pp. W151-W156. doi:10.2214/AJR.07.2409
- J. A. Disselhorst, M. Brom, P. Laverman, C. H. Slump, O. C. Boerman, W. J. Oyen, M. Gotthardt and E. P. Visser, “Image-Quality Assessment for Several Positron Emitters Using the NEMA NU 4-2008 Standards in the Siemens Inveon Small-Animal PET Scanner,” Journal of Nuclear Medicine, Vol. 51, No. 4, 2010, pp. 610-617. doi:10.2967/jnumed.109.068858
- D. L. Bailey, J. S. Karp and S. Surti, “Physics and Instrumentation in PET,” In: Positron Emission Tomography: Basic Science and Clinical Practice, Springer-Verlag, London, 2002, pp. 41-67.
- R. D. Badawi and P. K. Marsden, “Developments in Component-Based Normalization,” Physics in Medicine and Biology, Vol. 44, No. 2, 1999, pp. 571-594. doi:10.1088/0031-9155/44/2/020
- M. Lubberink, R. Boellaard, A. P. van der Weerdt, F. C. Visser and A. A. Lammertsma, “Quantitative Comparison of Analytic and Iterative Reconstruction Methods in 2- and 3-Dimensional Dynamic Cardiac 18F-FDG PET,” The Journal of Nuclear Medicine, Vol. 45, No. 12, 2004, pp. 2008-2015.
- F. H. P. Van Velden, R. W. Kloet, B. N. M. van Berckel, A. A. Lammertsma and R. Boellaard, “Accuracy of 3-Dimensional Reconstruction Algorithms for the High-Resolution Research Tomography,” The Journal of Nuclear Medicine, Vol. 50, No. 1, 2009, pp. 72-80. doi:10.2967/jnumed.108.052985
- M. Brambilla, B. Cannillo, M. Dominietto, L. Leva, C. Secco and E. Inglese, “Characterization of Ordered-Subsets Expectation Maximization with 3D Post-Reconstruction Gaussian Filtering and Comparison with Filtered Backprojection in 99mTc SPECT,” Annual Nuclear Medicine, Vol. 19, No. 2, 2005, pp. 75-82. doi:10.1007/BF03027384
- J. H. F. Rudd, K. S. Myers, S. Bansilal, J. Machac, C. A. Pinto, C. Tong, A. Rafique, R. Hargreaves, M. Farkouh, V. Fuster and Z. A. Fayad, “Atherosclerosis Inflammation Imaging with 18F-FDG PET: Carotid, Iliac, and Femoral Uptake Reproducibility, Quantification Methods, and Recommendations,” The Journal of Nuclear Medicine, Vol. 49, No. 6, 2007, pp. 871-878. doi:10.2967/jnumed.107.050294
- T. Erselcan, B. Turgut, D. Dogan, et al., “Lean body Mass-Based Standardized Uptake Value, Derived from a Predictive Equation, Might Be Misleading in PET Studies,” European Journal of Nuclear Medicine, Vol. 29, No. 12, 2002, pp. 1630-1638. doi:10.1007/s00259-002-0974-3
- H. Jadvar, W. Strauss, G. Segall, et al., “SPECT and PET in the Evaluation of Coronary Artery Disease,” RadioGraphics, Vol. 19, No. 4, 1999, pp. 915-926.
- G. El Fakhri, A. Kardan, A. Sitek, et al., “Reproducibility and Accuracy of Quantitative Myocardial Blood Flow Assessment with 82Rb PET: Comparison with 13N-Ammonia PET,” The Journal of Nuclear Medicine, Vol. 50, No. 7, 2009, pp. 1062-1071. doi:10.2967/jnumed.104.007831
- Z. Zhang, J. Machac, G. Helft, et al., “Non-Invasive Imaging of Atherosclerotic Plaque Macrophage in a Rabbit Model with F-18 FDG PET: A Histopathological Correlation,” BMC Nuclear Medicine, Vol. 6, 2006, p. 3. doi:10.1186/1471-2385-6-3
- J. P. Smedema, G. Snoep, M. P. van Kroonenburgh, et al., “The Additional Value of Gadolinium-Enhanced MRI to Standard Assessment for Cardiac Involvement in Patients with Pulmonary Sarcoidosis,” Chest, Vol. 128, No. 3, 2005, pp. 1629-1637. doi:10.1378/chest.128.3.1629
- O. Vignaux, R. Dhote, D. Duboc, et al., Clinical Significance of Myocardial Magnetic Resonance Abnormalities in Patients with Sarcoidosis: A 1-Year Follow-Up Study,” Chest, Vol. 122, No. 6, 2002, pp. 1895-1901. doi:10.1378/chest.122.6.1895
- R. Kambiz, S. Harald, S. Lars, et al., “FDG-PET/CT in Patients with Cardiac Tumors,” Journal of Nuclear Medicine, Vol. 51, Suppl. 2, 2010, p. 566.
NOTES
*Corresponding author.