Journal of Behavioral and Brain Science
Vol.3 No.2(2013), Article ID:31455,5 pages DOI:10.4236/jbbs.2013.32016
Expressing Food through Art: Evidence for a Nutrient-Specific Effect on Mood
Department of Psychology, Saint Bonaventure University, St. Bonaventure, USA
Email: *gprivite@sbu.edu.
Copyright © 2013 Gregory J. Privitera et al. This is an open access article distributed under the Creative Commons Attribution License, which permits unrestricted use, distribution, and reproduction in any medium, provided the original work is properly cited.
Received March 8, 2013; revised April 9, 2013; accepted May 9, 2013
Keywords: Art; Sugar; Fat; Mood Enhancement; Arousal
ABSTRACT
Background: Brain imaging studies show evidence of selective brain reward responses to high calorie foods. Behavioral studies extend this research by showing that such foods can enhance emotions, even for sweet-tasting low calorie foods (i.e., fruits). In the present study, we tested the hypothesis that participants will show more positive emotional change when drawing pictures of foods that are high fat or taste sweet compared to bitter-tasting foods—as a possible behavioral intervention for enhancing mood. Method: Participants were randomly assigned to one of four art groups: high fat-high sugar (HFHS; stimulus food: cupcakes), high fat-low sugar (HFLS; stimulus food: pizza), low fat-high sugar (LFHS; stimulus food: strawberries), or low fat-low sugar (LFLS; stimulus food: peppers). Participants used three colors (red, green, black) in their art, were required to use all three colors, and told that the colors they use must reflect actual colors that are natural for the food depicted. Participants drew images of a stimulus food and prepost measures of mood and arousal were recorded. Results: Consistent with the hypothesis, the results show that drawing pictures of high fat foods (cupcakes, pizzas) and a food that tastes sweet (strawberries) results in greater increases in mood compared to drawing a bitter-tasting food (peppers). Changes in mood were independent of BMI, daily sugar intake, daily fat intake, arousal, and hunger. Conclusion: These results extend a growing body of biobehavioral research on the positive impact of food images on mood by showing that this impact can be applied to enhance mood when expressing food images through art.
1. Introduction
A growing body of research has investigated how people regulate emotion and negative mood [1-3] to achieve greater subjective well-being [4]. A variety of cognitive and behavioral strategies can be used to effortfully or unconsciously modify mood [3,5]. While there are strong individual differences in how people regulate mood [6,7], the need to feel good and to enhance mood is a universal goal [8]. Among clinical and nonclinical populations, evidence suggests that expressing emotion in art can significantly enhance mood [9,10], with many effects of enhanced mood attributed to the visual aesthetics of the images depicted [11]. Because the visual aesthetics of food can increase brain reward responses [12] food intake [13] and enhance emotion [14], it appears possible, but yet-to-be-tested, that expressions of foods in art can also serve to enhance mood.
Emotional regulation and eating behavior are indubitably related [15,16], with consumption of high fat and high sugar foods being associated with enhanced positive mood [17,18], although intake of these “comfort” foods is linked to the rising rates in obesity [19,20]. While studies have largely been focused on the links between emotion and eating, more recent studies have investigated how the visual aesthetics of foods (without intake of those foods) can enhance mood [21,22].
Brain imaging studies show clear evidence that reward-related areas in the human brain respond preferentially (i.e., are more active) during the visual presentation of high calorie vs. low calorie foods [12,21-23]. Behavioral data show similar patterns of over-responsiveness to images of “forbidden” foods, such as chocolates and other appetizing foods [24,25]. Visual images of sweet-tasting foods can also enhance consumption [13,26], ratings of deliciousness of foods [27], and positive emotion, even for healthy foods that taste sweet, i.e., fruits [14]. These findings suggest that without consuming food, men and women respond positively to the mere sight of many foods, which has implications for research on the effects of food on mood.
Of particular interest to the present study are the findings of Privitera, Antonelli and Creary (2013) who showed that viewing images of high fat and sweet-tasting foods enhanced emotion more so than viewing images of vegetables (low fat, low sugar foods). These findings, and those from neuroimaging studies, suggest that expressing/drawing visual images of high fat and sweet-tasting foods should have a positive effect on mood more so than expressions of bitter-tasting foods, such as vegetables. In the present study, we therefore tested for the first time the hypothesis that expressing visual images of high fat and sweet-tasting foods in art will enhance emotion more so than expressing images of a bitter-tasting low fat, low sugar food.
2. Method
2.1. Participants
A sample of 61 participants (22 men, 39 women) was recruited through university classroom visits and sign-up sheets. Participant sample characteristics were (M ± SD) age (19.9 ± 1.1 years), weight (171.7 ± 19.9 pounds), height (67.8 ± 2.4 inches), and BMI (25.4 ± 2.9 kg/m2). In an initial screening phase, participants reported being in general good health with no physical or doctor diagnosed food allergies, medical conditions including pregnancy, or dietary restrictions. Only participants who did not eat within two hours of the study were included in data analyses because hunger states can influence responsiveness to food images [12,28].
2.2. Measures
Affect Grid. Participants reported changes in mood and arousal using the Affect Grid [29], which is a valid and reliable self-report, single-item scale that assesses two dimensions of affect states: mood (positive feelings vs. negative feelings) and arousal (excitement vs. sleepiness or calmness). The scale is completed at two times and the difference in ratings from Time 1 to Time 2 is recorded. Negative difference scores indicate a decrease in mood/ arousal; positive difference scores indicate an increase in mood/arousal.
EDIS-S. The estimated daily intake scale for sugar (EDIS-S [30]) is a valid and reliable 11-item scale to estimate daily intake of sugar in one’s diet. Participants indicate their level of agreement to each item from 1 (completely disagree) to 7 (completely agree). Higher scores indicate greater daily intake of sugar. Scores on this scale were included as a covariate in data analyses.
EDIS-F. The estimated daily intake scale for fat (EDIS-F [31]) is a valid and reliable 13-item scale to estimate daily intake of fat in one’s diet. Participants indicate their level of agreement to each item from 1 (completely disagree) to 7 (completely agree). Higher scores indicate greater daily intake of fat. Scores on this scale were included as a covariate in data analyses.
2.3. Measures
Participants were observed in an art room setting in small groups of five to ten at a time. All participants signed an informed consent and completed demographic, EDIS surveys, and hunger rating scales prior to group assignment. Participants were randomly assigned to one of four art groups that varied based on the type of food stimulus participants were asked to draw: high fat-high sugar (HFHS, n = 16; stimulus food: cupcakes), high fat-low sugar (HFLS, n = 14; stimulus food: pizza), low fat-high sugar (LFHS, n = 18; stimulus food: strawberries), or low fatlow sugar (LFLS, n = 13; stimulus food: peppers). To begin, participants were given an established exercise to prime a neutral emotional state [14], by closing their eyes and imagining a place or situation that was neither positive nor negative. After 10 s participants opened their eyes and rated their current level of mood and arousal on the affect grid. This exercise was completed to keep pretest mood and arousal scores about the same between groups. Participants were then given 5 min to draw a picture of the stimulus food for the group assigned. Because the color of images can influence emotional responsiveness [12,32], participants were given three colors to use (red, green, black) in their art, required to use all three colors in their drawings, and were told that the colors they use must reflect actual colors that are natural for the food depicted. All participants followed these instructions. After 5 min they were asked to place down their colored pencils and to again rate their mood and arousal on the affect grid. Once all measures were recorded, participants were debriefed, thanked for their time, and dismissed. A sample drawing of each stimulus food by group as depicted by a participant is given in Figure 1.
2.4. Statistical Analyses
A one-way between-subjects analysis of covariance was computed with groups (HFHS, HFLS, LFHS, LFLS) as the factor, and BMI and daily intake of sugar (EDIS-S) and fat (EDIS-F) as covariates. Mood and arousal difference scores were the dependent variables. If significant, 95% confidence intervals (CIs) were drawn to determine if mood and arousal ratings significantly changed prepost in each group. All tests were conducted at a 0.05 level of significance.
3. Results
No significant differences between groups were evident for pretest scores of mood and arousal (p > 0.50 for each measure between groups); hence, initial ratings on these measures were statistically similar prior to the art session. After the art session, a significant main effect of mood was evident, F(3,53) = 3.00, p = 0.04, R2 = 0.15. As shown in Figure 2, Groups HFHS, HFLS, and HSLF showed significantly greater increases in mood compared to Group LFLS (Tukey’s HSD, p < 0.05). Within-group comparisons showed that mood significantly increased following the art session for the HFHS food (95% CI 1.14, 3.28), HFLS food (95% CI 1.10, 3.30), LFHS food (95% CI 0.72, 2.68), but not the LFLS food (95% CI –1.05, 1.28). Ratings of arousal (p = 0.45) and ratings of hunger (p = 0.60) did not significantly differ between groups with or without the inclusion of covariates in the analysis.

Figure 1. A sample participant drawing of each stimulus food for each group.
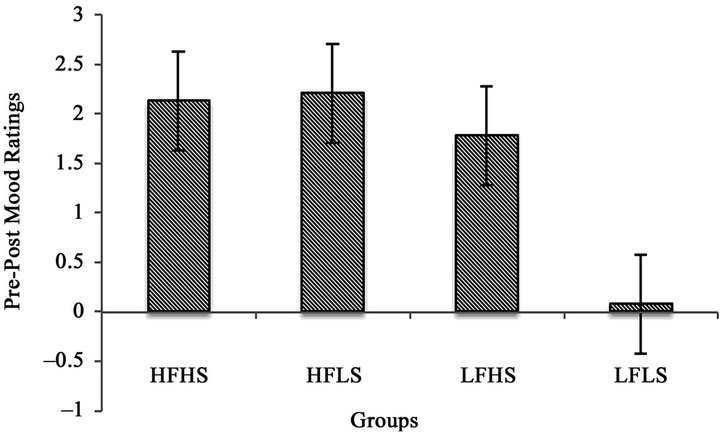
Figure 2. Mean difference by groups in mood ratings following the art session. Results show significantly positive changes in mood following the art session for all groups, except Group LFLS. Error bars indicate SEM.
4. General Discussion
The hypothesis that expressing visual images of high fat and sweet-tasting foods in an art session will enhance emotion more so than expressing images of a bitter-tasting low fat, low sugar food was tested. These results corroborate brain-imaging studies and extend behavioral findings by showing, consistent with the hypothesis, that drawing pictures of high fat foods (cupcakes, pizzas) and a food that tastes sweet (strawberries) results in greater increases in mood compared to drawing a bitter-tasting food (peppers). Peppers were chosen as a bitter-tasting food because even “sweet” peppers are often reported as tasting bitter [33] and also because it was one of the few bitter-tasting foods in which the three colored pencils chosen for this study could be used with colors inherent to the food itself.
Some alternative explanations can be eliminated because of experimental controls included in the research design. Changes in mood enhancement due to differences in the colors used are unlikely because the same three colors were used in each group. In addition, the colors that were chosen allowed participants to color each food image with colors that were inherent to the food depicted, meaning that the results are most likely due to the objective depiction of the food itself, and not the participant’s abstract interpretation of the image. In addition, changes in arousal, which can be correlated with changes in mood [14], also did not differ between groups. Hence, the positive effects of creating artistic images of high fat and sweet-tasting foods was likely specific to the actual concrete depiction of these foods, which are known to stimulate a human brain reward response [12,21].
A particularly interesting outcome in the present study is the finding that the observed changes in mood were statistically independent of BMI, daily sugar intake, daily fat intake, and hunger. An implication of this outcome is that creating images of high fat and sweet-tasting foods to enhance mood should be an effective strategy to enhance mood for all types of people across the spectrum of BMI categories and dietary histories. The extent to which depicting high fat, high sugar, and sweet-tasting foods in an art session can result in long-term benefits in mood enhancement or the extent to which combining the present strategy with interventions to further enhance treatment of mood among clinical populations cannot be determined here, but should and can be tested in future studies.
5. Conclusion
The results presented here demonstrate that artistic expressions of high fat, high sugar, and sweet-tasting foods in an art session can be used as an effective short-term intervention to enhance mood, and these results further extend a growing body of neurobiological and behavioral research showing a significant impact of the visibility of high fat, high sugar, and sweet-tasting foods on positive mood changes [12,14,21-24]. These findings further suggest that interventions used to enhance mood can focus on depicting images of high fat, high sugar, and sweet-tasting foods to produce the largest positive changes in mood when foods are used as the stimulus image.
6. Acknowledgements
This research was partly supported by an internal faculty research grant awarded to the first author.
REFERENCES
- E. Diener, “Subjective Well-Being: The Science of Happiness and a Proposal for a National Index,” The American Psychologist, Vol. 55, No. 1, 2000, pp. 34-43. doi:10.1037/0003-066X.55.1.34
- J. J. Gross, “The Emerging Field of Emotion Regulation: An Integrative Review,” Review of General Psychology, Vol. 2, No. 3, 1998, pp. 271-299. doi:10.1037/1089-2680.2.3.271
- R. J. Larsen, “Toward a Science of Mood Regulation,” Psychological Inquiry, Vol. 11, No. 3, 2000, pp. 129-141.
- M. E. P. Seligman and M. Csikszentmihalyi, “Positive Psychology: An Introduction,” The American Psychologist, Vol. 55, No. 1, 2000, pp. 5-14. doi:10.1037/0003-066X.55.1.5
- C. S. Carver and M. F. Scheier, “Origins and Function of Positive and Negative Affect: A Control Process View,” Psychological Review, Vol. 97, No. 1, 1990, pp. 19-35. doi:10.1037/0033-295X.97.1.19
- R. J. Larsen and E. Diener, “Affect Intensity as an Individual Difference Characteristic: A Review,” Journal of Research in Personality, Vol. 21, No. 1, 1987, pp. 1-39. doi:10.1016/0092-6566(87)90023-7
- J. M. Zelinsky and R. J. Larsen, “Susceptibility to Affect. A Comparison of Three Personality Taxonomies,” Journal of Personality, Vol. 67, No. 5, 1999, pp. 761-791. doi:10.1111/1467-6494.00072
- D. M. Buss, “The Evolution of Happiness,” The American Psychologist, Vol. 55, No. 1, 2000, pp. 15-23. doi:10.1037/0003-066X.55.1.15
- A. Dalebroux, T. R. Goldstein and E. Winner, “ShortTerm Mood Repair through Art-Making: Positive Emotion Is More Effective than Venting,” Motivation & Emotion, Vol. 32, No. 4, 2008, pp. 288-295. doi:10.1007/s11031-008-9105-1
- C. Dere-Meyer, B. Bender, E. Metzl and K. Diaz, “Psychotropic Medication and Art Therapy: Overview of Literature and Clinical Considerations,” The Arts in Psychotherapy, Vol. 38, No. 1, 2011, pp. 29-35. doi:10.1016/j.aip.2010.10.003
- A. Byers, “Visual Aesthetics in Dementia,” International Journal of Art Therapy, Vol. 16, No. 2, 2011, pp. 81-89. doi:10.1080/17454832.2011.602980
- S. Frank, N. Laharnar, S. Kullmann, R. Veit, C. Canova, Y. L. Hegner, et al., “Processing of Food Pictures: Influence of Hunger, Gender and Calorie Content,” Brain Research, Vol. 1350, 2010, pp. 159-166. doi:10.1016/j.brainres.2010.04.030
- G. J. Privitera and H. E. Creary, “Proximity and Visibility of Fruits and Vegetables Influences Intake in a Kitchen Setting among College Students,” Environment and Behavior, Vol. 45, No. 5, 2013. doi:10.1177/0013916512442892
- G. J. Privitera, D. E. Antonelli and H. E. Creary, “The Effect of Food Images on Mood and Arousal Depends on Dietary Histories and the Fat and Sugar Content of Foods Depicted,” Journal of Behavioral and Brain Science, Vol. 3, No. 1, 2013, pp. 1-6. doi:10.4236/jbbs.2013.31001
- A. W. Logue, “The Psychology of Eating and Drinking, 3rd Edition, Brunner-Routledge, New York, 2004.
- M. Macht and G. Simons, “Emotions and Eating in Everyday Life,” Appetite, Vol. 35, No. 1, 2000, pp. 65-71. doi:10.1006/appe.2000.0325
- B. Wansink, M. M. Cheney and N. Chan, “Exploring Comfort Food Preferences across Age and Gender,” Physiology & Behavior, Vol. 79, No. 4-5, 2003, pp. 739-747. doi:10.1016/S0031-9384(03)00203-8
- L. Dubé, J. L. LeBel and J. Lu, “Affect Asymmetry and Comfort Food Consumption,” Physiology & Behavior, Vol. 86, No. 4, 2005, pp. 559-567. doi:10.1016/j.physbeh.2005.08.023
- M. S. Faith, D. B. Allison and A. Geliebter, “Emotional Eating and Obesity: Theoretical Considerations and Practical Recommendations,” In: S. Dalton, Ed., Overweight and Weight Management: The Health Professional’s Guide to Understanding and Practice, Aspen Publishers, Gaithersburg, 1997, pp. 439-465.
- S. C. Sanderson, “Obesity Risk,” In: K. P. Tercyak, Ed., Handbook of Genomics and the Family: Psychosocial Context for Children and Adolescents, Springer Science + Business Media, New York, 2010, pp. 329-343.
- W. D. Killgore, A. D. Young, L. A. Femia, P. Bogorodzki, J. Rogowska and D. A. Yurgelun-Todd, “Cortical and Limbic Activation during Viewing of Highversus LowCalorie Foods,” Neuroimage, Vol. 19, No. 4, 2003, pp. 1381-1394. doi:10.1016/S1053-8119(03)00191-5
- W. K. Simmons, A. Martin and L. W. Barsalou, “Pictures of Appetizing Foods Activate Gustatory Cortices for Taste and Reward,” Cerebral Cortex, Vol. 15, No. 10, 2005, pp. 1602-1608. doi:10.1093/cercor/bhi038
- G. J. Wang, N. D. Volkow, F. Telang, M. Jayne, J. Ma, M. Rao, et al., “Exposure to Appetitive Food Stimuli Markedly Activates the Human Brain,” Neuroimage, Vol. 21, No. 4, 2004, pp. 1790-1797. doi:10.1016/j.neuroimage.2003.11.026
- B. Fletcher, K. J. Pine, Z. Woodridge and A. Nash, “How Visual Images of Chocolate Affect the Craving and Guilt of Female Dieters,” Appetite, Vol. 48, No. 2, 2007, pp. 211-217. doi:10.1016/j.appet.2006.09.002
- D. D. Wagner, R. G. Boswell, W. M. Kelley and T. F. Heatherton, “Inducing Negative Affect Increases the Reward Value of Appetizing Foods in Dieters,” Journal of Cognitive Neuroscience, Vol. 24, No. 7, 2012, pp. 1625- 1633. doi:10.1162/jocn_a_00238
- B. Wansink, J. E. Painter and Y.-K. Lee, “The Office Candy Dish: Proximity’s Influence on Estimated and Actual Consumption,” International Journal of Obesity, Vol. 30, No. 5, 2006, pp. 871-875. doi:10.1038/sj.ijo.0803217
- H. Yoshimura, M. Honjo, T. Sugai, M. Kawabe, K. Kaneyama, N. Segami and N. Kato, “Influences of Audio-Visual Environments on Feelings of Deliciousness during Having Sweet Foods: An Electroencephalogram Frequency Analysis Study,” Nutritional Neuroscience, Vol. 14, No. 5, 2011, pp. 210-215.
- G. J. Wang, N. D. Volkow, F. Telang, M. Jayne, Y. Ma, K. Pradhan, et al., “Evidence of Gender Differences in the Ability to Inhibit Brain Activation Elicited by Food Stimulation,” Proceedings of the National Academy of Sciences, Vol. 106, No. 4, 2009, pp. 1249-1254.
- J. A. Russell, A. Weiss and G. A. Mendelsohn, “Affect Grid: A Single-Item Scale of Pleasure and Arousal,” Journal of Personality and Social Psychology, Vol. 57, No. 3, 1989, pp. 493-502. doi:10.1037/0022-3514.57.3.493
- G. J. Privitera and M. Wallace, “An Assessment of Liking for Sugars Using the Estimated Daily Intake Scale,” Appetite, Vol. 56, No. 1, 2011, pp. 713-718. doi:10.1016/j.appet.2011.02.008
- G. J. Privitera and C. S. Freeman, “Validity and Reliability of an Estimated Daily Intake Scale for Fat,” Global Journal of Health Science, Vol. 4, No. 2, 2012, pp. 36-41. doi:10.5539/gjhs.v4n2p36
- K. Seong-In, “A Computer System for the Analysis of Color-Related Elements in Art Therapy Assessment: Computer-Color-Related Elements Art Therapy Evaluation System (C_CREATES),” The Arts & Psychotherapy, Vol. 37, 2010, pp. 378-386. doi:10.1016/j.aip.2010.09.002
- B. J. Tepper, T. Z. A. Williams, J. R. Burgess, C. J. Antalis and R. D. Mattes, “Genetic Variation in Bitter Taste and Plasma Markers of Anti-Oxidant Status in College Women,” International Journal of Food Sciences and Nutrition, Vol. 60, No. S2, 2009, pp. 35-45. doi:10.1080/09637480802304499
NOTES
*Corresponding author.