Agricultural Sciences
Vol.4 No.8(2013), Article ID:35097,7 pages DOI:10.4236/as.2013.48051
Water budgets for freshwater aquaculture ponds with reference to effluent volume
![]()
Central Institute of Freshwater Aquaculture, Bhubaneswar, India; *Corresponding Author: kks8498@rediffmail.com
Copyright © 2013 K. K. Sharma et al. This is an open access article distributed under the Creative Commons Attribution License, which permits unrestricted use, distribution, and reproduction in any medium, provided the original work is properly cited.
Received 6 April 2013; revised 7 May 2013; accepted 7 May 2013
Keywords: Water Budgets; Freshwater Aquaculture; Ponds; Carps; Seepage; Pond Evaporation
ABSTRACT
This paper presents the consumptive water use for freshwater pond aquaculture for semi-intensive carps farming practices. The consumptive use of water includes evaporation loss, seepage loss and water exchanges requirements. The water requirement has been estimated to be 10.3 m3/Kg of fish production under present study for semi-intensive culture and with supplemental feeding. Out of which 7.6 m3/Kg of fish production is system associated requirement. On an average the evaporation loss from the pond is 1498.3 mm/year and seepage loss per year is about 1182.60 mm/year. Seepage and water exchange losses recharge the ground water aquifers and if they are treated and recycled, the water use in aquaculture can be reduced significantly. A further reduction in fresh water use in pond aquaculture is possible through development of intensive and superintensive culture systems and aqua feeds.
1. INTRODUCTION
Indian aquaculture has demonstrated a six and half fold growth over the last two decades, with freshwater aquaculture contributing over 95 percent of the total aquaculture production. The production of carp in freshwater and shrimps in brackish water form the major activity of the areas. The three Indian major carps, namely catla (Catla catla), rohu (Labeo rohita) and mrigal (Cirrhinus mrigala) contribute the bulk of production with over 1.8 million tonnes [1]; followed by silver carp, grass carp and common carp forming a second important group. Average national production from still water ponds has increased from 0.6 tonnes/ha/year in 1974 to 2.2 tonnes/ha/year by 2001-2002 [2], with several farmers even demonstrating production levels as high as 8 - 12 tonnes/ha/year. The technologies of induced carp breeding and polyculture in static ponds and tanks virtually revolutionized the freshwater aquaculture sector and turned the sector into a fast growing industry.
Fish culture is a water-intensive endeavor and requires much more water than conventional agriculture [3]. The current expansion of freshwater aquaculture in the India may require large quantity of freshwater either groundwater or surface water. There already exists concern of adequate water supplies for traditional agriculture. Further, uncertainty in monsoon rain, scare and limited availability of freshwater resource have forced in rethinking wise-use of freshwater in aquaculture sector to increase water productivity. Nowaday’s water is increasingly becoming less available and costly to procure. World in general and India in particular, the freshwater supply and reserve are now under threat due to increased population following by increased demand of water in agriculture, aquaculture, industry and domestic sectors. Unplanned wasteful use of water in aquaculture is limiting further development of this sector. Therefore, more research is badly needed on water requirements in pond aquaculture and how to minimize the water use. Till date in India, very little work has been carried out in this regard to quantify optimum water requirement for hatchery, nursery, rearing and grow-out culture of carps. A few researchers outside [3-6] have worked out water budgets based on pond measurements for different type of systems/ponds and also in different climatic conditions. Reference [7] developed water budget model as a general methodology that can be adopted to predict water requirements for new locations and [8] has developed water budgets for portable carp hatchery. Because of increasing demand to produce more per unit volume of water resource, the quantification of water requirement for fish culture assumes great importance in view of proper planning [9] for judicious use of freshwater resource of the country. Reference [10] compared the water use in aquaculture with water used for terrestrial animal production. Water budgeting is very important for estimating the total water requirements of ponds, flow through facilities, hatcheries etc. and also to estimate and predict the fish culture potential for different regions.
This paper presents the consumptive water requirements for freshwater pond aquaculture at study site. The hydrology of pond is depending on local conditions, soil type, construction methods, seepage, evaporation, rainfall and other criteria. However the knowledge or protocols about estimating water use for pond aquaculture developed in this study could be applied in the same agroclimatic region of the country.
2. MATERIALS AND METHODS
2.1. Experimental Site
The experimental site is the farm of Central Institute of Freshwater Aquaculture, Bhubaneswar (CIFA) (Latitude: 20˚11'06"N; Longitude: 85˚50'52"E and msl: 33 m), Orissa, India, consists of around 350 ponds ranging from 0.01 ha to 4 ha in area (total about 50 ha cultured water body) with depth running from 1 m to 4.5 m. Ponds have been constructed by making earthen embankments around the storage area. These ponds are either rectangular or square in shape. The ponds are mainly divided into two categories, one is where there is ground water contribution during few months and other where these are built in swampy area and retain water throughout the year. The water in ponds is generally maintained by supply of the water either from nearby canal or reservoirs. Such ponds are having outflow pipes to drain off excess water/rainfall in a regulated manner. These ponds are also receiving ground water contribution during some of the month of a year, when surrounding water table is high because of flow in nearby canal. The hydrology of these ponds mainly depends on soil type, water table depth, flow in canals, methods of construction, seepage, evaporation and rainfall etc. The soil composition at Study site-I was sand 88%, silt 8% and clay 4%. Similarly the soil composition at Study site-II was sand 82%, silt 10% and clay 8%.
The farm is located between Latitude: 20˚11'06"N; Longitude: 85˚50' 52"E and msl: 33 m. The study area is characterized as warm and humid climate, where humidity is always very high and in summer it reaches up to 99%. The summer temperature rises to 44˚C and winter lowest temperature reaches 4˚C. The averages annual rainfall is about 1120 mm of the region. The rainy season generally occurs from May to September and then there is a post monsoon rainfall also.
2.2. Experimental Designs and Hydrological Measurements
The water budgets study was conducted in three numbers of rearing fishponds initially for one-year period (2007-2008). These ponds were stocked with rohu, catla and mrigal fingerlings of size ranging 4 mm to 6 mm at stocking density of 7000 per hectare. Ponds were fed with floating pelleted feed twice a day at the rate of 2% of body weight of fish. In order to study the effect of special variability and confirm the results obtained, next year same study was conducted in three different ponds at CIFA farm. The ponds are rectangular in shape of size 50 m × 20 m of each and the depths of the pond were about 1.5 m. The water level in ponds was maintained ranging 1.0 m to 1.2 m by providing out let pipes of 15 cm diameter to each pond. These ponds were also provided with inlet pipe of 15 cm diameter from the supply channel for introducing water in the ponds from reservoirs or nearby irrigation canal.
To measure water level changes in ponds, a water level recorder was fabricated which consist of a standpipe and glass cylinder with scale for measurement. The water level is measured inside the measuring cylinder to eliminate the effect of wind wave on stage. These instruments were installed inside the each pond and data on stage change of pond water were taken on daily basis between 7.30 to 8.00 hr. In the next year, these pond water level stage recorders were installed in other nine numbers of ponds for conformity of the results obtained.
A class A Evaporation pan was installed on dyke of pond for measurement of evaporation losses. A hook facilitated accurate estimates of water level changes in the pan. A standard rain gauge was provided in the farm area to measure the rainfall during the study period. The catch of the rain gauge also allowed corrections of water level changes in the evaporation pan so that evaporation could be measured accurately by subtracting rain gauge catch water.
Pond evaporation was estimated by using pan coefficient. The pan-pond coefficient was determined by measuring the stages in the Reinforced Cement Concrete (RCC) tank of 10 m × 5 m of size and with 1.2 m depths with effective water depth at around 1.0 m available in the farm. A staff gauge was fixed inside the tank and the stage at the top of the gauge was fixed. The data on water stages were recorded on daily basis by maintaining the water level in the tank by adding the evaporation losses.
Regulated inflow and out flow from the ponds were measured by providing the inlet and outlet pipes of 15cm diameter of PVC materials. Flow meters were installed in these pipes for measuring the regulated flows.
Runoff was estimated by a curve number method [11]. The soil was classified to a particular hydrologic group based on texture; hydrologic soil group and vegetative cover were then used to obtain curve number. The area from estimating the runoff contributions to each pond was taken as 50% of the pond dyke area because these ponds are levee ponds.
The data as discussed above were collected regularly for one-year period starting from April to March. The pond-pan coefficient, pond evaporation and pond seepage were calculated as follows:
Pond-pan coefficient = Class A pan evaporation/Evaporation from RRC tank
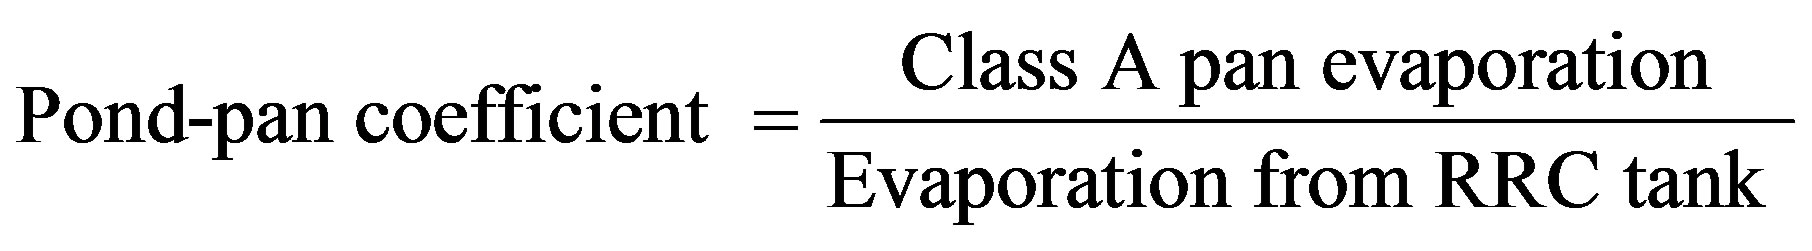 (1)
(1)
 (2)
(2)
Pond Seepage:
Case 1: When there is no rainfall
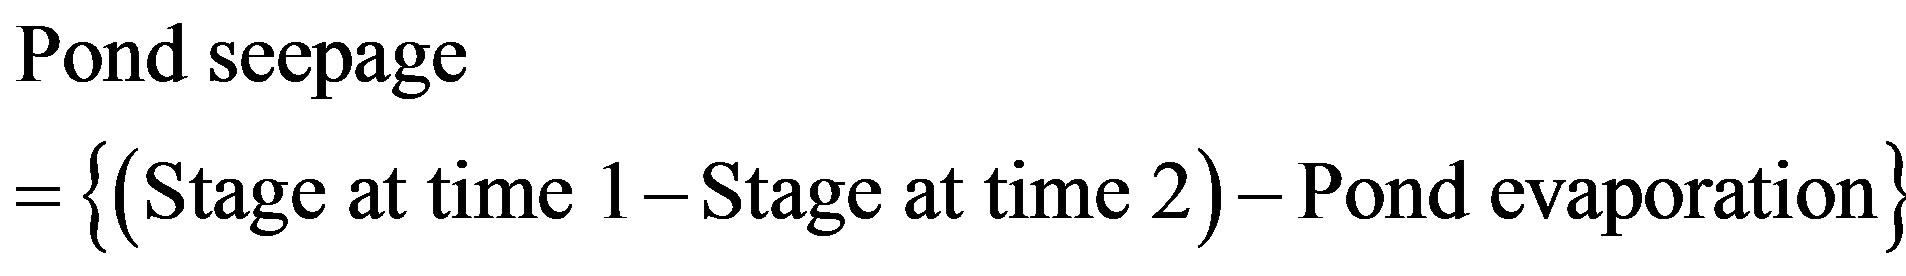 (3)
(3)
Case 2: When there is rainfall
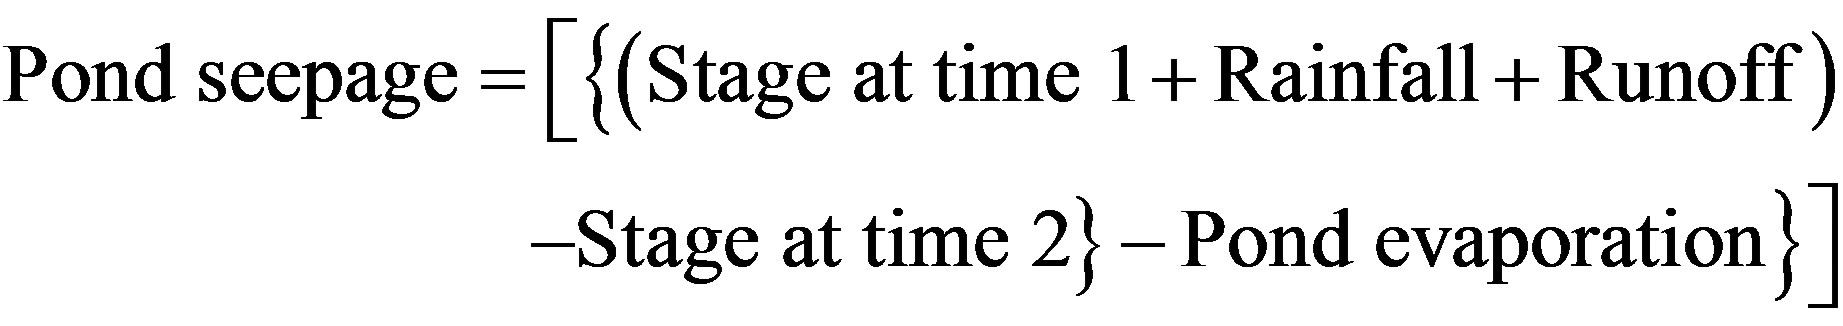 (4)
(4)
Case 3: When there is heavy rain and overflow
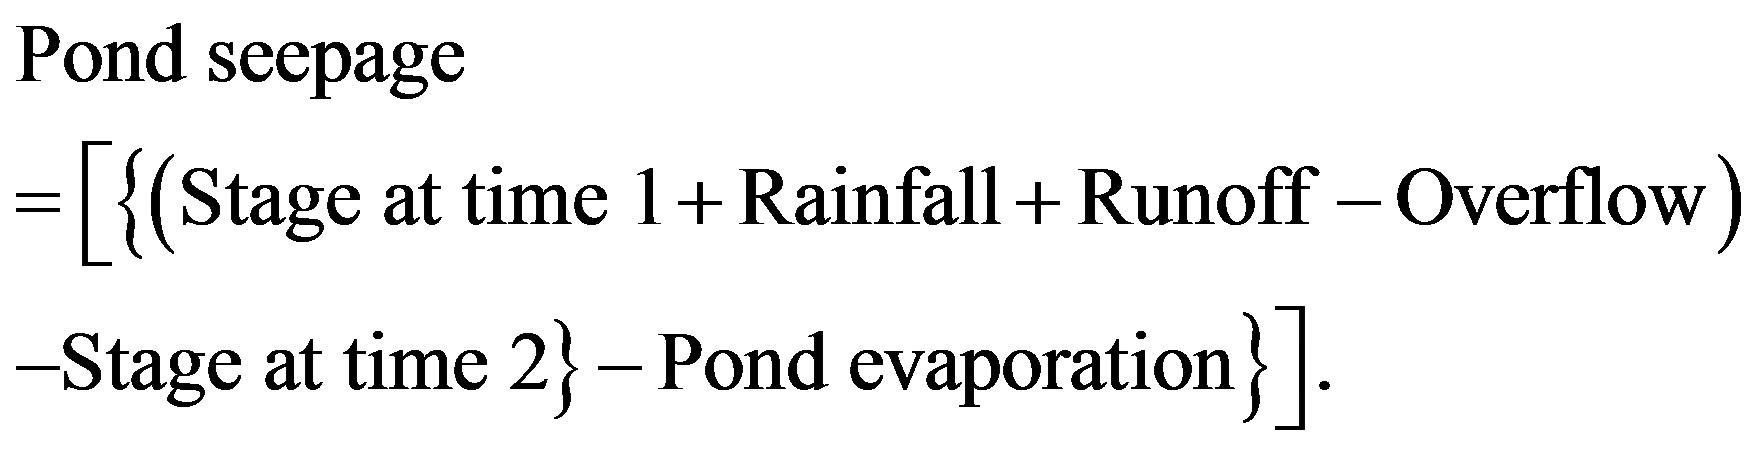 (5)
(5)
3. RESULTS AND DISCUSSION
3.1. Determination of Pond-Pan Coefficient
The pond-pan coefficient was determined for calculation of pond evaporation from the pond water stage data. The daily evaporation data from class A pan evaporimeter and RCC tank of 10 m × 5 m size were scrutinized to get the weekly data. These weekly data were plotted and fitted with straight line (Figure 1). The slope of the line is taken as the pond-pan evaporation coefficient. The pond-pan coefficient for the present case has been estimated as 0.68. This coefficient was later used to separate the pond evaporation and pond seepage from the daily stage data.
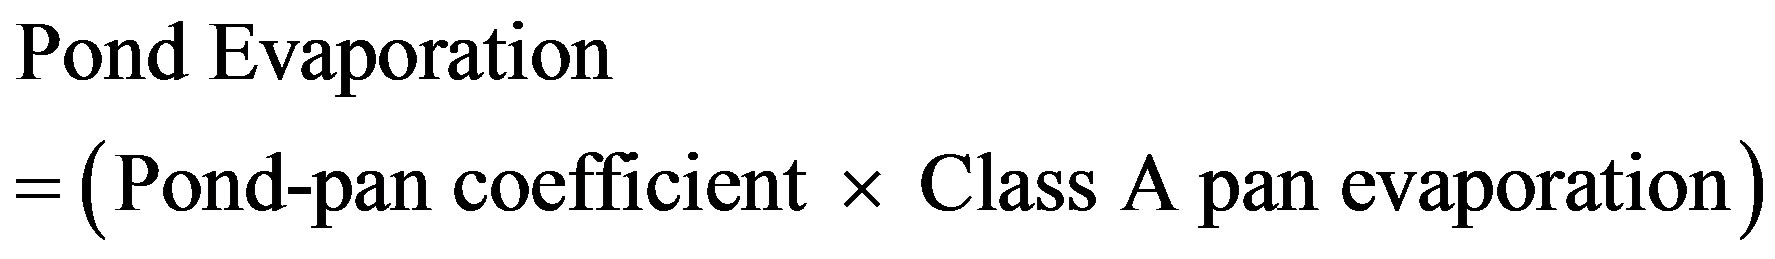
3.2. Pond Evaporation Losses
Significantly amount of water can be lost from the pond via evaporation, whether it may be either small or larger ponds. Evaporative water loss is primarily a function of ambient air temperature, relative humidity, solar radiation and wind velocity. The daily data of pan evaporation were scrutinized to get the weekly pan evaporation. These weekly pan evaporation data were multiplied by pond-pan coefficient to get the pond evaporation. The daily pond evaporation on an average varied from 0.20 ± 0.05 mm to 5.96 ± 0.75 mm during different months of the year. Mean weekly variation of pond evaporation is presented in Figure 2. Weekly pond evaporation averaged 35.65 ± 6.78 mm. On an average the evaporation loss from the pond is 1498.3 ± 8.61 mm/year. High evaporation rates during the dry months were influenced by lower humidity, strong weed speed and higher solar radiation. But, in case of rainy months, the pond evaporation was lower due to presence of higher humidity.
3.3. Pond Seepage Losses
High seepage rate is not only the results in water losses but also affects the pond fertility, pond dynamics and environment. Pond water loss or gain by seepage depends on primarily on the soil porosity, methods of pond construction, and structural changes over the period of time and pond management. The daily data of pond seepage were separated from daily pond water stage changes data recorded by installing the pond water level recorder in each pond by deducting the pond evaporation data calculated above using pond-pan coefficient. The daily seepage rate on an average varied from 1.1 ± 0.20
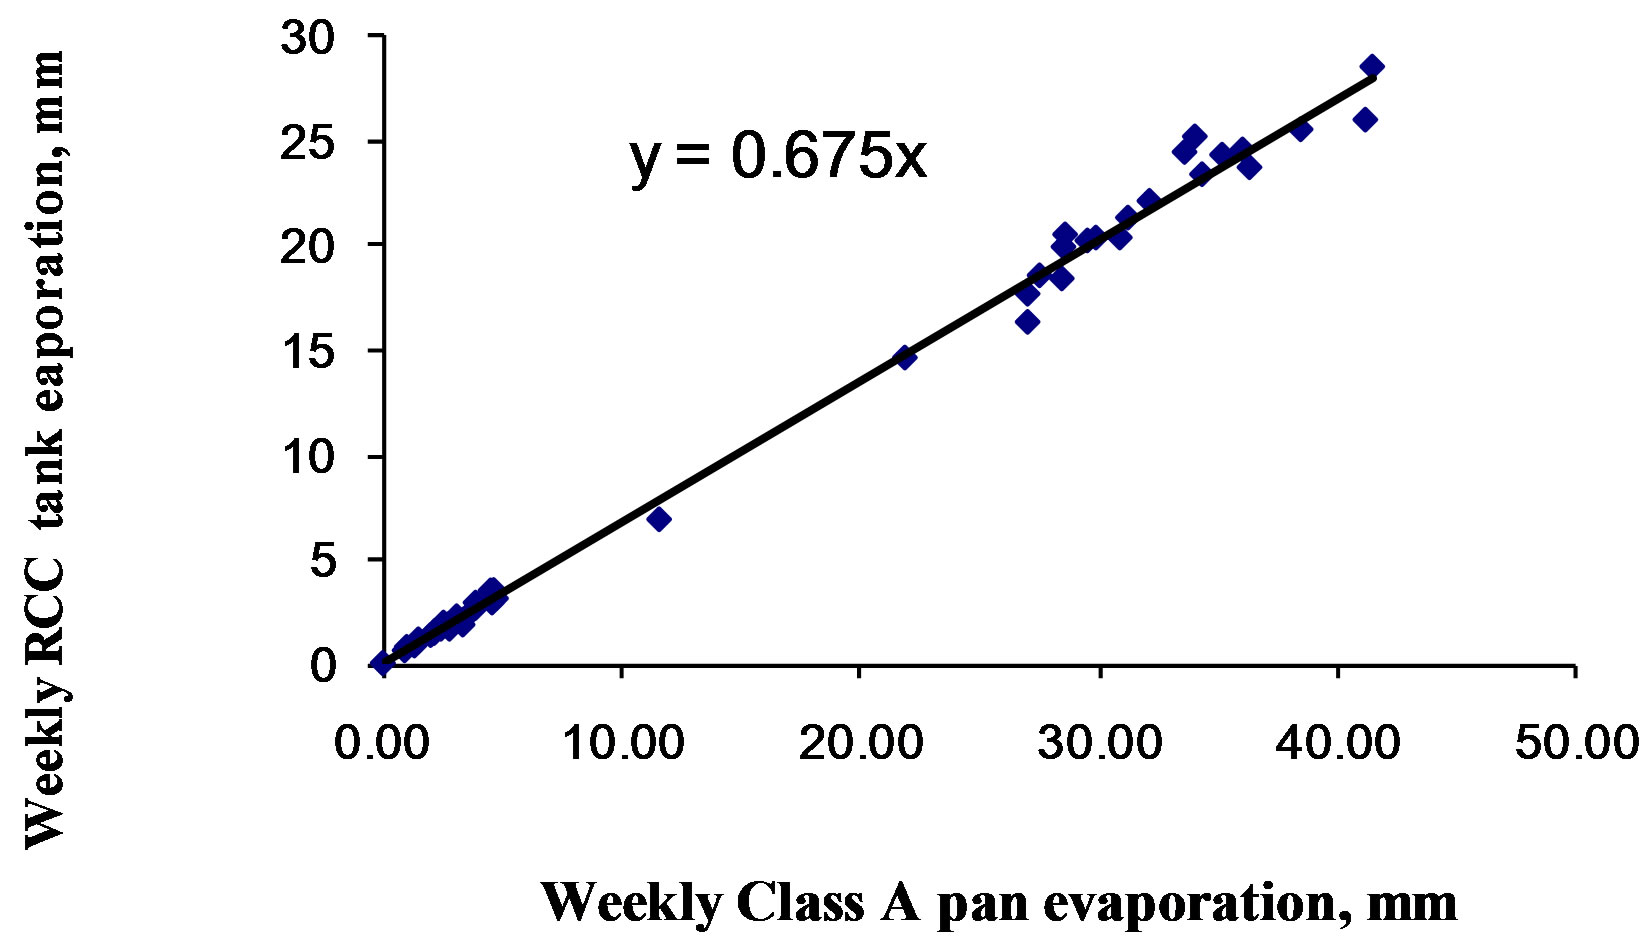
Figure 1. Relationaship between weekly open PanReinforced Concrete Cement tank evaporation.
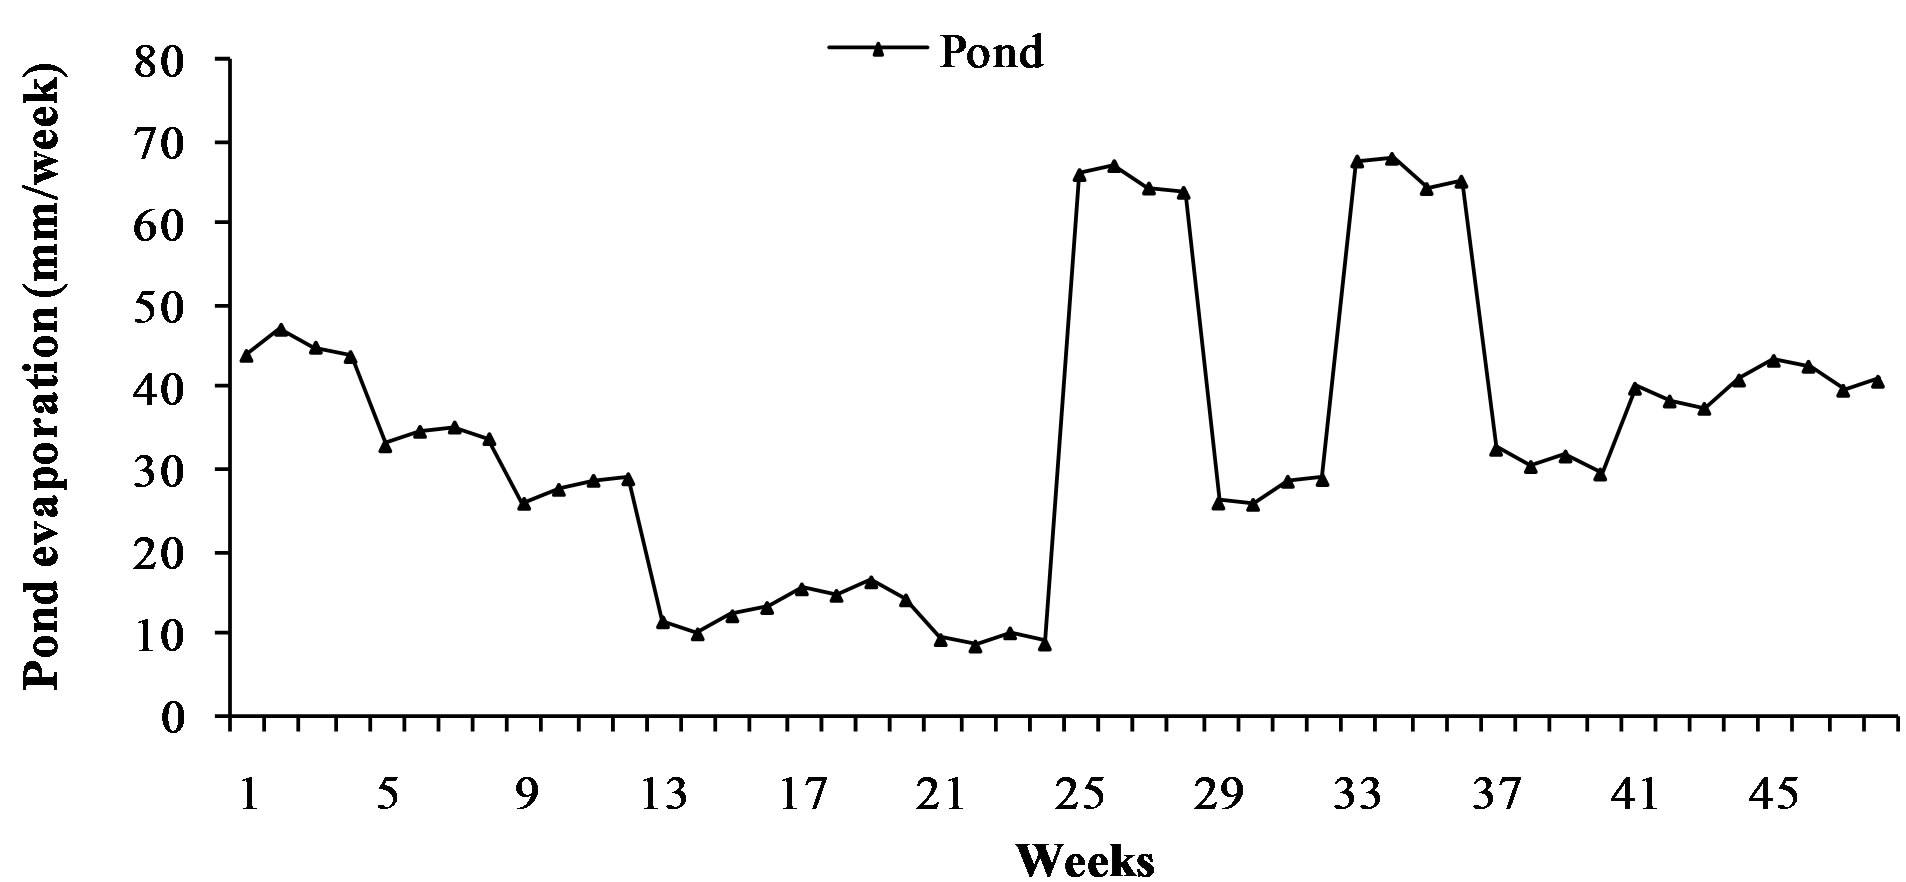
Figure 2. Mean weekly variation of pond evaporation at Study site.
mm/day to 14.26 ± 1.50 mm/day during different months of the year. Mean weekly seepage for the present study is shown in Figure 3. The mean weekly seepage rates ranged from 8.28 ± 2.15 to 84.41 ± 3.60 mm. On average the seepage loss is about 1182.60 ± 10.16 mm/year. The rates of seepage in rainy months were almost 20% - 25% less than the dry months. Seepage losses are generally lower during rainy months, which may be due to rainwater infiltrated through pond dykes and that decreased the net seepage losses.
3.4. Rainfall
Measured mean monthly rainfalls during 2006-2009 were shown in Figure 4. In the warm and humid climate rainfall started from early June and continue up to October. During rainy months, the pond water compensated by rainfall. While remaining months, regulated inflow of water was required for each month to replace water losses to pond evaporation during the study period.
3.5. Water Budgets for Pond Aquaculture
The average water budgets have been prepared and summarized in Table 1. From table it is evident that in almost all the months during the year, water had to be added to meet the requirement of water losses from fishponds except during rainy season where in water losses were compensated by gain in ponds either directly from rain or ground water contribution. The monthly average gain was highest in the month of June and lowest in April. Whereas inflow was quite higher in the month of April and lower in July. Total water gain, pond evaporation, seepage and water addition for a year is 1761.8 ± 5.84 1498.3 ± 8.61, 1182.60 ± 10.16 and 2431.2 ± 15.47 mm for the present study.
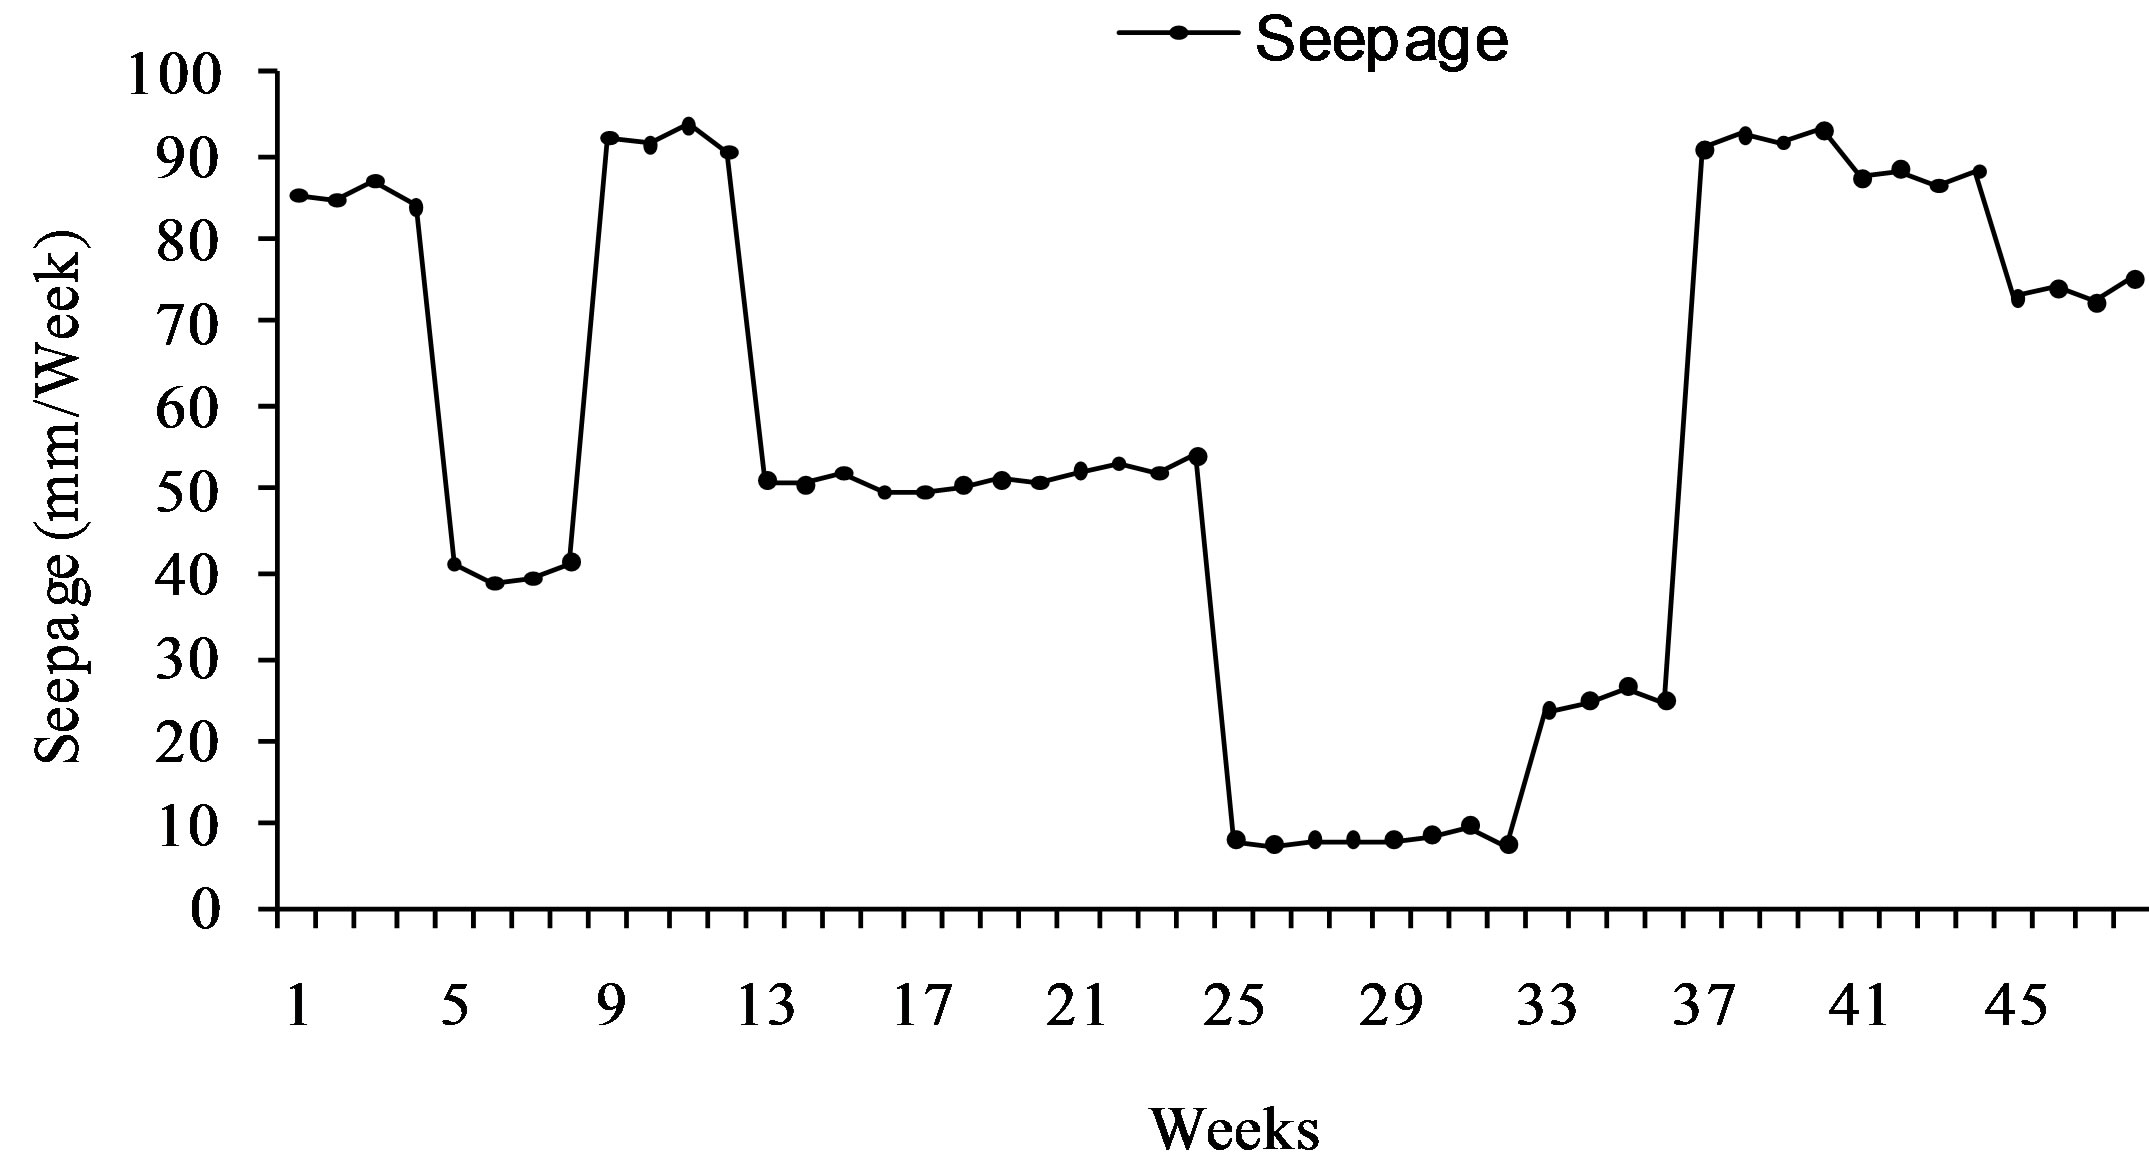
Figure 3. Mean weekly variation of seepage at study site.
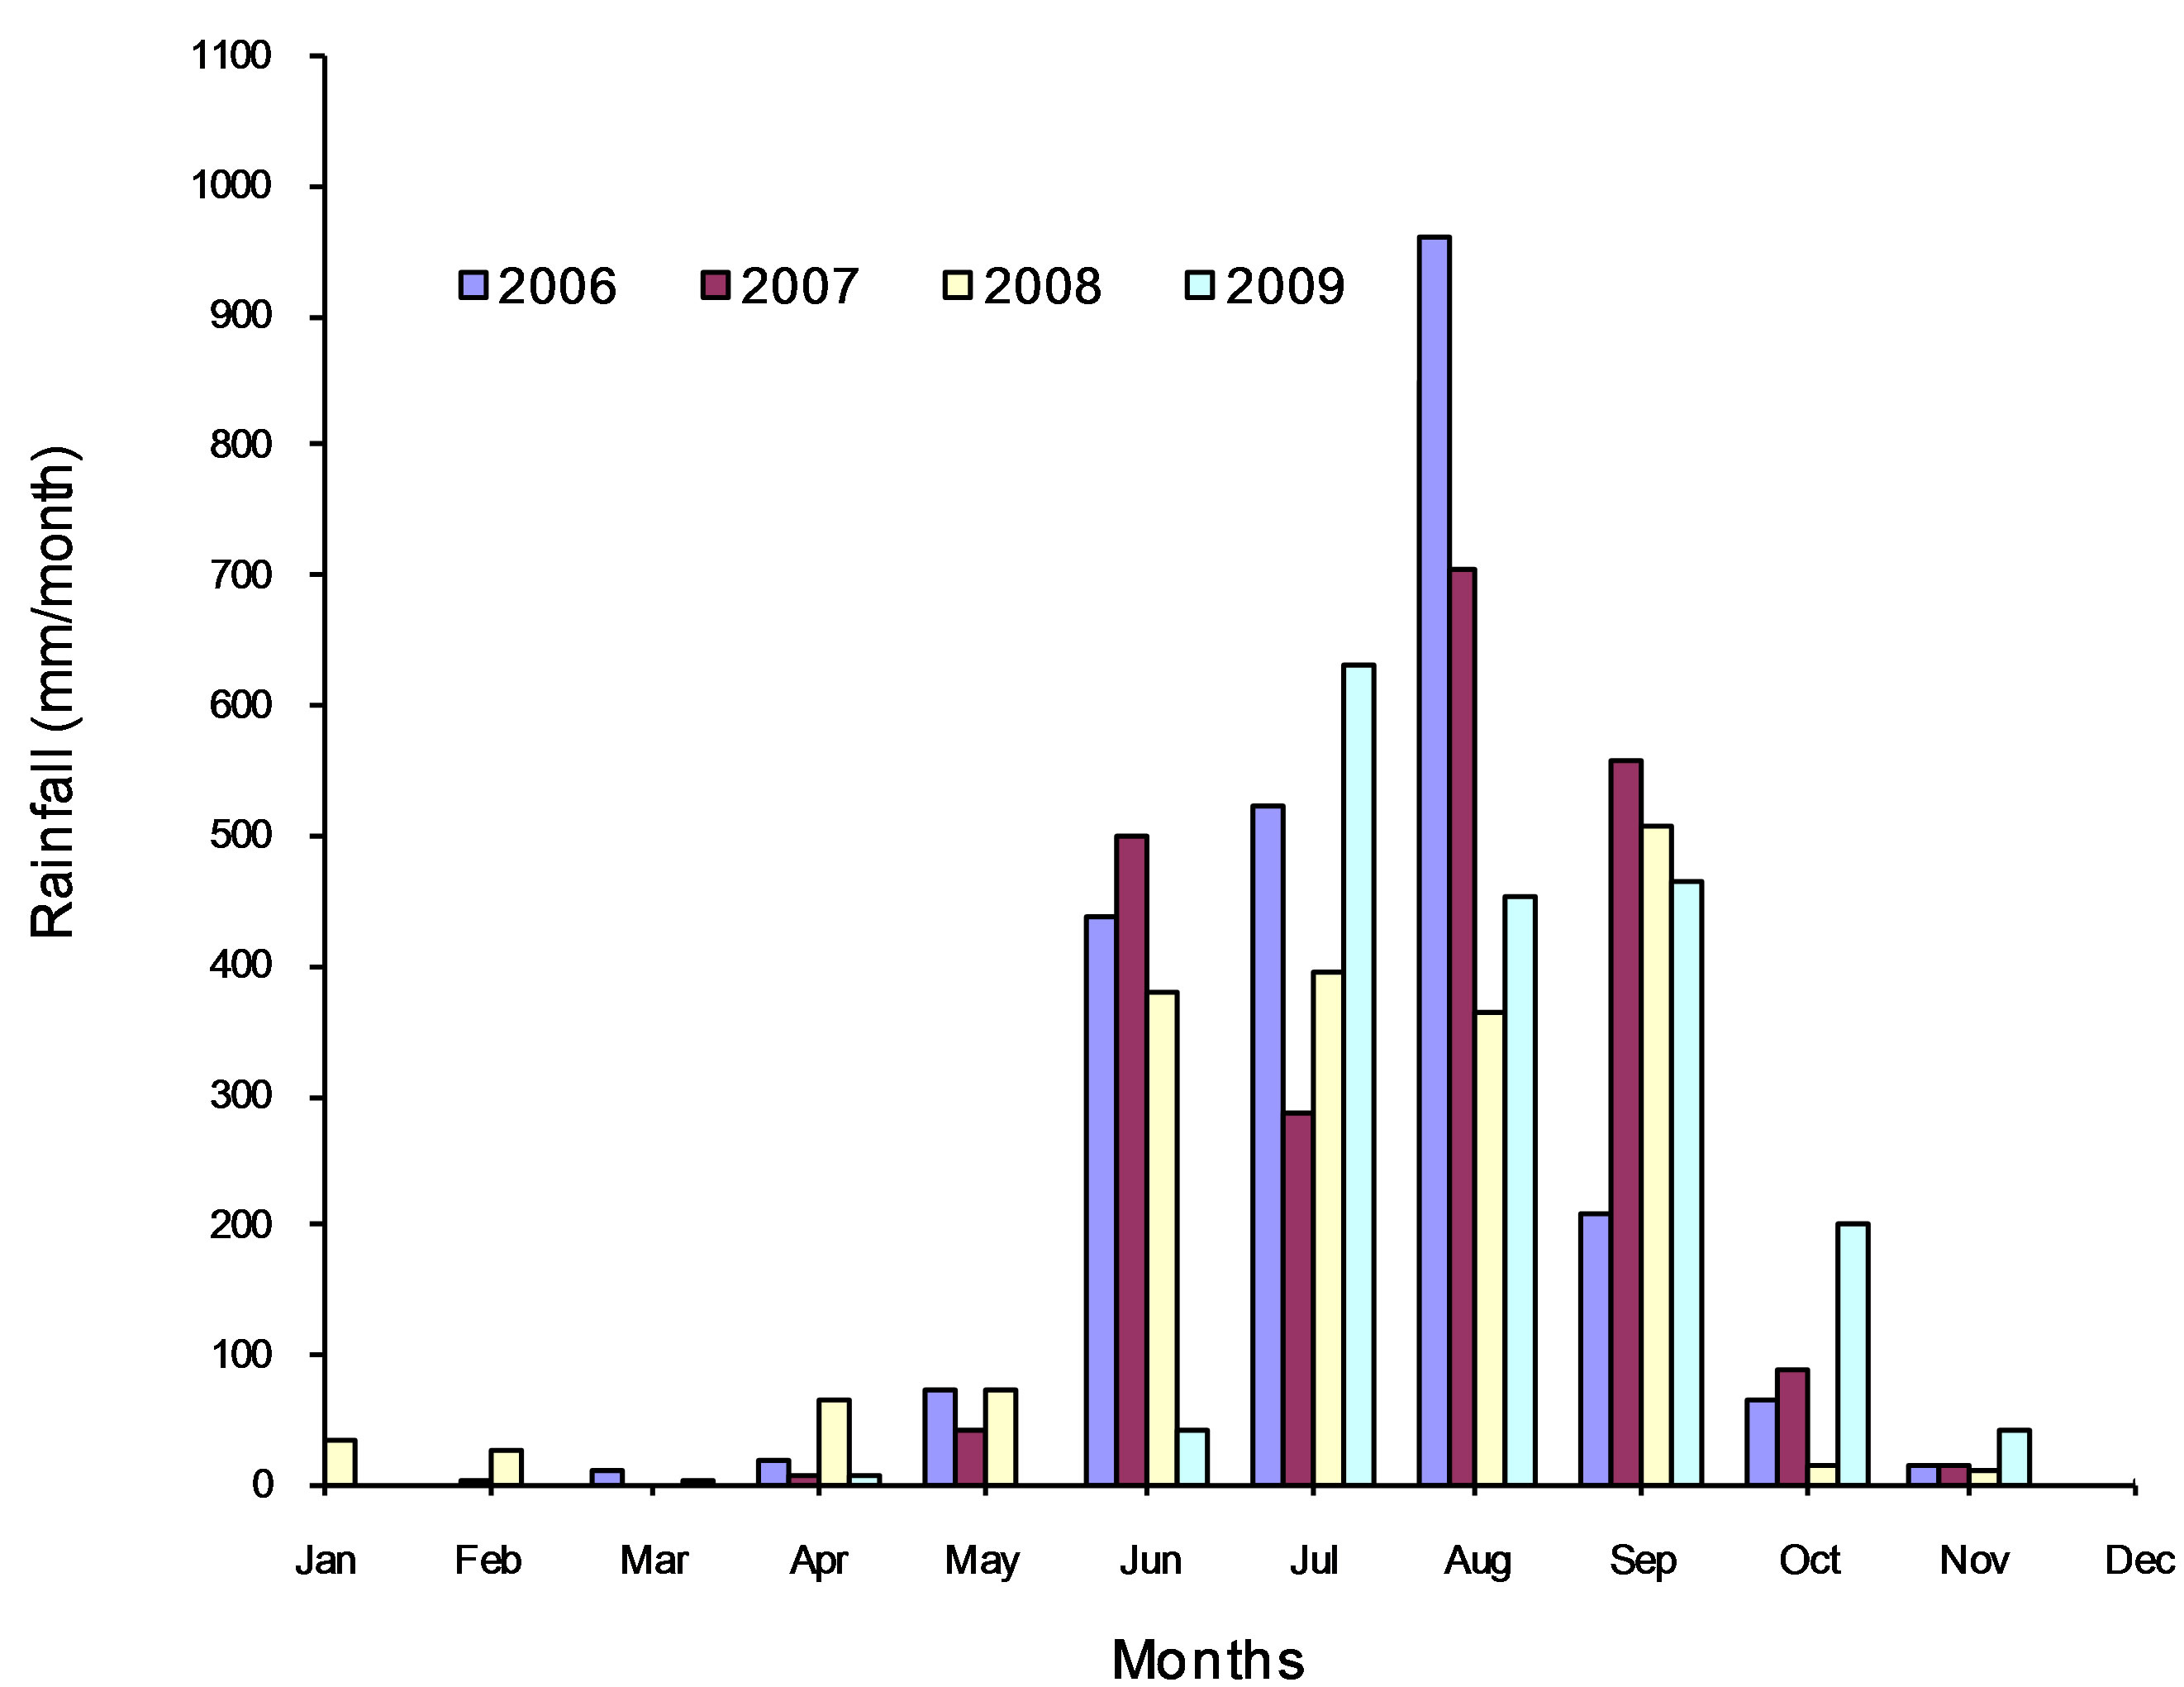
Figure 4. Monthly rainfall on ponds in different years.
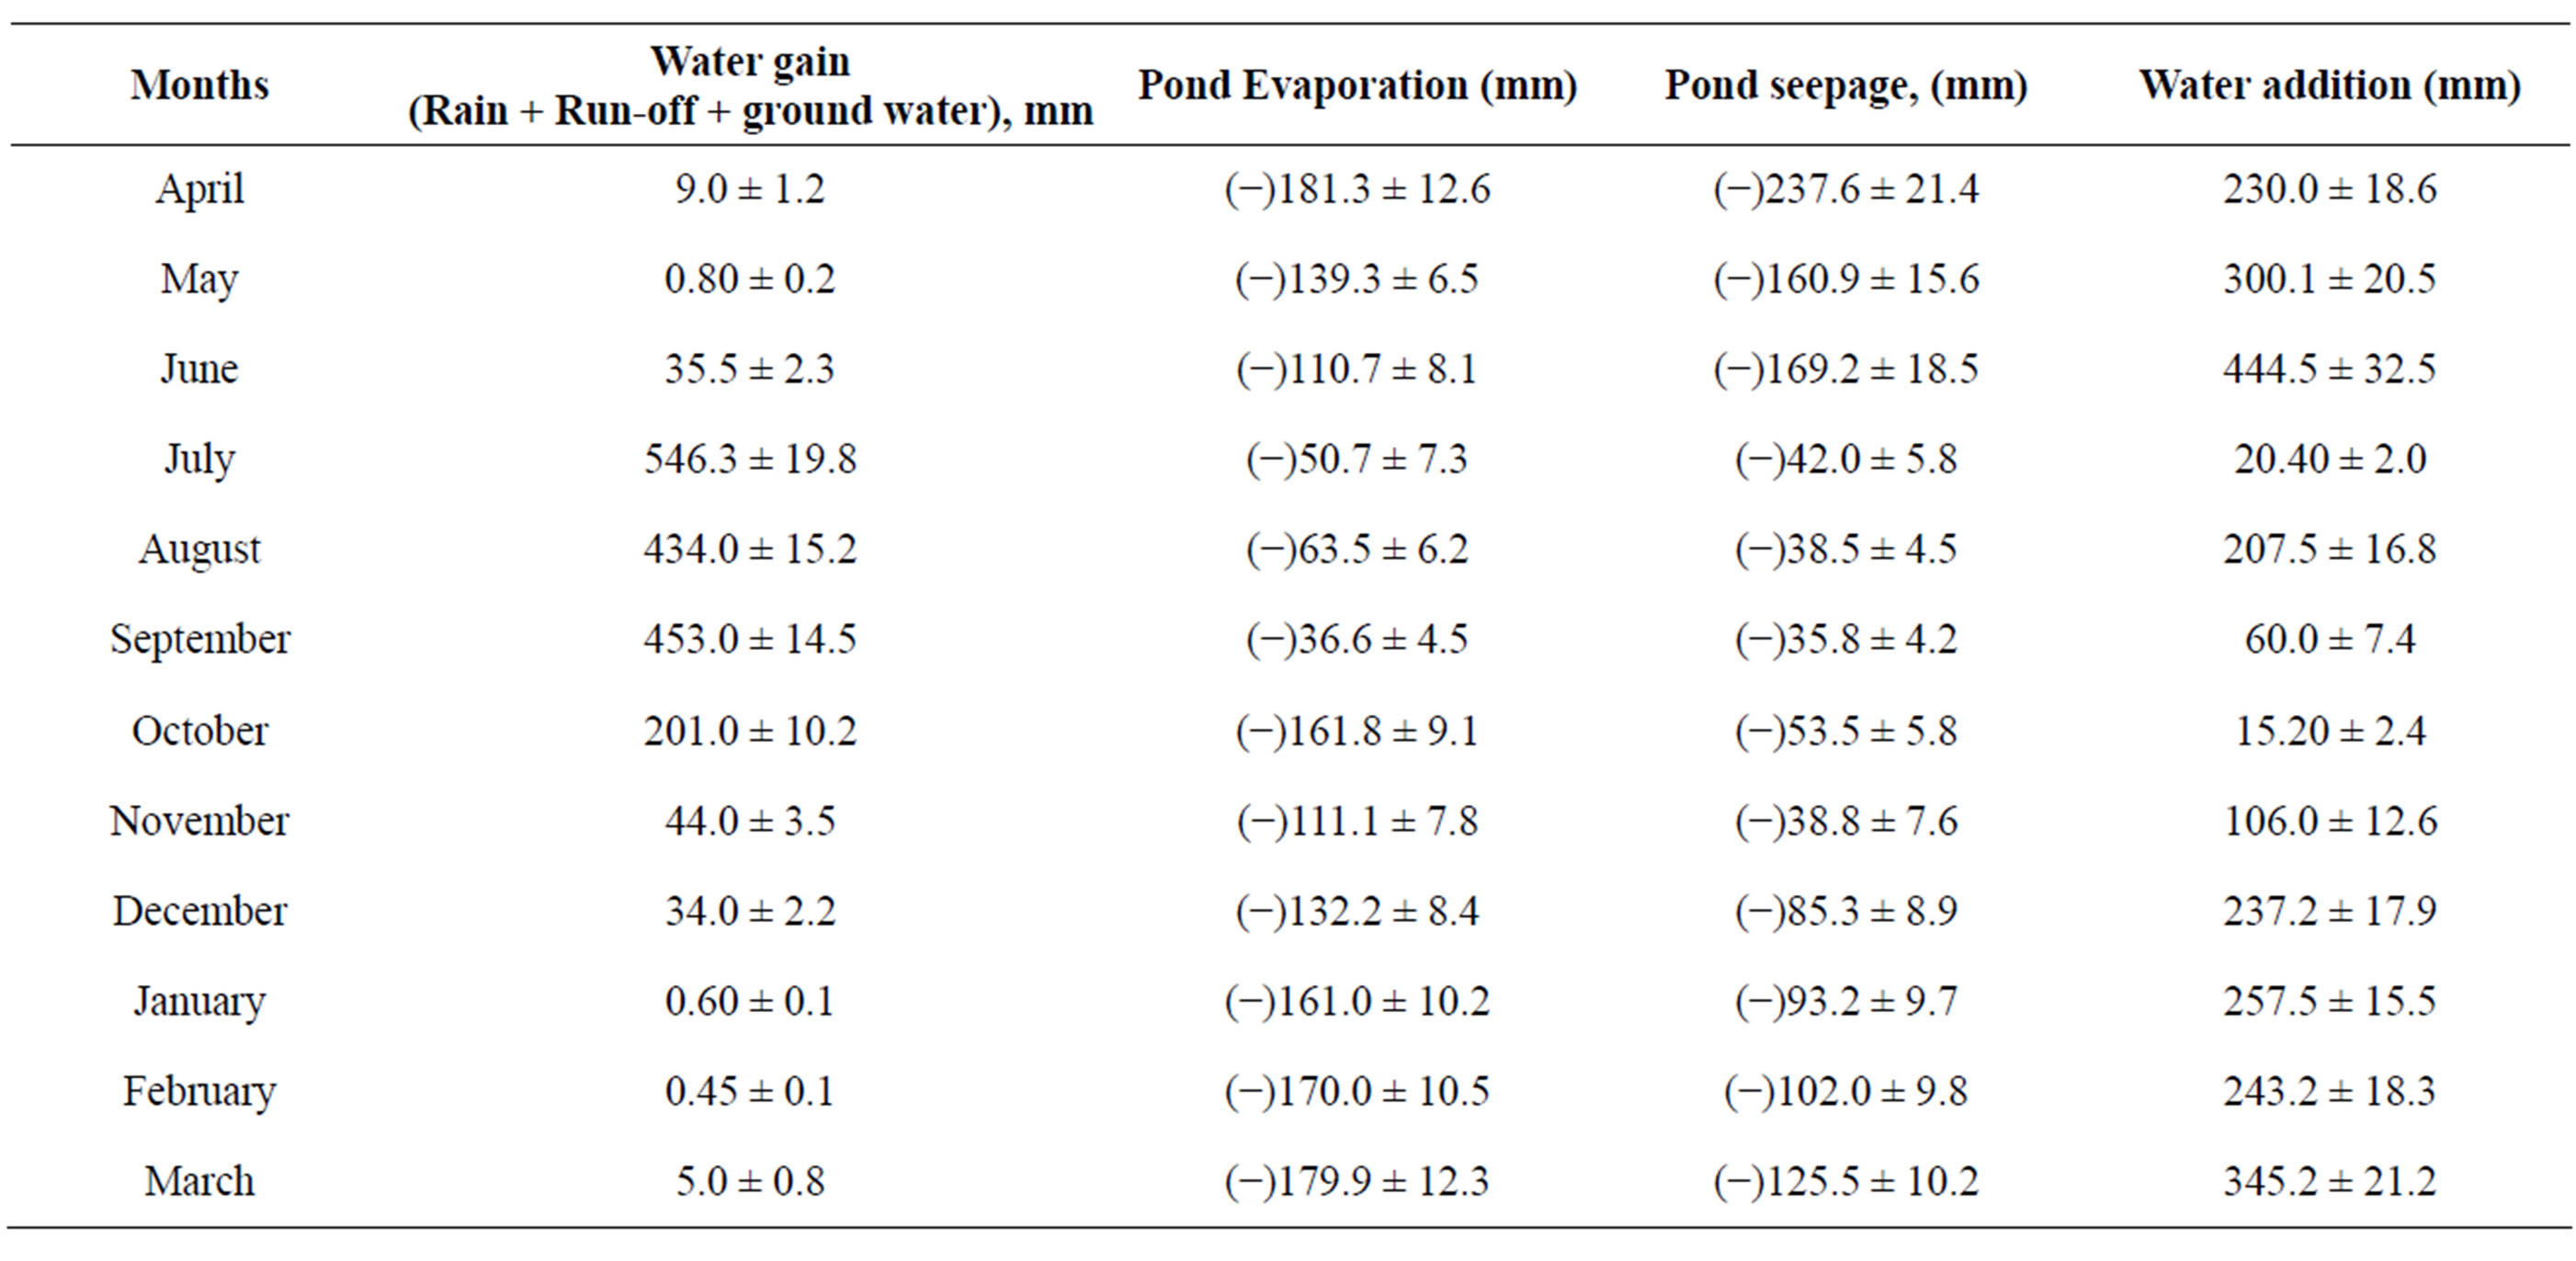
Table 1. Mean monthly water budgets of fishponds at CIFA farm.
The detail of contribution of different components in term of percentage is given below:
Water gain: 35.55% (Rainfall + Run off and Ground inflow)
(Rainfall: 75%; Run off 2% - 3%; Ground inflow 22% - 23%)
Regulated inflow: 64.45% Evaporation: 51.25% and Seepage loss: 48.75%.
3.6. System Associated Water Use in Freshwater Aquaculture
The system associated water use in freshwater aquaculture includes evaporation loss, seepage loss and water exchange for water quality management. In the present study it was assumed that there is no need for water exchange, as the water quality of fishpond did not deteriorate because of extensive aquaculture practices. The on an average the evaporation loss from the pond is 1498.3 mm/year and seepage loss per year is about 1182.60 mm/ year. Consequently, the water requirements for the production of Indian Major carps are presented in Table 2. The water requirement for a production target of 3 - 4 ton/ha/year comes to 7650 litre or 7.6 m3 of water per Kg of fish production and water requirement decreases with the intensification of aquaculture or increase of production (Table 2). If seepage losses are considered to be green water [12] then total water consumption is about 4.1 m3 per Kg of fish production. About 850,000 ha pond area is under carp cultivation in India [13] and hence water requirement is very high for freshwater aquaculture sector.
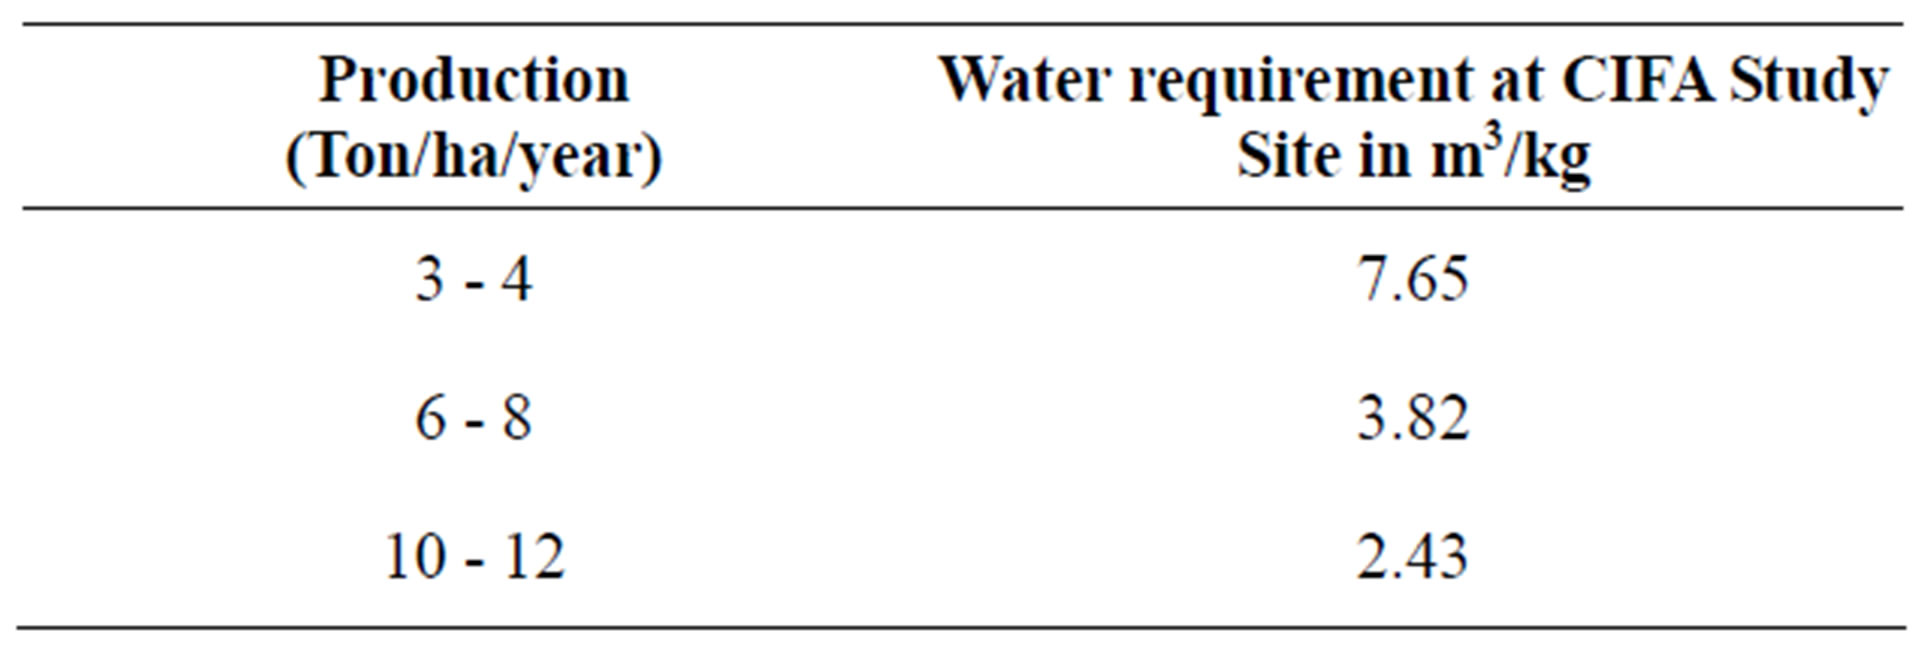
Table 2. Water requirements of Indian Major Carps for production of one Kilogram fish under different production technologies.
3.7. Feed Associated Water Use in Aquaculture
The water use associated with the production of bone or blood meal, fishmeal and fish oil can be considered negligible. Animals fed formulated diets indirectly consume large quantities of water. Globally, about 1.2 m3 of water is needed to produce 1 kg of grain used in animal feeds. Fish or crustaceans require less than 2 kg of grain concentrate for each kg produced, making them the most efficiently producing animals in terms of feed-associated water use. This means 2.4 m3 of water is also being consumed to produce 1 Kg of fish if the feed is being used above that of 4.1 m3 system associated water requirement. Hence, total water used to produce 1 Kg fish is 6.5 m3 if the seepage losses are considered as green water. Otherwise the total water used would be about 10.3 m3 per Kg of fish produced in the present study.
3.8. Freshwater Resources Availability and Utilization in India
The average annual precipitation of the country is about 400 Mham. However the utilizable surface water resources and ground water resources are about 70 Mham and 35 Mham respectively. Additionally 2.36 Mha area of ponds and tanks are also available to be used for various purposes such as domestic use, irrigation, aquaculture etc. The future requirements of water resources have been predicted to meet the growing demand by different sector [14].
About 70% of total water requirement would be going for agriculture through irrigation in 2025. The total utilizable resources are about 105 Mmam and 2.36 Mha area of ponds and tanks after full development of ground water as well as surface water resources for utilization but about 77 Mham would be supplied to irrigate agriculture only to feed the growing population. In conesquence, the future growth of agriculture including freshwater aquaculture would be constrained by the freshwater availability. For development of freshwater aquaculture other water resources like Canal, reservoirs and Oxbow lakes & derelict waters should be fully exploited.
3.9. Comparison of Water Requirement of Freshwater Aquaculture with Crops
The water productivity for freshwater aquaculture, which has been estimated in the present study, was compared with the other crops water productivity Table 3 [15]. It is clear from the table that the freshwater aquaculture needs more water to produce same amount of fish than the grains. Among the crops compared rice is the least water productive with water productivity 3.7 Kg/ha mm and Freshwater aquaculture is even lesser water rice also having 1.50 Kg/ha/mm water productivity.
3.10. Options to Reduce the Use of Water in Freshwater Aquaculture
The water use (7.6 m3) per Kg of fish production was very high in case of semi-intensive pond culture where production of fish was 3 - 4 ton/ha/year. If the intensive pond culture with supplementary feeding and aeration, the production of 10 - 15 tonnes/ha/yr could be achieved, the water productivity would be almost doubled. The focus should be on using intensive and super intensive culture practices for aquaculture production. The main water consumption in pond aquaculture is in the form of evaporation and seepage losses. Hence our efforts should be such that these losses are minimized during the process. The seepage loss may be controlled by adopting different control measures in pond aquaculture [16]. In intensive or super intensive culture systems, focus should be on assuring the treatment of effluent water and reuse so that these should no longer be considered as a loss. RAS have got very good potential for increasing water productivity very high; they should be tried wherever possible.
On farm water management should also be practiced to reduce the water wastage and make available more water for aquaculture. Water storage capacity of ponds with extensive areas of shallow water can be improved if they are drained and deepened. The shallowest area in a pond should be at least three feet deep. This depth of water will slow growth of aquatic plants, which can take up a large amount of pond volume, effectively reducing the water storage capacity of the pond. To conserve water and reduce energy costs of pumping water in the pond, maintain water levels below the maximum allowed to the standpipe. This practice allows rainfall to be collected in the ponds. How much below maximum level the pond is filled depends upon season, weather patterns, evaporation rates, location, and water holding capacity of the pond, size of the fish in the pond and weight of fish.
4. CONCLUSION
This study presents the water budgets for freshwater aquaculture ponds for semi-intensive carp culture and also discusses means and ways to reduce the water use in freshwater aquaculture. The total freshwater requirement has been estimated to be 10.3 m3/Kg production under present study for semi-intensive culture and with supplemental feeding, out of which 7.6 m3/Kg is system associated requirement. The system-associated requirements are mainly evaporation and seepage losses from the pond during fish culture period. On an average the
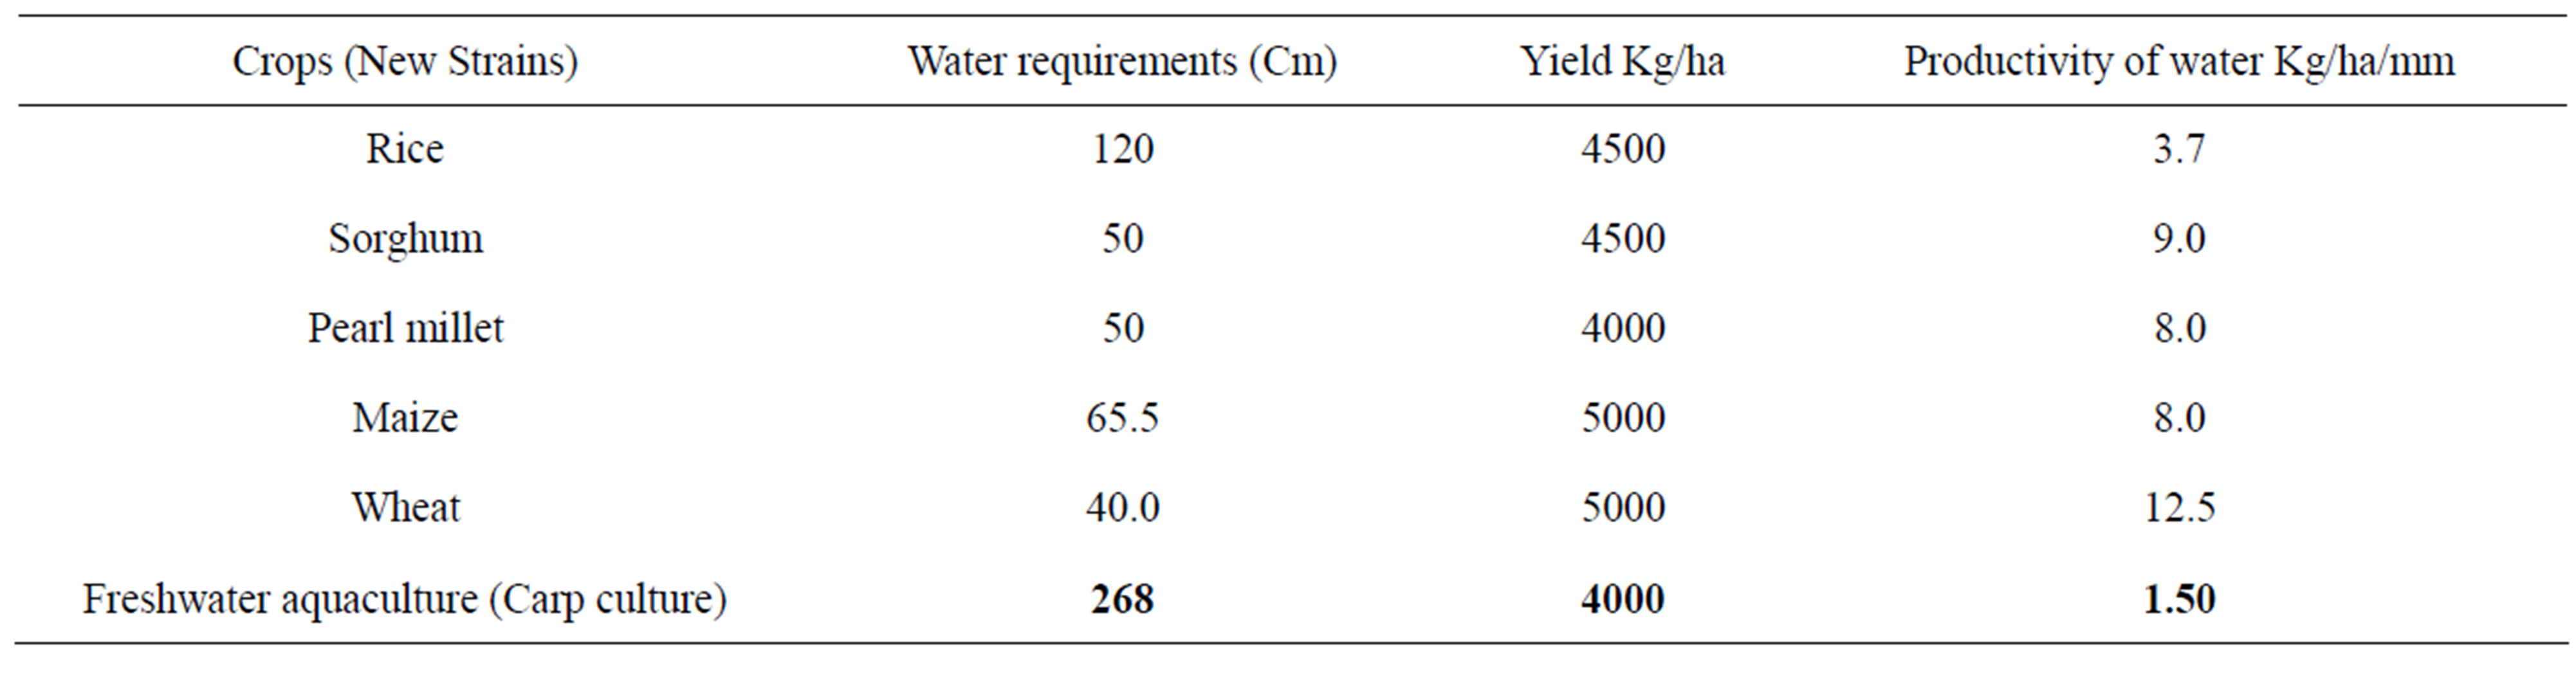
Table 3. Water productivity for different crops including freshwater aquaculture.
evaporation loss from the pond is 1498.3 mm/year and seepage loss per year is about 1182.60 mm/year. Water conservation and reuse have become a major issue in aquaculture in recent years. Concern over increased demand on ground water, cost of operating wells, environmental impact of aquaculture effluent and the desire to increase production efficiency continues to drive advances in technology and management practices. Seepage and water exchange losses recharge the ground water aquifers and if they are treated and recycled, the water use in aquaculture can be reduced significantly. A further reduction in freshwater use in pond aquaculture is possible through development of intensive and super-intensive culture systems and aqua feeds.
5. ACKNOWLEDGEMENTS
The authors are thankful to Dr. A. E. Eknath, Director, Central Instiute of Freshwater Aquaculture for providing facilities to carry out this work and also for his constant guidance and encouragement.
REFERENCES
- FAO (2005) Aquaculture production, 2003. Yearbook of Fishery Statistics, Vol.96/2, Food and Agriculture Organization of the United Nations, Rome.
- Tripathi, S.D. (2003) Inland Fisheries in India. Fish for All National Launch, 18-19 December.
- Boyd, C.E. (1982) Hydrology of small experimental fishponds at auburn, Alabama. Transactions of the American Fisheries Society, 111, 638-44. doi:10.1577/1548-8659(1982)111<638:HOSEFP>2.0.CO;2
- Boyd, C.E. (1986) Influence of evaporation excess on water requirements for fish farming. Proceeding of the Conference on Climatic and Water Management, American Meteorological Society, Boston, 62-64.
- Teichert-Coddington, D.R., Stone, N. and Phelps, R.P., (1988) Hydrology of fish culture ponds in Gualaca, Panama. Aquacultural Engineering, 7, 309-320. doi:10.1016/0144-8609(88)90013-1
- Green, B.W. and Boyd, C.E. (1995) Water budgets for fish ponds in the dry tropics. Aquacultural Engineering, 14, 347-356. doi:10.1016/0144-8609(95)00002-V
- Nath, S.S. and Bolte, J.P. (1998) A water budget model for pond aquaculture. Aquacultural Engineering, 18, 175-188. doi:10.1016/S0144-8609(98)00029-6
- Mohanty, B.B., Mal, B.C., Sharmaand, K.K. and Mohapatra, B.C. (2009) Water requirements of a portable FRP carp hatchery for Rohu spawning and eggs hatching. Fishing Chimes, 29.
- Kathpalia, G. (1991) Water budgeting and planning. Water pollution and management, edited by C. K. Varshney, 25-35.
- Verdegem, M.C.J., Bosma, R.H. and Berreth, J.A.J. (2006) Reducing water use for animal production through aquaculture. International Journal of Water Resource Development, 22.
- United States Soil Conservation Service (1971) Ponds for water supply and recreation. United States Department of Agriculture, Agriculture Handbook 387.
- Verdegem, M.C.J. and Bosma, R.H. (2009) Water withdrawal for brackish and inland aquaculture, and options to produce more fish in ponds with present water use. Water Policy, 11, 52-68.
- Ayyappan, S. (2006) National aquaculture sector overview: India. National Aquaculture Sector Overview Fact Sheets, FAO, Rome.
- Irrigation Commission, Ministry Of Irrigation and Power, Government of India (1972) Report of the Irrigation Commission.
- Michael, A.M. (1997) Irrigation: Theory and practices. Vikas Publishing House Pvt Ltd, Delhi.
- Jayanthi, M., Rekha, P.N., Muralidhar, M. and Gupta, B.P. (2004) Seepage reduction in brackish water ponds with different materials. Ecology, Environment and Conservation, 10, 257-260.