Agricultural Sciences
Vol.3 No.7(2012), Article ID:24393,7 pages DOI:10.4236/as.2012.37107
Intercropping barley with pea for agronomic and economic considerations in northern Ontario
![]()
1Thunder Bay Agriculture Research Station, Thunder Bay, Canada
2Agriculture and Agri-Food Canada, Melfort, Canada; *Corresponding Author: Hsukhdev.malhi@agr.gc.caH
Received 28 June 2012; revised 16 August 2012; accepted 5 September 2012
Keywords: Barley; Economic Returns; Intercrop; N Fertilizer; N Uptake; Pea; Protein; Grain Yield
ABSTRACT
Intercropping, a mix of non-legume and legume crops, can improve crop yield and/or economic returns and reduce input costs. Field experiments (barley-pea intercrop) were conducted in 2008, 2010 and 2011 on an Oskondoga silt loam soil at Thunder Bay, Ontario, Canada, to determine the effect of intercropping barley (nonlegume) and pea (legume) on grain yield, land equivalency ratio (LER), grain quality (protein concentration-PC), N uptake and economic returns. Barley and pea were grown as mono crops and in combinations as intercrops (both in the same row/and alternate rows). Nitrogen fertilizer was applied at 0, 40 and 80 kg·N·ha−1 to mono crop barley and at 0, 20 and 40 kg·N·ha−1 to barley-pea intercrop combinations. On an average of three years, application of 80 kg·N·ha−1 increased grain yield of barley by 846 kg·ha−1 as a sole crop and by 420 - 488 kg·ha−1 in the two intercropping combinations. Compared to barley and pea as sole crops, grain yield with barleypea intercropping was greater by 266 kg·ha−1 with alternate row combination and by 223 kg·ha−1 when both crops were grown in the same row. The LER values suggested 7% - 17% less land requirement for barley-pea intercropping than sole crops. Net returns from barley-pea intercropping without applied N greatly improved ($854 - $939 ha−1) compared to barley sole crop with 80 kg·N·ha−1 ($628 ha−1), although the net returns were highest for pea grown as a sole crop without applied N ($1141 ha−1). For barley as a sole crop, PC in grain increased with applied N. Compared to barley as sole crop with zero-N, PC in barley grain increased when barley was intercropped with pea. In barley-pea intercrop treatments, application of N fertilizer had no significant effect on PC in barley grain, although PC in pea grain was much higher than PC in barley grain. The response trends of total N uptake in grain were similar to grain yield. The findings suggest that pea or barley-pea intercropping could be an option for organic farming systems.
1. INTRODUCTION
Intercropping generally refers to growing a mix of non-legume and legume crops. Intercropping could have several benefits, such as yield stability and reduced risk of crop failure due to crop diversity [1,2], lower input costs due to less fertilizer and pesticide usage, improve grain yield (also called out-yielding) and economic returns in cereal-legume [3-7] and grain quality [8]. Outyielding (i.e., when the yield produced by an intercrop is greater than the yield produced by the component crops grown in monoculture on the same total land area) could be calculated by measuring production efficiency of intercrops relative to sole crops by using various techniques, such as Area × Time Equivalency Ratio (ATER) [9], Relative Yield Total (RYT) [10] and Land Equivalency Ratio (LER) [11]. The LER is most commonly used, and is defined as the relative land area under sole crops that is required to produce yields equivalent to total yield from component intercrops. Out-yielding in intercropping systems occurred due to weed suppression, reduced susceptibility to insect-pests and diseases [12- 15], efficient use of resources (e.g., nutrients, water, light) by diverse plant population compared to crop plants of the same type and other benefits, such as nitrogen (N) fixation by legumes, and increased root length [5,16,17]. There is little research information on the impact of intercropping annual non-legume and legume crops on yield, produce quality, economic returns, nutrients and water use efficiency, and disease severity in Canada, and such information is not available in northern Ontario. The objective of this study was to investigate the effects of intercropping annual non-legume barley and legume pea crops on grain yield, land equivalency ratio (LER), grain quality, N uptake and economic returns in northern Ontario, Canada.
2. MATERIALS AND METHODS
Field experiments (with barley-pea intercrop) were conducted at Thunder Bay, Ontario, Canada, in 2008, 2010 and 2011. Each treatment was replicated four times in a randomized complete block design. Individual plots were 1.8 m × 7.5 m. The amount of precipitation from May to August was 356.1, 218.5 and 291.7 mm, in 2008, 2010 and 2011, respectively. The precipitation for the 30- year mean at the nearest meteorological station (Thunder Bay Airport) was 327.2 mm. The year 2010 was relatively dry; the months of July and August in 2008 and 2010 and August of 2011 had less than normal rainfall (relatively dry). About 80 mm of precipitation occurred on a single day in June 2008. Thus, the precipitation in the growing seasons was not well distributed in any of the years.
Barley and pea were grown as mono crops and in combinations, with application of N as urea at 0, 40 and 80 kg·N·ha−1 to mono crop barley and at 0, 20 and 40 kg·N·ha−1 to barley-pea intercrop combinations. The ten treatments were: 1) barley, 0 kg·N·ha−1; 2) barley, 40 kg·N·ha−1; 3) barley, 80 kg·N·ha−1; 4) pea, 0 kg·N·ha−1; 5) barley-pea in alternate rows, 0 kg·N·ha−1; 6) barleypea in alternate rows, 20 kg·N·ha−1 to only barley; 7) barley-pea in alternate rows, 40 kg·N·ha−1 to only barley; 8) barley-pea in same row, 0 kg·N·ha−1; 9) barley-pea in same row, 20 kg·N·ha−1; and 10) barley-pea in same row, 40 kg·N·ha−1. All plots received recommended applications of P, K and S fertilizers and herbicides to control annual weeds. At maturity, the crop was harvested with a Suzie binder and threshed for grain yield. Grain samples were analysed for total N concentration [18] to calculate protein concentration and N uptake.
Land Equivalency Ratio was calculated from ratios of seed yields of intercrops and sole crops by using formula [LER = (Intercrop1/Sole Crop1) + Intercrop2/Sole Crop2)] as described by Szumigalski and Van Acker [11]. The LER values are used to compare crop growth/yield in intercrops relative to the respective sole crops. If the LER value is greater than 1, it indicates that out-yielding is occurring with intercropping, and the intercrop is more productive than the component crops grown as sole crops (i.e., less land requirement with intercropping as compared to the sole crops). If the LER is lower than 1, it suggests that there is no out-yielding occurring with intercropping (in fact under-yielding with intercropping), and the intercrop is less productive than the sole crops.
The calculated data for each parameter were subjected to analysis of variance (ANOVA) using procedures as outlined in SAS [19]. Significant (P ≤ 0.05) differences between treatments were determined using least significant difference (LSD0.05). For each parameter, LSD, standard error of the mean (SEM) and significance are presented in various tables.
3. RESULTS
Grain yield of barley as a sole crop increased considerably with application of N (Table 1). Grain yield of barley in barley-pea intercropping also increased significantly for both intercrop combinations (alternate rows and in the same row). However, seed yield of pea in both intercrop combinations decreased with increasing N fertilizer application (at rates higher than 20 kg·N·ha−1), more so when the crops were seeded in the same row, but still the intercrop combinations produced higher total grain yield of both crops. The LER values for barley-pea intercrop combinations were slightly greater than 1 in alternate rows, at all levels of N, and at lower N rates in the same row, but were only slightly less than 1 at the highest rate of N applied to barley or pea in the same row.
The LER values in the barley-pea intercrop in both same row and alternative rows combinations were higher when sole crop of barley was grown at zero-N rate compared to application of N fertilizer; LER was the least at 80 kg·N·ha−1 (Table 2). This indicates highest crop yield and lowest land requirement for barley-pea intercropping, when barley was grown without any applied N fertilizer. In most cases when barley received 80 kg·N·ha−1, LER values were less than 1 indicating decrease in grain yield and increase in land requirement for barley sole crop at increasing rates of applied N. For barley as sole crop, the LER values increased with increasing N rate, especially up to 40 kg·N·ha−1, in most cases in both barley-pea intercrop combinations. The LER values peaked when the barley-pea intercrop combinations received N fertilizer at 40 kg·N·ha−1. This suggests the increase in grain yield and decrease in land requirement for barley-pea intercropping with increasing rate of applied N.
Net returns (total of barley and/or pea as sole crops) increased with application of N, but decreased for the barley-pea intercrop grown in alternate rows and more so in the same row (Table 3). Without applied N, net returns were 1) highest when barley-pea intercrops were grown in the same row, followed closely by both crops in the alternate rows, and 2) usually the least when both crops were grown as sole crops. Net returns of barley as sole crop increased with application of N, but the net returns decreased for the barley-pea intercrop grown in the same row. Net returns from sole pea crop, without N fertilizer, were the highest ($1141 ha−1); medium with barley-pea
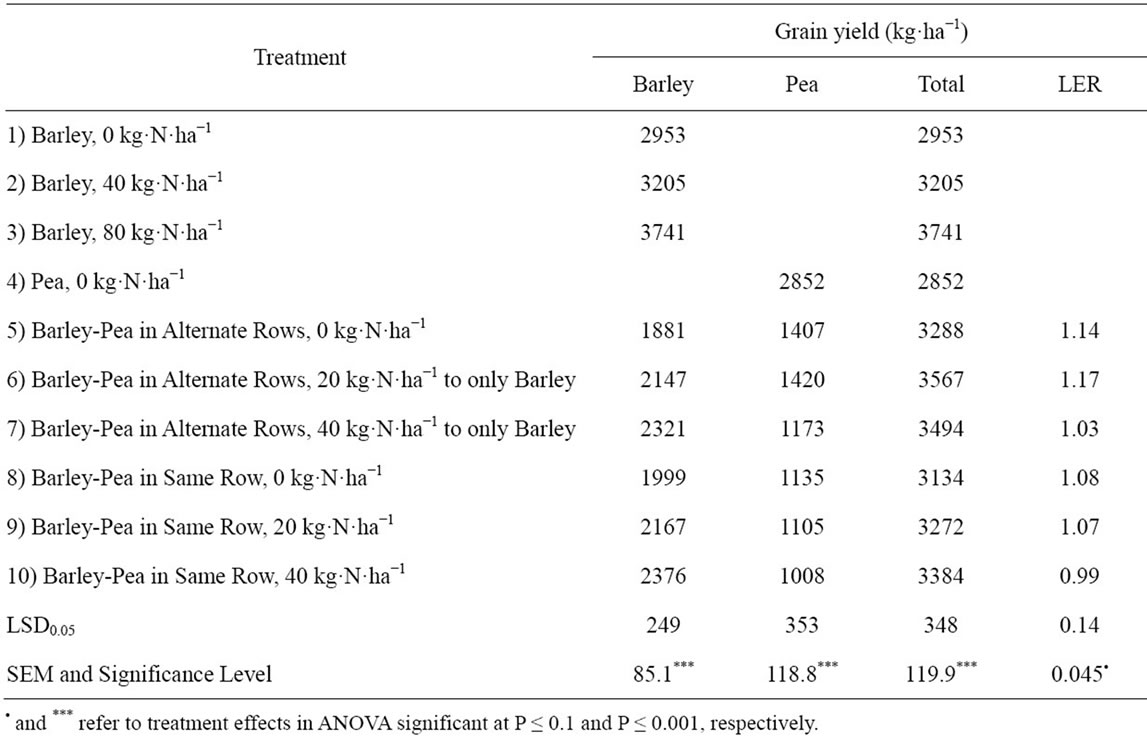
Table 1. Grain yield of barley and pea and Land Equivalency Ratio (LER) for barley and pea grown as sole crops compared to various barley-pea intercrop combinations for similar N rates at Thunder Bay, Ontario (average of three years).
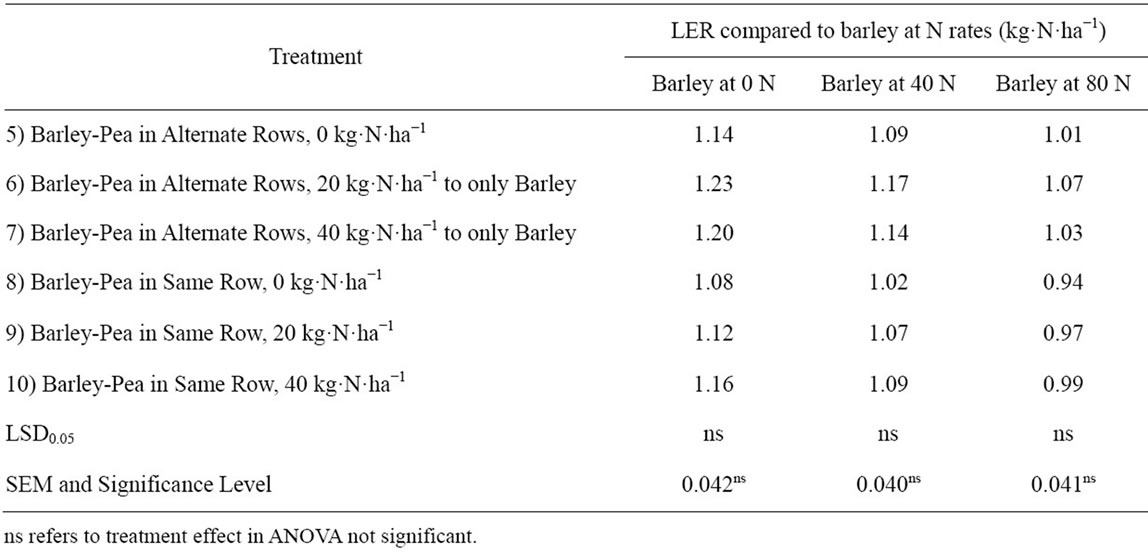
Table 2. Land Equivalency Ratio (LER) for barley grain yield with or without applied N and pea without applied N grown as sole crops compared to various barley-pea intercrop combinations with or without applied N at Thunder Bay, Ontario (average of three years).
intercrops sown in the same row and the least with barley as sole crop with or without applied N. Overall, net returns from barley + pea intercropping without applied N ($854 - 939 ha−1) were much better as compared to barley sole crop with 80 kg·N·ha−1 ($628 ha−1).
For barley as a sole crop, grain protein concentration (PC) increased with applied N (Table 4). Compared to barley as sole crop with zero-N, PC in barley grain increased when barley was intercropped with pea. In barley-pea intercrop treatments, application of N fertilizer had no significant effect on grain PC in barley, although PC in pea grain was expectedly much higher than PC in barley grains. Protein concentration in pea grain was highest when pea was grown as a sole crop without any applied N. Total grain N uptake by barley and pea as sole crops as well as in both intercrop combinations depicted trends similar to the grain yield (Table 5). The LER values for total N uptake in grain usually showed patterns
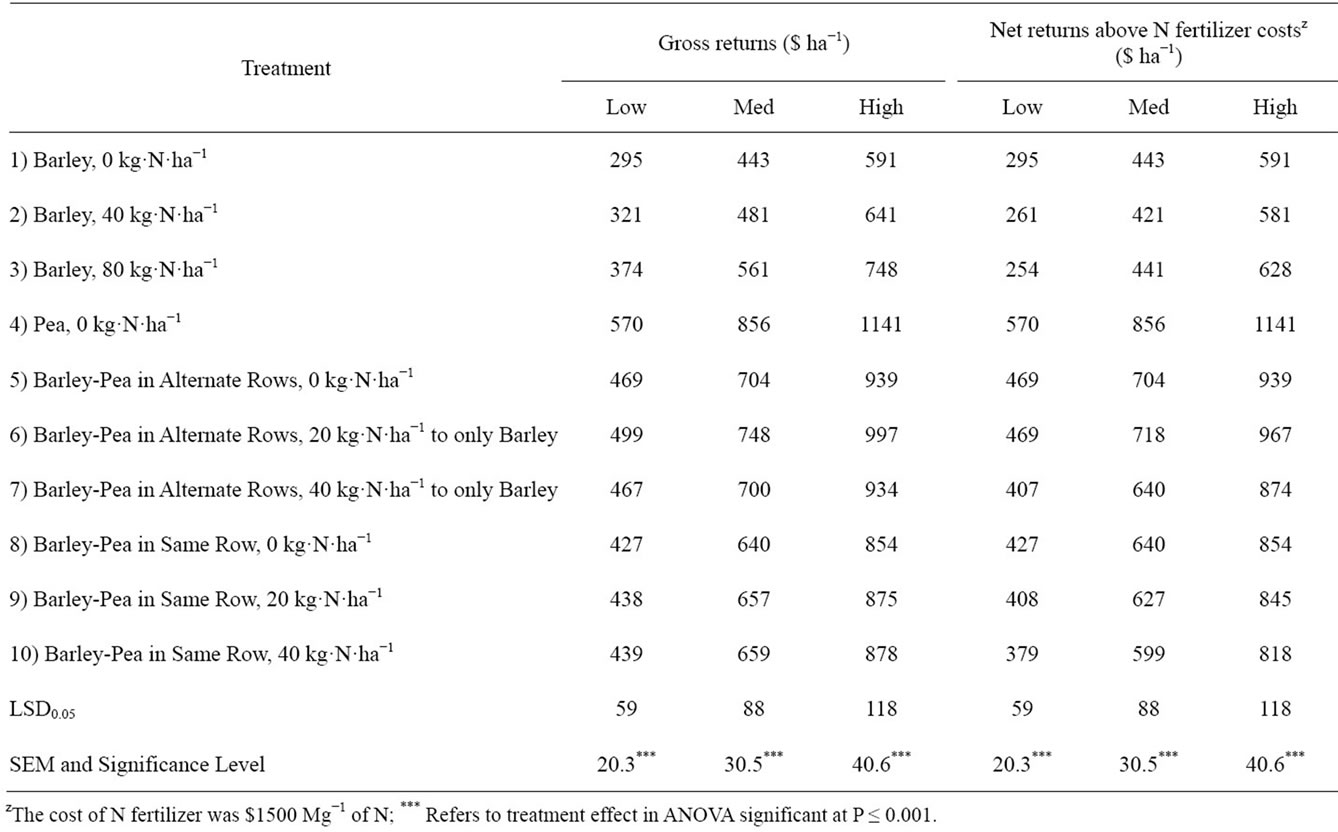
Table 3. Economic returns for barley and pea grown as sole crops, and in various combinations as intercrop in alternate rows and in same row at low ($100 Mg−1 for barley and $200 ha−1 for pea), medium ($150 Mg−1 for barley and $300 ha−1 for pea) and high ($200 Mg−1 for barley and $400 ha−1 for pea) prices at Thunder Bay, Ontario (average of three years).
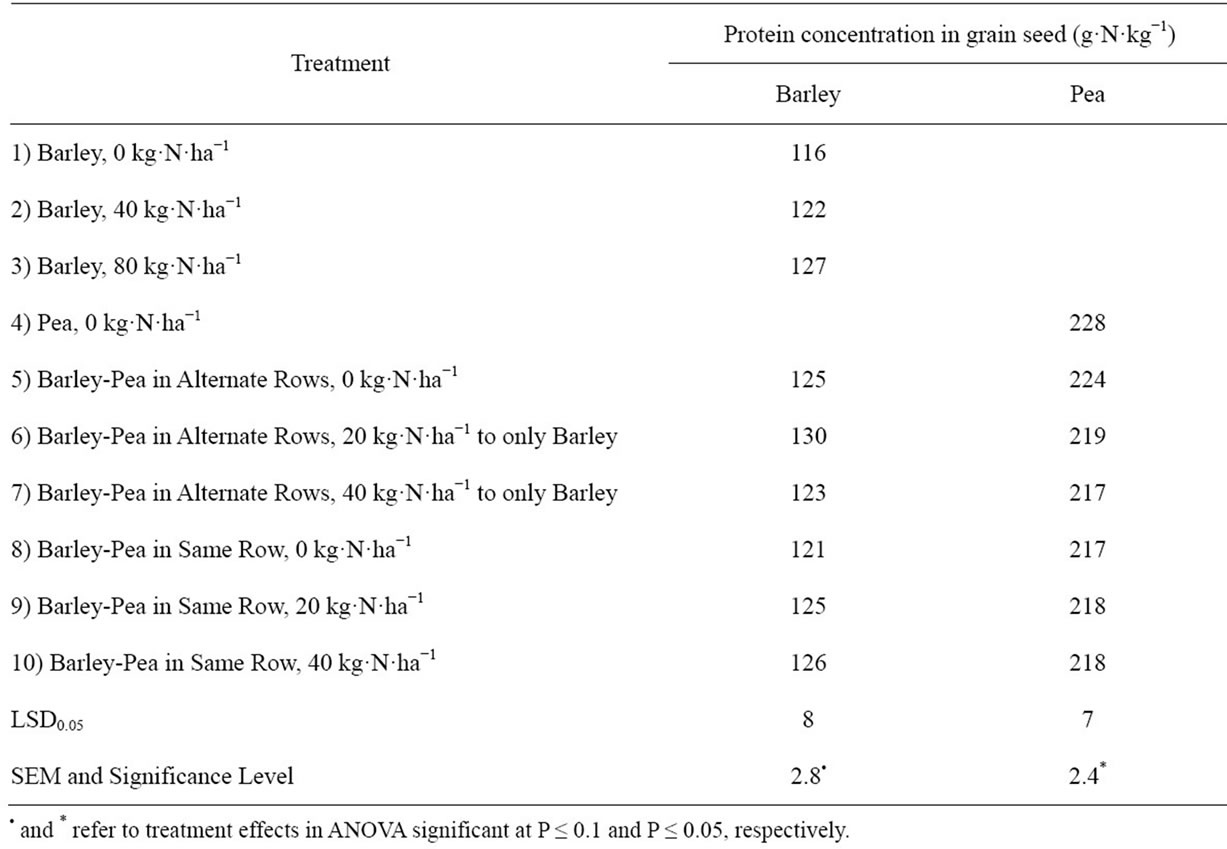
Table 4. Protein concentration in grains of barley and pea grown as sole crops compared to various barley-pea intercrop combinations for similar N rates at Thunder Bay, Ontario (average of three years).
similar to the LER for grain yield (Tables 5 and 6).
4. DISCUSSION
Previous research studies have shown beneficial effects of intercropping grain legumes with cereals on productivity, economic returns and produce quality [2-8]. Our study considered barley-pea intercrop mixtures as alternatives to barley or pea sole crops in northern Ontario. The effects of intercropping versus sole cropping in relation to crop production, land resource use efficiencyproduce quality and N uptake are discussed in the following paragraphs by providing possible explanations for any varying results from the published literature.
In our study, grain yield of barley-pea intercrop was usually greater than pea and barley grown as sole crops. The LER values greater than 1 indicate higher crop yield and lower land requirement with intercropping compared to when barley and pea were grown as sole crops, especially when grown without applied N. The increase in grain yield of barley and decrease in grain yield of pea
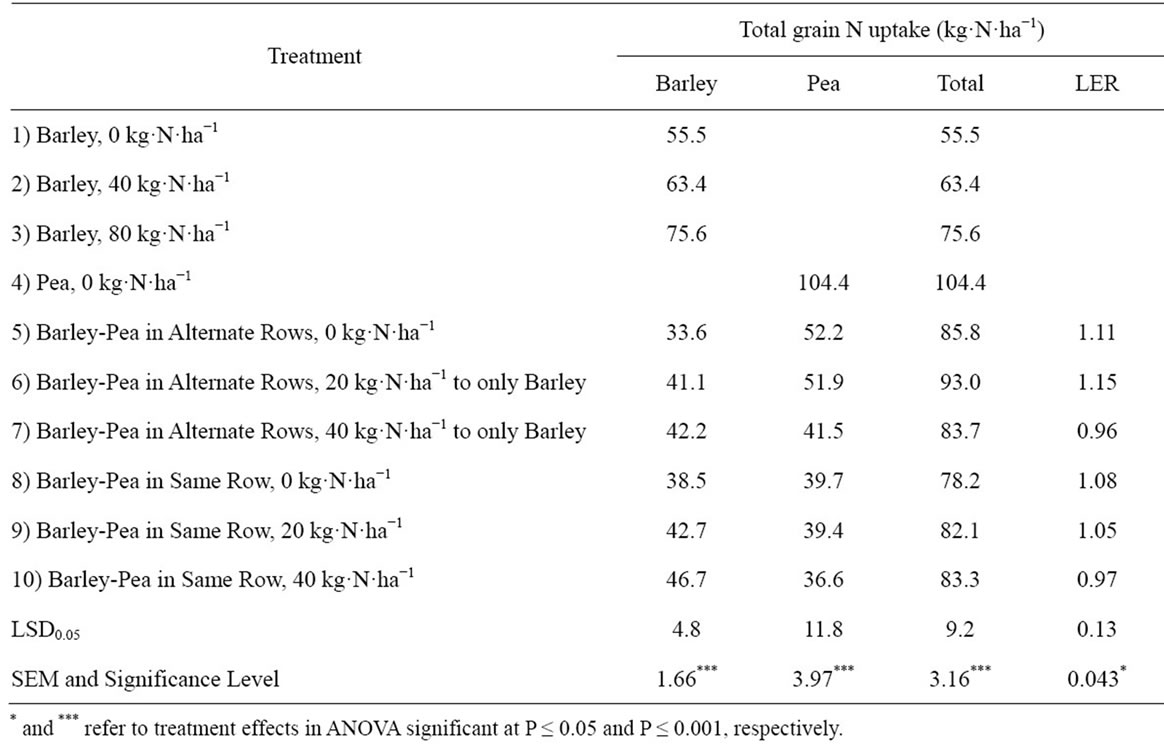
Table 5. Total grain N uptake of barley and pea grown as sole crops compared to various barley-pea intercrop combinations for similar N rates at Thunder Bay, Ontario (average of three years).
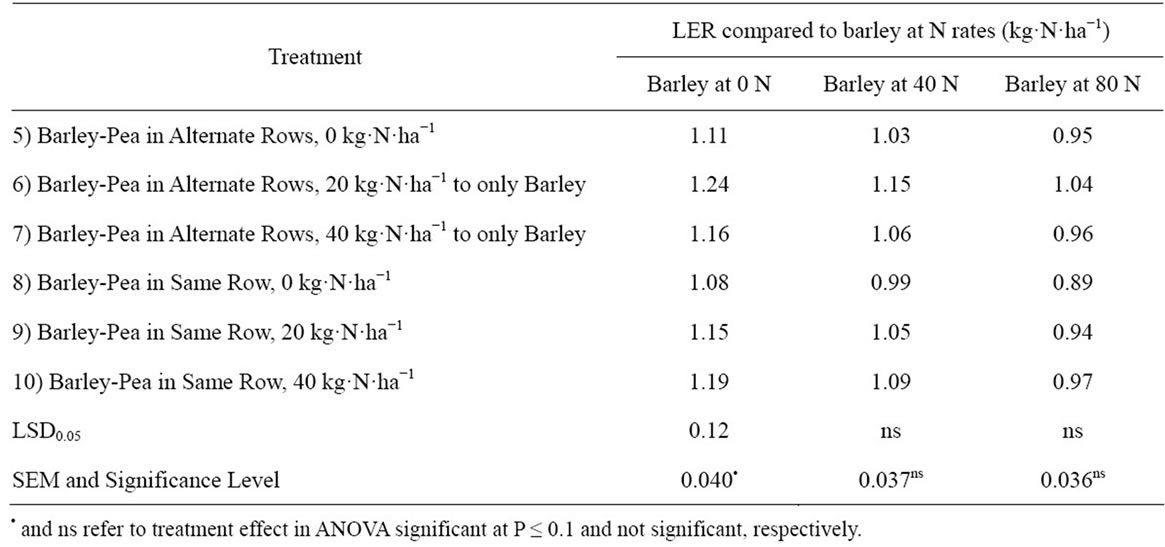
Table 6. Land Equivalency Ratio (LER) for barley grain N uptake with or without applied N and pea without applied N grown as sole crops compared to various barley-pea intercrop combinations with or without applied N at Thunder Bay, Ontario (average of three years).
with application of N fertilizer compared to zero-N treatment could most likely be due to higher level of nitrate-N in soil which has been observed to favour competition of non-legume barley over legume pea [20], and inhibit N2 fixation by pea [21].
Grain yields of the component crops in intercropping systems were lower than their corresponding sole crop grain yields, but the total land productivity was usually higher in intercrop treatments as evidenced by the higher LER values in these treatments. The LER values ranged from 1.03 to 1.17 for intercrops in alternate rows, and from 0.99 to 1.08 for intercrops in the same row. In other words, sole cultivation of each crop would require slightly more land than their cultivation in intercropping systems, suggesting greater land-use efficiency of intercrops (by up to 17% for alternate rows and by up to 8% for same row) than sole crops. Because of different rooting pattern, intercropping legumes with cereals has the potential to improve the use of soil N resource compared to legumes grown as sole crops [2]. Therefore, it is also possible that higher land productivity under intercropping than sole cropping in our study could be due to more efficient use of available soil N with intercrops as well. Also, in our study there was more N uptake with intercrop combinations than the sole crops. Similar results were reported previously in intercropping systems for mixed cultures of barley and pea [1,22].
Earlier research has suggested that interspecies competition could lead to increase in total N concentration in barley grain when it was grown as a mixture with pea, due to lack of severe competition for N between the two crops [23]. Similarly, in our study, the protein concentration (or total N) also increased in barley grain in barleypea intercrops, because more of soil N was available to barley grains, as pea could meet its N requirement through N fixation from the atmosphere.
Overall, our findings suggest that the inclusion of Nfixing legume grain crops can be introduced in the intercropping systems for preventing N deficiency in organic crops and to minimize N requirements in the conventional cropping systems. Our results also show higher grain protein concentration and subsequently gain in protein yield with barley-pea intercropping than sole barley, especially when no N fertilizer was applied. Such systems on livestock farms could also cut down requirements of and costs on protein supplements in the animal feed.
5. CONCLUSION
Without applied N, grain yields improved with barleypea intercropping as compared to barley and pea as sole crops. In the barley-pea intercropping system, application of N fertilizer increased total grain yield when the crops were seeded in alternate rows, though without any beneficial effect on the LER and the net returns. In summary, the barley-pea intercrops improved grain yield, protein concentration in grain and sustainability of economic returns.
6. ACKNOWLEDGEMENTS
The authors thank H. S. Dhillon and D. Leach for technical help.
![]()
![]()
REFERENCES
- Jensen, E.S. (1996) Grain yield, symbiotic N2 fixation and interspecific competition for inorganic N in pea-barley intercrops. Plant and Soil, 182, 25-38. Hdoi:10.1007/BF00010992
- Hauggaard-Nielsen, H., Ambus, P. and Jensen, E.S. (2001) Temporal and spatial distribution of roots and competition for nitrogen in pea-barley intercrops—A field study employing 32P technique. Plant and Soil, 236, 63-74. Hdoi:10.1023/A:1011909414400
- Hauggaard-Nielsen, H. and Jensen, E.S. (2001) Evaluating pea and barley cultivars for complementarity in intercropping at different levels of soil N availability. Field Crops Research, 72, 185-196. Hdoi:10.1016/S0378-4290(01)00176-9
- Szczukowski, S. (1989) Yield and seed quality of field peas grown in mixtures with cereals and in pure stands. Acta Academiae Agriculturae ac Technicae Olstenensis, Agricultura, 47, 40 p.
- Danso, S.K.A. and Papastylianou, I. (1992) Evaluation of the nitrogen contribution of legumes to subsequent cereals. Journal of Agricultural Science, 119, 13-18. Hdoi:10.1017/S0021859600071495
- Paolini, R., Caporali, F. and Campiglia, E. (1993) Yield response, complementarity and competitive ability of bread wheat (Triticum aestivum L.) and pea (Pisum sativum L.) in mixtures. Agricoltura Mediterranea, 123, 114- 121.
- Rauber, R., Schmidtke, K. and Kimpel-Freund, H. (2000) Competition and yield advantage in mixtures of pea (Pisum sativum L.) and oats (Avena sativa L.). Konkurrenz und Ertragsvorteile in Gemengen aus Erbsen (Pisum sativum L.) und Hafer (Arena sativa L.), 185, 33- 47.
- Zielinska, A. and Rutkowski, M. (1988) Comparison of productivity of oats, barley and four cultivars of field peas in pure and mixed sowing. Acta Academiae Agriculturae ac Technicae Olstenensis, Agricultura, 46, 113- 124.
- Hiebesch, C.K. and McCollum, R.E. (1987) Area × time equivalency ratio: A method for evaluating the productivity of intercrops. Agronomy Journal, 79, 15-22. Hdoi:10.2134/agronj1987.00021962007900010004x
- De Wit, C.T. and van den Bergh (1965) Competition between herbage plants. Netherlands Journal of Agricultural Science, 13, 212-221.
- Szumigalski, A.R. and Van Acker, R.C. (2008) Land equivalent ratios, light interception, and water use in intercrops in the presence or absence of in-crop herbicides. Agronomy Journal, 100, 1145-1154. Hdoi:10.2134/agronj2006.0343
- Helenius, J. (1991) Insect numbers and pest damage in intercrops vs monocrops: Concepts and evidence from a system of faba bean, oats and Rhopalosiphum padi (Homoptera, Aphididae). Journal of Sustainable Agriculture, 1, 57-80. Hdoi:10.1300/J064v01n03_06
- Poggio, S.L. (2005) Structure of weed communities occurring in monoculture and intercropping of field pea and barley. Agriculture, Ecosystems & Environment, 109, 48- 58. Hdoi:10.1016/j.agee.2005.02.019
- Xiao, J., Zheng, Y., Tang, L., Li, L., Zhu, Y. and Yang, J. (2005) Effects of potassium and nitrogen supply on the occurrence of wheat rust in a wheat and faba bean intercropping system. Journal of Yunnan Agricultural University, 20, 640-645.
- Chen, Y., Zhang, F., Tang, L., Zheng, Y., Li, Y., Christie, P. and Li, L. (2007) Wheat powdery mildew and foliar N concentrations as influenced by N fertilization and belowground interactions with intercropped faba bean. Plant and Soil, 291, 1-13. Hdoi:10.1007/s11104-006-9161-9
- Izaurralde, R.C., McGill, W.B. and Juma, N.J. (1992) Nitrogen fixation efficiency, interspecies N transfer, and root growth in barley-field pea intercrop on a Black Chernozemic soil. Biology and Fertility of Soils, 13, 11- 16. Hdoi:10.1007/BF00337231
- Tofinga, M.P., Paolini, R. and Snaydon, R.W. (1993) A study of root and shoot interactions between cereals and peas in mixtures. Journal of Agricultural Science, 120, 13-24. Hdoi:10.1017/S0021859600073548
- Noel, R.J. and Hambleton, L.G. (1976) Collaborative study of a semi-automated method for the determination of crude protein in animal feeds. Journal of Association of Official Analytical Chemists, 59, 134-140.
- SAS Institute, Inc. (2004) Online documentation for SAS, version 8. SAS Institite, Cary. Hhttp://support.sas.com/documentation/onlinedoc/index.htmlH
- Anderson, M.K., Hauggaard-Nielsen, H., Ambus, P. and Jensen, E.S. (2004) Biomass production, symbiotic nitrogen fixation and inorganic N use in dual and tri-component annual intercrops. Plant and Soil, 266, 273-287. Hdoi:10.1007/s11104-005-0997-1
- Cowell, L.E., Bremer, E. and van Kessel, C. (1989) Yield and N-2 fixation of pea and lentil as affected by intercropping and N application. Canadian Journal of Soil Science, 69, 243-251. Hdoi:10.4141/cjss89-025
- Chen, C., Westcott, M., Neil, K., Wichmann, D. and Knox, M. (2004) Row configuration and nitrogen application for barley-pea intercropping in Montana. Agronomy Journal, 96, 1730-1738. Hdoi:10.2134/agronj2004.1730
- Knudson, M.T., Hauggaard-Nielsen, H., Jørnsgaard, B. and Jensen, E.S. (2004) Comparison of interspecific competition and N use in pea-barley, faba bean-barley and lupin-barley intercrops grown at two temperate locations. Journal of Agricultural Science, 142, 617-627. Hdoi:10.1017/S0021859604004745