Agricultural Sciences
Vol.3 No.4(2012), Article ID:20103,7 pages DOI:10.4236/as.2012.34053
Bud and spear development of asparagus under constant temperature
![]()
Leibniz-Institute of Vegetable and Ornamental Crops, Großbeeren and Erfurt, Theodor-Echtermeyer-Weg, Großbeeren, Germany; *Corresponding Author: feller@igzev.de
Received 21 March 2012; revised 20 April 2012; accepted 23 May 2012
Keywords: Asparagus Officinalis; Model; Yield; Physiology; “Backlim”; “Gijnlim”
ABSTRACT
Objectives of our study were to quantify the effects of apical dominance and bud cluster activity on asparagus yield patterns and to collect data for process-oriented modeling of the asparagus crop. Plants were grown in 40 L containers. After four years the soil above the asparagus crowns was removed and the containers were placed in a growth chamber at 20˚C for three months. During this time, spear length was measured daily except at weekends, and spears were cut when longer than 25 cm. Each spear was assigned to a bud cluster, defined as a dense group of buds clearly distinct from other bud groups on the crown. Although temperature was constant, several properties measured in this study changed during the experiment. The number of active bud clusters first increased then decreased, the lag time between spears growing at the same cluster increased, and the relative growth rate of spears decreased. The constant increase of harvested spears per plant stopped abruptly when the plants ran out of viable buds. At the crop level, i.e. the average for all plants, which is normally monitored in field trials, the transition from linear yield increase to zero increase was less abrupt since plants stopped growing spears on different dates. In our study asparagus yield, i.e. the number of harvested spears, was not limited by low carbohydrate in storage roots, but by a lack of viable buds. This was concluded from the abrupt halt in spear production observed in all plants despite the fact that some plants still had considerable carbohydrate content.
1. INTRODUCTION
Asparagus yield is the result of a complex sequence of physiological processes that are influenced by environment and management in current and previous years [1]. Therefore, all attempts to predict the yield of asparagus crops by means of simple regression models have failed. This has been shown for example by [2] who related different properties of the previous year’s fern canopy to the yield of the current harvest season, often finding close correlations. The predictive value of the regression functions, however, was very limited, since the regression parameters varied considerably between experiments.
Several studies reported a close correlation between spear yield and temperature ([3-6]). However, temperature alone is also a poor predictor for yield. For instance, one study [4] analyzed yield data from one farm over six years and found that cumulative yield could vary up to 30% between years, even when comparing periods with the same temperature sums.
One group [7] developed a more comprehensive model of asparagus production and used it to simulate yield as affected by different management strategies. This model already described the most important elements in the production cycle of asparagus, such as harvest period, fern growth, photosynthesis and storage of carbohydrates. However, the accuracy of this model cannot be evaluated since it has not been sufficiently validated. In a review of the asparagus plant physiology [8] stated that since so little was known at that time, [7] were obliged to work with several empirical assumptions instead of describing the underlying physiological processes in their model.
Since then knowledge about yield physiology has much improved. For instance [9] showed that asparagus yield is related to the carbohydrate supply in storage roots and [10] suggested a method to check if yield is limited by a low carbohydrate status. The work of Woolley et al. (2008) [11] indicated that the number of buds also can limit the total number of high quality spears. The model suggested by [12] was considerably more mechanistic than the model of [7]. However, to our knowledge validation of Woolley’s model has not been published so far. Recently, [13] developed a processoriented model taking in consideration the previous studies mentioned above plus new experimental data ([13, 14]). The model was evaluated with data from two field experiments, and it was able to describe daily spear yield quite accurately (Root mean square error = 4.53 g fresh matter plant–1·day–1, n = 543). Simulations with this model also showed that predictions of daily yield depended to a great extent on the parameterization of physiological processes, such as apical dominance of a growing spear within one bud cluster and the activity of various bud clusters within one plant. So far the effects of these processes on yield are fairly well understood qualitatively, but there is not enough quantitative data to estimate robust model parameters.
We therefore, wanted to quantify the effects of apical dominance and bud cluster activity on asparagus yield patterns to provide data for parameterization of processoriented modeling of the asparagus crop.
2. MATERIAL AND METHODS
2.1. Experiment
In April 2004, ten 40 L containers were filled with loamy sand taken from the top layer of an asparagus field at the research station in Großbeeren (Arenic Luvisol, 52˚20’N, 13˚19’E). A single, one year old asparagus plantlet was planted in each container. Five containers were planted with the cultivar “Gijnlim” and five with “Backlim”. The containers were set up in the field, with water and nutrients being supplied by drip irrigation. On April 1, 2008 the soil above the asparagus crowns was carefully removed. The containers were placed in a growth chamber at 20˚C from April 7, 2008 until July 4, 2008. During this time spear length was measured daily except at weekends, and spears were cut close to the crown when longer than 25 cm. Asparagus spears can grow more than 15 cm per day. Spears, which were not long enough for harvest (e.g. 24 cm) on one day, were harvested with up to 40 cm length the next day or even longer when there was a weekend between harvest dates.
Each spear was assigned to a bud cluster, where a bud cluster was defined as a dense group of buds clearly distinct from other groups of buds on the crown. Typically the buds belonging to one bud cluster appeared within a circle with a diameter of approximately 4 cm. Distances between centers of different bud clusters were in the range of 5 to 15 cm. During the time in the growth chamber the containers were watered once a week but not fertilized. The light in the growth chamber was only on during measurement periods. The average carbon dioxide concentration in the growth chamber was 420 ppm.
2.2. Carbohydrates in Storage Roots
At the end of the experiment, storage roots with a diameter of more than 3 mm were collected from each container separately. All these roots were rinsed with tap water, cut and mixed. Approximately 60 g of fresh matter was lyophilized and milled. Before analyses, samples were heated to 80˚C for 30 minutes to denature enzymes. Then the carbohydrates were analyzed in a four step process: 1) glucose and fructose were determined enzymatically using a test kit from Roche Diagnostics; 2) sucrose was hydrolyzed with α-glycosidase, and sucrose content was determined from the difference between fructose before and after hydrolyzation of saccharose; 3) fructans were hydrolyzed with fructanase, and glucose and fructose were determined enzymatically using a test kit from Roche Diagnostics; 4) fructan content was determined by the difference between glucose and fructose before and after hydrolyzation of fructans. The method for analyzing fructans is described in detail by [15]. The sum of glucose, fructose, sucrose and fructans is referred to here as carbohydrates in storage roots (CHO). CHO data for one plant of “Backlim” is missing since this plant had fewer intact storage roots than required for the analysis (Table 1).
2.3. Data Analysis
Missing data points in spear growth curves are due to no spear length measurements on weekends. To interpolate the missing data and smooth the spear growth curve, a model was fitted to the measurements.
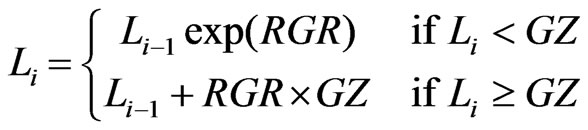 (1)
(1)
where L is the spear length (m), i the day number, RGR
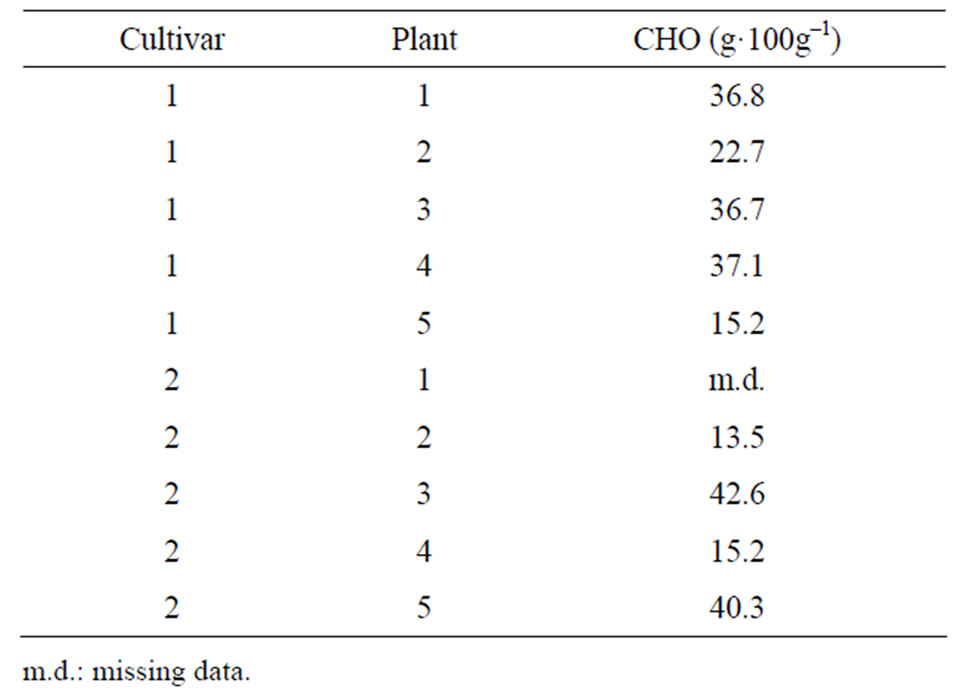
Table 1. Carbohydrates (CHO) in storage roots at the end of the experiment.
the relative spear growth rate (day–1) and GZ the growing zone (m) where the spear grows exponentially. The model generates an exponential length growth until the spear reaches the length GZ. Thereafter, the spear grows with a constant absolute growth rate given by (RGR × GZ). Parameter values for RGR were estimated for each spear separately by fitting the model to the measurements by a least square algorithm. GZ was set to 6 cm according to [16], who found that with a spear length of 10 cm the elongation zone of the spear was approximately 6 cm.
The model was used for two purposes: 1) to quantify the growth rates of individual spears by estimating parameter RGR; and 2) to determine the day when a bud started to grow into a spear. By our definition spear growth started on the first day when modeled spear length was greater than 0.5 cm. RGR was estimated using the complete data set. Additionally, to estimate the beginning of spear growth, we fitted the model only to that part of the data where measured spear length was less than 6 cm. This resulted in better estimations of growth start, since omitting lengths greater than 6 cm improved the model fit in the range from 0.5 to 6 cm.
3. RESULTS
3.1. Spear Growth Rate
The model described the time course of spear growth very well (r2 = 0.97, n = 6259, p < 0.001). Spear growth rates, as estimated with the model (Eq.1), were significantly different between “Gijnlim” and “Backlim” (0.60 ± 0.01 and (0.53 ± 0.01) m·m–1·day–1, respectively; p < 0.001). RGR was highly variable and decreased during the experiments in “Gijnlim” but not in “Backlim” (Figure 2). Our hypothesis that decreasing growth rates over time were caused by a decreasing carbohydrate supply was not confirmed in this study. At the end of the experiment, plants showed a broad range of carbohydrates in storage roots (Table 1). However, there was no significant correlation with spear growth rate (Figure not shown).
3.2. Spear Appearance Rate at the Bud Cluster Level
Many bud clusters had only one growing spear at a time, since new spears only started to grow after the previous spear was harvested. This pattern indicated that a growing spear inhibited the development of the next bud (e.g. Figure 3(a)). However, there were also bud clusters with up to four spears growing simultaneously (e.g. Figure 3(b)), revealing that spear appearance patterns were quite diverse.
In order to quantify the inhibitory effect of a growing spear on the growth of other spears we calculated the frequency of spears growing simultaneously at the same

Figure 1. Measured spear length related to spear length simulated with Eq.1. Points show measurements, the line is the regression line (r2 = 0.97, n = 6259, p < 0.001, y = 0.99x + 0.002).

Figure 2. Relative growth rate (RGR) of spears related to time (day number of spear harvest counted from the beginning of the experiment). Dots show measurements. Lines are regression lines (r2 = 0.04, p < 0.001 and r2 = 0.0009, p = 0.62 for “Gijnlim” (left) and “Backlim” (right)).
 (a)
(a) (b)
(b)
Figure 3. Two examples of the succession of spears growing at different bud clusters. (a): bud cluster 6, plant 4, “Gijnlim”; (b): bud cluster 1, plant 3, “Backlim”. Points are measurements. Lines are simulations using Eq.1.
bud cluster (Figure 4). In most cases only one spear was growing, i.e. this spear started to grow when there was no other growing spear present. The frequency distributions showed that the probability for a spear starting to grow decreased with the number of spears already present at the same bud cluster, indicating that the inhibitory effect of growing spears was cumulative. Frequency distributions were similar in both cultivars, but slightly more right skewed in “Gijnlim”.
After a spear was harvested from a bud cluster with no other growing spears, it took some time before a new spear started to grow. On each day when a new spear started to grow we counted the number of preceding days without growing spears at the same bud cluster. This number of days is referred to here as LAG. LAG equaling zero refers to spears that started to grow when there were other spears present at the same bud cluster. The regression line shown in Figure 5 indicated that at the

Figure 4. Number of spears growing simultaneously at the same bud cluster. The numbers of growing spears were counted on all days when a new spear started to grow. “Gijnlim” is shown on the left and “Backlim” on the right.

Figure 5. Time until a new spear started to grow after the previous spear was harvested from the same bud cluster (LAG) related to time since the beginning of the experiment. LAG = 0 days indicate cases where there was no LAG, i.e. there were other spears growing at the same bud cluster when a new spear started to grow. Dots show measurements. Lines are regression lines (r2 = 0.07, p < 0.001 and r2 = 0.09, p < 0.001 for “Gijnlim” (left) and “Backlim” (right)).
end of the experiment the average LAG was five days in “Gijnlim” and three days in “Backlim”. At the beginning of the experiment, however, there was no LAG because two or more spears grew simultaneously at all active bud clusters. Figure 6 gives the visual impression that LAG increased with decreasing carbohydrates in storage roots, but the correlation was not statistically significant.
The average number of spears per bud cluster was not significantly different in “Gijnlim” and “Backlim” (6.5 ± 0.4 and 5.8 ± 0.5, respectively; p = 0.27). In both cultivars the number of spears per bud cluster decreased significantly with the day number since the cluster became active (r2 = 0.49, p < 0.001 and r2 = 0.28, p < 0.001).
3.3. Spear Appearance Rate at the Plant Level
The active time of bud clusters was defined as the number of days between the start of growth of the first and last spear at one cluster. The average number of active bud clusters was about four clusters per plant in both cultivars at the beginning of the experiment. Thereafter, the time course of active bud clusters showed marked differences between cultivars (Figure 7) since “Backlim”
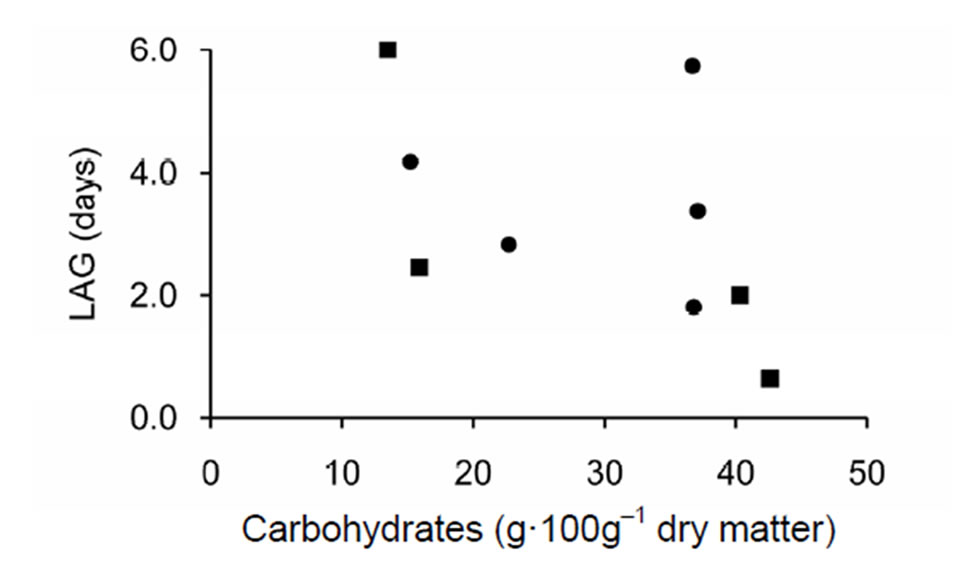
Figure 6. Time until a new spear started to grow after the previous spear was harvested from the same bud cluster (LAG) related to carbohydrates (CHO) in storage roots at the end of the experiment (l—“Gijnlim”, n—“Backlim”).

Figure 7. Number of active bud clusters related to time since the beginning of the experiment. Points show averages of five plants. Bud clusters were counted as active during the time between growth of the first and the last spear of each cluster (l—“Gijnlim”, n—“Backlim”).
developed fewer active bud clusters and stopped producing spears earlier.
The average spear appearance rates per plant showed characteristic patterns (Figure 8). Initially several—but not all—plants had a high spear appearance rate, which was caused by spears growing simultaneously at those bud clusters that were active from the start of the experiment. Thereafter followed a period with an almost constant rate, which resulted in a linear increase of spears for approximately 75 days. Subsequently, spear appearance rate was zero, i.e. no spear at all appeared until the end of the experiment. Both the length of the period until the plants stopped producing spears ((78 ± 1.3) and (71 ± 1.3) days, p = 0.005), and the total number of harvested spears were significantly different between cultivars ((91.8 ± 8.2) and (54.8 ± 8.2) spears plant–1, p = 0.013).
4. DISCUSSION
4.1. Spear Level
Several studies have shown that asparagus spear growth rate is closely linked to both temperature and spear length, and several models have been suggested to describe this relationship [17,18]. Most models similarly describe exponential growth during a first phase of spear growth. Some authors suggested a decline relative growth rate during a second phase [19], which is also a trait of our model (Eq.1). However, it was not our aim to compare different approaches to modeling spear growth, but rather only to use model only to quantify relative spear growth rates (RGR). This model was selected because it fitted the measurements very well (r2 = 0.97, Figure 1) although it needed only one parameter, RGR, to be estimated for each growth curve. The model was also useful for estimating the day when a bud began to grow, which by our definition was the day when a bud was longer than 0.5 cm. This estimation would have been difficult to make based on measurements alone, particularly with missing data over the weekends. In our study spear growth rate decreased with time (Figure 2) but was not significantly correlated to carbohydrate in storage roots (figure not shown). The lack of significance was perhaps caused by our small data set, since [20] reported lower spear growth rates when carbohydrate supply was limited. Also [13] found decreasing spear growth rates with decreasing carbohydrate supply in storage roots.
4.2. Bud Cluster Level
It was stated by [21] as early as 1926 that the pattern of bud break is controlled by apical dominance within each bud cluster on the crown, i.e. growing spears produce inhibitory effects, which extend only to the buds of the same bud cluster. [22] reported that as many as seven buds on a crown started growing within 24 hours of each

Figure 8. Cumulative number of spears related to time since the beginning of the experiment. Solid lines show data from each plant separately, dashed lines are averages. Graphs along the top show “Gijnlim”, and along the bottom “Backlim”.
other, but no two spears ever developed from the same cluster at the same time. Also in our study many bud clusters had only one growing spear at a same time. However, we also observed many bud clusters with up to four spears growing simultaneously (e.g. Figure 3(b)).
Based on the frequency distributions observed in our study (Figure 4) we suggest modeling the effect of apical dominance within asparagus bud clusters as a stochastic process, where the probability of a spear starting to grow decreases with the number of spears already present at the same bud cluster.
[22] reported that generally at least a three day lag occurred between removal of a spear and growth of another bud in the same cluster. In our study LAG time (Figure 5) ranged from zero to 28 days and showed a considerable, apparently random, variability. LAG correlated weakly, but with statistical significance with time after the start of the experiment, but showed no statistically significant correlation with carbohydrates in storage roots (CHO, Figure 6). So far it is not clear which endogenous factors mediated the increase in LAG with time. In the model of [13] LAG is treated as a stochastic variable, whose value decreased with temperature and increased with lower CHO.
4.3. Plant Level
[9] showed that asparagus yield can be limited by the availability of carbohydrates in storage roots. However, [11] stated that the number of available buds also can limit yield. As reported by [22] from an experiment in a constant environment, as in our study (Figure 8(b)), the rate of spear production was initially almost constant for a considerable time. Thereafter, yield—in terms of the number of harvested spears—was not limited by a low carbohydrate status in storage roots but by a lack of viable buds. We concluded this from observing the abrupt stop in spear production in all plants (Figure 8) despite the fact that some plants still had considerable carbohydrate content (Table 1). The marketable yield would have been reduced much earlier than the spear number yield, since marketable yield is affected by both spear number and spear diameter, and spear diameter decreases with harvest time and hence with carbohydrate supply.
The number of harvested spears was significantly different between the cultivars in our study. [8] concluded from earlier experiments ([23,24]) that the number of buds is genetically controlled and does not depend on the environment or carbohydrate supply. In contrast, [25] found that total and viable bud numbers decreased in the year following a season with soil moisture stress. The main period of bud formation is during fern growth following harvest and only a few buds are formed during harvesting ([8,23]). However, even if new buds were formed, they may not be viable and hence not contribute to spear yield of the current harvest [11]. We observed that only a few new buds were formed during our experiments. Therefore, the plants run out of buds during the unusually long harvest period.
Recent research has provided considerable insights into the physiological processes determining asparagus yield. However, current knowledge is still not enough to understand and model, under which conditions asparagus yield is limited by lack of viable buds or lack of carbohydrate supply.
4.4. Summary and Conclusions
Temperature was constant, but several plant properties changed during the study. The number of active bud clusters first increased then decreased (Figure 7), the lag time between spears growing at the same cluster increased (Figure 5 ) and the relative growth rate of spears decreased (Figure 2, “Gijnlim”). However, at the plant level the combined effects resulted in an almost constant increase in harvested spears per plant, which stopped abruptly when the plants ran out of viable buds (Figure 8). At the crop level, as normally monitored in field trials, the average transition of all plants from linear yield increase to zero increase was less abrupt, since plants stopped growing spears at different times.
We did not observe that the number of harvested spears was limited by a low carbohydrate status in storage roots; rather it was apparently due to a lack of viable buds.
Several properties that are relevant for yield differed significantly between the two cultivars tested in this study. The most important differences were the number of viable buds and the number of active bud clusters. We intend to use these results to better estimate robust parameters in the process-oriented asparagus growth model suggested by [13].
5. ACKNOWLEDGEMENTS
The authors wish to thank Ursula Hoffmann for her skillful technical assistance. Financial support from the Ministries of Agriculture of the Federal Republic of Germany, and from the States of Brandenburg and Thüringen is also gratefully acknowledged.
REFERENCES
- Wilson, D.R., Sinton, S.R., Butler, R.C., Drost, D.T., Paschold, P.J., van Kruistum, G., Poll, J.T.K., Garcin, C., Pertierra, R., Vidal, I. and Green, K.R. (2008) Carbohydrates and yield physiology of asparagus—a global overview. Acta Horticulturae, 776, 413-427.
- Knaflewski, M. (1994) Yield prediction of asparagus cultivars on the basis of summer stalk characteristics. Acta Horticulturae, 371, 161-168.
- Dean, B.B. (1999) The effect of temperature on asparagus spear growth and correlation of heat units accumulated in the field with spear yield. Acta Horticulturae, 479, 289- 295.
- Liebig, H.P. and Wiebe, H.J. (1982) Kurzfristige ertragsprognose von bleichspargel. Gartenbauwissenschaft, 47, 91-96.
- McCormick, S.J. and Geddes, B. (1996) Effect of production temperature on the quantity and quality of green asparagus spears. Acta Horticulturae, 415, 263-269.
- Poll, J.T.K. (1996) The effect of temperature on fibrousness of green asparagus. Acta Horticulturae, 415, 183- 187.
- Lampert, E.P., Johnson, D.T., Tai, A.W., Kilpatrick, G., Antosiak, R.A., Crowley, P.H. and Goodman, E.D. (1980) A computer model to maximise asparagus yield. Journal of the American Society for Horticultural Science, 105, 37-42.
- Robb, A.R. (1984) Physiology of asparagus (Asparagus officinalis) as related to the production of the crop. New Zealand Journal of Experimental Agriculture, 12, 251- 260.
- Wilson, D.R., Sinton, S .R. and Wright, C.E. (1999) Influence of time of spear harvest on root system resources during the annual growth cycle of asparagus. Acta Horticulturae, 479, 313-319.
- Wilson, D.R., Cloughley, C.G. and Sinton, S.R. (2002) AspireNZ: A decision support system for managing root carbohydrate in asparagus. Acta Horticulturae, 589, 51- 58.
- Woolley, D.J., Daningsih, E. and Nichols, M.A. (2008) Bud population dynamics and productivity of asparagus. Acta Horticulturae, 776, 429-433.
- Wilson, D.R., Cloughley, C.G., Jamieson, P.D. and Sinton, S.R. (2002) A model of asparagus growth physiology. Acta Horticulturae, 589, 297-301.
- Graefe, J., Heißner, A., Feller, C., Paschold, P.J., Fink, M. and Schreiner, M. (2010) A process-oriented and stochastic simulation model for asparagus spear growth and yield. European Journal of Agronomy, 32, 195-204. doi:10.1016/j.eja.2009.11.004
- Heißner, A., Schmidt, S., Schonhof, I., Feller, C. and Schreiner, M. (2006) Spear yield and quality of white asparagus as affected by soil temperature. European Journal of Agronomy, 25, 336-344. doi:10.1016/j.eja.2006.07.001
- Koball, G. and Habel, A. (2002) Vergleich verschiedener methoden zur insulinbestimmung in getreidelebensmitteln. Getreide, Mehl und Brot, 56, 198-203.
- Guo, J., .Jermyn, W.A. and Turnbull, M.A. (2001) Carbon metabolism in developing spears of two asparagus (Asparagus officinalis) cultivars with constrasting yield. Australian Journal of Plant Physiology, 28, 1013-1021.
- Wilson, D.R., Cloughley, C.G. and Sinton, S.R. (1999) Model of the influence of temperature on the elongation rate of asparagus spears. Acta Horticulturae, 479, 297- 304.
- Ku, Y.G., Woolley, D.J. and Nichols, M.A. (2008) The effect of chilling duration and temperature on asparagus spear growth. Acta Horticulturae, 776, 445-452.
- Kim, Y.S., Sakiyama, R. and Tazuke, A. (1989) Effect of temperature on the elongation rate ant the estimation of weight of asparagus spears. Journal of the Japanese Society for Horticultural Science, 58, 155-160. doi:10.2503/jjshs.58.155
- Kim, Y.S. and Sakiyama, R. (1989) Effects of quantity and temperature of storage roots on the elongation rates of asparagus spears. Journal of the Japanese Society for Horticultural Science, 58, 377-382. doi:10.2503/jjshs.58.377
- Tiedjens, V.A. (1926) Some observations on root and crown bud formation in asparagus officinalis. Proceedings of the American Society for Horticultural Science, 23, 189-195.
- Nichols, M.A., Woolley, D.J., (1985) Growth studies with asparagus. Proceedings of the 6th International Asparagus Symposium, Guelph, 5-9 August 1985, 287-297.
- Tiedjens, V.A. (1924) Some physiological aspects of asparagus officinalis. Proceedings of the American Society for Horticultural Science, 21, 129-140.
- Blasberg, C.H. (1932) Phases of the anatomy of seedling asparagus. Botanical Gazette, 94, 206-214. doi:10.1086/334292
- Drost, D.T. and Wilcox-Lee, D. (1997) Soil water deficits and asparagus: II. Bud size and subsequent spear growth. Scientia Horticulturae, 70, 145-153. doi:10.1016/S0304-4238(97)00042-3