International Journal of Geosciences
Vol.08 No.05(2017), Article ID:76081,12 pages
10.4236/ijg.2017.85035
GPR Tomographic Imaging of Concrete Tubes and Steel/Plastic Tanks Buried in IAG/USP Geophysical Test Site, Brazil
Jorge Luís Porsani, Emerson Rodrigo Almeida, Bruno Poluha, Vinícius Rafael Neris dos Santos
Universidade de São Paulo, Instituto de Astronomia, Geofísica e Ciências Atmosféricas, Departamento de Geofísica. Rua do Matão, 1226, Butantã, São Paulo, Brazil

Copyright © 2017 by authors and Scientific Research Publishing Inc.
This work is licensed under the Creative Commons Attribution International License (CC BY 4.0).
http://creativecommons.org/licenses/by/4.0/


Received: March 30, 2017; Accepted: May 7, 2017; Published: May 10, 2017
ABSTRACT
In this paper, the Ground Penetrating Radar (GPR) method was used to characterize concrete tubes and steel/plastic tanks buried in IAG/USP test site. The microwave tomography was used to improve the GPR images, aiming to retrieve the geometry of the targets. The numerical modeling studies also were done in order to predict the GPR results of the buried targets and to give more reliability to the results interpretation. The targets were installed in the first shallow geophysical test site of the Brazil located at Institute of Astronomy, Geophysics, and Atmospheric Science (IAG) of the University of São Paulo (USP). GPR profiles of 200 MHz (shielded bistatic antennas) were acquired along three lines containing concrete tubes and steel/plastic tanks buried in subsoil. The concrete tubes show a hyperbolic reflector for the top, and the vertical tube also presented a reflection on its bottom. The horizontal steel tanks were characterized by a strong GPR reflection on their top. The empty plastic tank shows a strong reflector for the top with normal polarity. On the other hand, the plastic tank filled with water shows a weaker reflector for its top characterized by the inverted polarity of GPR signal when compared with empty plastic tank. The plastic tank filled with water also went characterized by the strong reflection to its bottom, being a good indicative to interpret GPR data on target in subsoil with some types of fluid inside of tank. The results of polarity difference for the top of tank can be used as guide pattern to identify buried tank empty or filled with water. The application of microwave tomography to the GPR data permitted to determine the position and get a good identification of the edges of the targets studied. The numeric modeling presented a good accordance with real data reducing the ambiguities in interpretation of results. These results can be used as a reference, and they can be extrapolated for areas where there is no subsurface information.
Keywords:
Ground Penetrating Radar (GPR), Microwave Tomography, Numeric Modeling, Concrete Tubes, Steel Tanks, Plastic Tanks, IAG/USP Test Site, Brazil

1. Introduction
The Ground Penetrating Radar (GPR) is a geophysical method that uses electromagnetic waves in high frequency (10 MHz to 2.6 GHz) and has innumerable applications for shallow subsurface investigations, such as urban problems, infra-structure, environmental studies, mineral exploration, geological, hydrogeological, and archaeological studies. The electromagnetic theory of the GPR method can be found in [1] - [7] , among others.
The population growth together with the fast industrial development in the large cities has caused various problems to society, such as environmental contamination. Others problems are related with the installation of galleries for pluvial water canalization, the placing of pipes underground for water supply, installation of gas pipelines in the subsoil, among others. Usually, the problems are related to the destruction of pre-existing underground utilities, which disrupt the local economy, transport, communication, and may even put lives at risk.
The use of geophysical methods is recommended before beginning geotechnical excavation in the urban environment. Particularly, GPR is efficient for detect previously installed utilities in the subsoil, such as concrete tubes, water and gas pipelines, electric and telephone cables, etc. [8] - [16] . Therefore, the use of geophysical methods can prevent dangerous accidents and minimize the risk situations for society. However, the data interpretation is very complex because the ambiguities found in the results. To reduce the uncertainties, the GPR study was performed under controlled conditions in the IAG/USP geophysical test site in order to obtain the better understanding the normal reflection patterns caused by different targets in the subsoil. Some GPR results using this line of research can be found in the literature [10] [11] [12] [13] [17] , among others.
This paper presents some results of GPR modeling, standard processing and microwave tomography application in GPR data, over empty concrete tubes, empty steel tanks and plastic tanks (empty and filled with water) buried in the IAG/USP test site [12] in order to characterization these targets that usually are present in the subsoil of the large cities of the world. The test site is located in a geologic urban context different from other worldwide test sites and it is situated at the border of São Paulo sedimentary basin, in São Paulo city, Brazil (Figure 1).
The knowledge of the correct spatial distribution of targets in the subsoil is important in mapping buried utilities for urban planning and environmental studies. Therefore, the goal is to define the target location. This information serves as basis for planning the advance of geotechnical excavations in urban

Figure 1. Location map of São Paulo city, Brazil, and landscape of the IAG/USP test site with the photography of concrete tubes, and steel/plastic tanks.
centers because it helps minimize problems related to the damage or destruction of preexisting underground utilities, and avoid dangerous accidents.
2. Study Area: IAG/USP Geophysical Test Site
The test site at the Institute of Astronomy, Geophysics, and Atmospheric Science-IAG at the University of São Paulo-USP (IAG/USP Geophysical test site) is located close to IAG/USP building and it was constructed for teaching and research purposes.
Geologically, the test site is situated at the border of São Paulo sedimentary basin in São Paulo city, Brazil (Figure 1). The local geology is characterized by a clayey-sand soil (typically tropical soil) with 6 m thickness of organic material, and sand-clayey sediments of Resende and São Paulo formations underlie the local area with 47 m thickness and water table is ~6.5 m depth, overlapping onto the granite-gneissic basement [18] .
It has an area of 1500 m 2 (50 m × 30 m ). Different materials and object sizes were buried aiming simulate urban problems, environmental and archaeological studies. Plastic, steel and concrete targets with different geometries were buried along seven lines in the NS magnetic direction with long axes in the NS or EW directions, and at depths to tops varying from 0.5 to 2 meters . The spatial distribution of the targets was measured with the total station. The local landscape was restored, and the only evidence at the surface is of four concrete marks placed at the corners of the test site (Figure 1). The details of the construction can be found in [12] . Other interesting geophysical results are found in [14] [15] [16] [19] [20] .
One concrete tube with 0.7 m diameter and 2 m long was buried in vertical position at 1 m depth and another one with 0.48 m diameter was buried in horizontal position at 0.5 m depth. Two steel tanks of 200 liters with 1 m long were buried empty in horizontal position at 0.5 m and 1.0 m depth. The two plastic tanks with 0.59 m of diameter and 0.86 m long were buried in horizontal position at 0.5 m, being one empty and another filled with water. The water was put inside the plastic tank to simulate a resistive contaminant, aiming studies of contamination in the subsoil. Figure 1 shows a landscape of the IAG/USP test site with the photography of the concrete tubes (horizontal and vertical), steel and plastic tanks.
The concrete tubes were used to simulate the galleries for pluvial water canalization and usually they are found in subsoil of the great urban centers, and the cylindrical steel tanks and plastic tanks were installed to simulate environmental studies.
3. Modeling, Acquisition and Processing of GPR Data
2D GPR numerical modeling was done using Reflexw software [21] . Its purpose is predict the GPR results on the targets buried in real data acquisition and to give more reliability to interpretation of the GPR profile, reducing the ambiguities. The GPR behavior of propagation and reflection of electromagnetic wave was simulated by the Finite-Difference Time-Domain (FDTD) numerical method [22] . FDTD method is based on implementation of mathematical codes through successive numerical approximates, replacing differential equations for finite differences. In this way, the algebraic equations solve Maxwell equations. The model is discretized in a compound grid by a finite set of points, represented by knot mesh. Each knot represents a vector field with the physical properties. The Table 1 shows the electrical conductivity (σ) and dielectric constant (ε) used to construct the synthetic models. The relative magnetic permeability value was equal to 1 for all simulated targets. For GPR wave simulating the following parameters were used: 200 MHz antennas, spacing between the A-scans of 1 cm, the electric field Ey antenna polarization [23] and exploding reflector source [21] . The Tables 2-4 show the geometrics parameters of the spatial distribution of the concrete tubes buried in the vertical and horizontal position in the test site, steel tanks and plastic tanks used in GPR modeling, respectively. The external and internal diameters were measured with a metric line.

Table 1. Dielectric permittivity and electrical conductivity of the targets used in GPR numerical modeling [2] [4] [9] [21] .
Table 2. Geometric parameters used in modeling related to spatial distribution of the concrete tubes buried in the vertical and horizontal positions in the IAG/USP test site and its contents.
Table 3. Geometric parameters used in modeling related to spatial distribution of the steel tanks buried in the horizontal positions in the IAG/USP test site and its contents.
Table 4. Geometric parameters used in modeling related to spatial distribution of the plastic tanks buried in the vertical position in the IAG/USP test site and its contents.
GPR profiles of 200 MHz (shielded bistatic antennas) were acquired at the IAG/USP test site by using a SIR-3000 equipment (GSSI). Profiles were acquired in a NS direction using continuous mode and the interval between the A-scans was 2 cm. In all profiles, the electric field-Ey polarization (long antenna axis) was positioned perpendicular to the direction of line to maximizing the amplitude of the signal [15] .
GPR processing was done using Radan software (GSSI) aiming to improve the visualization of concrete tubes and steel/plastic tanks. The main stages used in standard data processing were: time zero correction, band pass filter, gain varying in time, spatial filter, and time to depth conversion. The band pass filters (in time) were applied to reduce the amplitude of the noise of low and high frequency. The linear gain varying in time was applied to compensate the energy losses due to the absorption, spherical divergence, and scattering. The spatial filter of 3 traces was applied to the data and resulted in a horizontal smoothing. The time to depth conversion was done for a velocity value of 0.057 m/ns (dielectric constant of 28), being compatible with a saturated clay material [18] . The velocity (v = 2 h/t) was obtained using the real depth (h) information of the targets [12] , and it is the time of reflection read in vertical axe of the GPR profile.
The microwave tomography is a technique of advanced data processing and permits to improve the visualization and the interpretation of GPR data. Its theory is well described in literature and consists in an inversion problem that it aims to retrieve the geometry of buried targets [20] [24] [25] [26] . The inverse problem of the microwave tomography for GPR applications concerns the retrieving of the contrast function (χ) of the subsurface being expressed by equation:

where  is the complex dielectric permittivity as function of discretized space [20] [26] , ε is the dielectric constant, σ is the electric conductivity, ω is the angular frequency and εb is the complex dielectric permittivity of the background. The tomography image is represented as being normalized absolute values of the contrast function and it was done using RadImage v1.0 program [27] . In this article, it was used on GPR profiles on the targets buried in the IAG/USP test site after of standard data processing aiming improve the visualization of image and the geometry characterization of these targets aiming to urban planning and environmental studies purposes.
4. Analysis of Results
Figure 2(a) shows spatial distribution of concrete tube buried in the vertical (2 m position) and horizontal (5 m position) at IAG/USP test site. Figure 2(b) shows the result of GPR numerical modeling for 200 MHz frequency perpendicular to the targets of Figure 2(a). Observe that the modeling give a good reflection for vertical concrete tube detecting the top and its bottom and for horizontal tube only the top was detected.
Figure 2(c) presents GPR profile of 200 MHz on the targets of Figure 2(a). Note that the reflection pattern is different for vertical and horizontal concrete tube, as detected by numerical simulation result. The vertical concrete tube is characterized by strong hyperbolic reflector on the top and its bottom was characterized by a reverberation of the reflected signal inside of the tube. The horizontal concrete tube shows a clear hyperbolic reflection for its top. The good reflection on top of the concrete tubes is due to the high contrast of physical properties between the concrete tube and the soil clayey (Table 1). Observe that the real results were very similar to the numerical modeling.
Figure 2(d) presents the microwave tomography image for the Figure 2(c). Note that the geometry of the vertical concrete tube became clearer and it was characterized by high amplitude anomaly. On the other hand, the horizontal concrete tube (5 m position) the microwave tomography shows the low amplitude anomaly, probably because the low definition of the target seen in the real data. However, one can still see that the anomaly at the top of the target can be identified as a small cross-section target.
Figure 3(a) present the spatial distribution of two steel tanks empty buried in the horizontal position (2 m and 6 m positions) at geophysical test site. Figure 3(b) shows the numerical modeling result for 200 MHz frequency on the targets of Figure 3(a). The modeling result give a good reflection of high amplitude for the top of horizontal steel tanks.
Figure 3(c) presents GPR profile of 200 MHz on the targets of Figure 3(a) that is characterized by strong hyperbolic reflector on the top of the steel tanks. The high amplitude anomaly for the top of steel tanks is due to the high contrast between the physical properties of steel tanks and the background characterized by the soil clayey (Table 1). Note that the real results are completely similar to the numerical modeling.
Figure 3(d) shows the microwave tomography image for the Figure 3(c). Observe that the position of the two horizontal steel tanks (2 m and 6 m positions) was well recovered. The geometry was not recovered, because in this case the tomography is able to recover just an anomaly at the top of the target. This anomaly is characterized by a high amplitude anomaly because of the high contrast between the physical properties of steel tanks and the background.
Figure 4(a) shows spatial distribution of two plastic tanks buried in the vertical position at IAG/USP test site. The first one (2 m position) is empty and the

Figure 2. (a) Spatial distribution of concrete tube buried in the vertical and horizontal position at IAG/USP test site. (b) GPR numerical modeling result for 200 MHz frequency perpendicular to the targets of Figure 2(a). (c) GPR result for 200 MHz frequency on the targets of Figure 2(a). (d) Microwave tomography result of Figure 2(c).
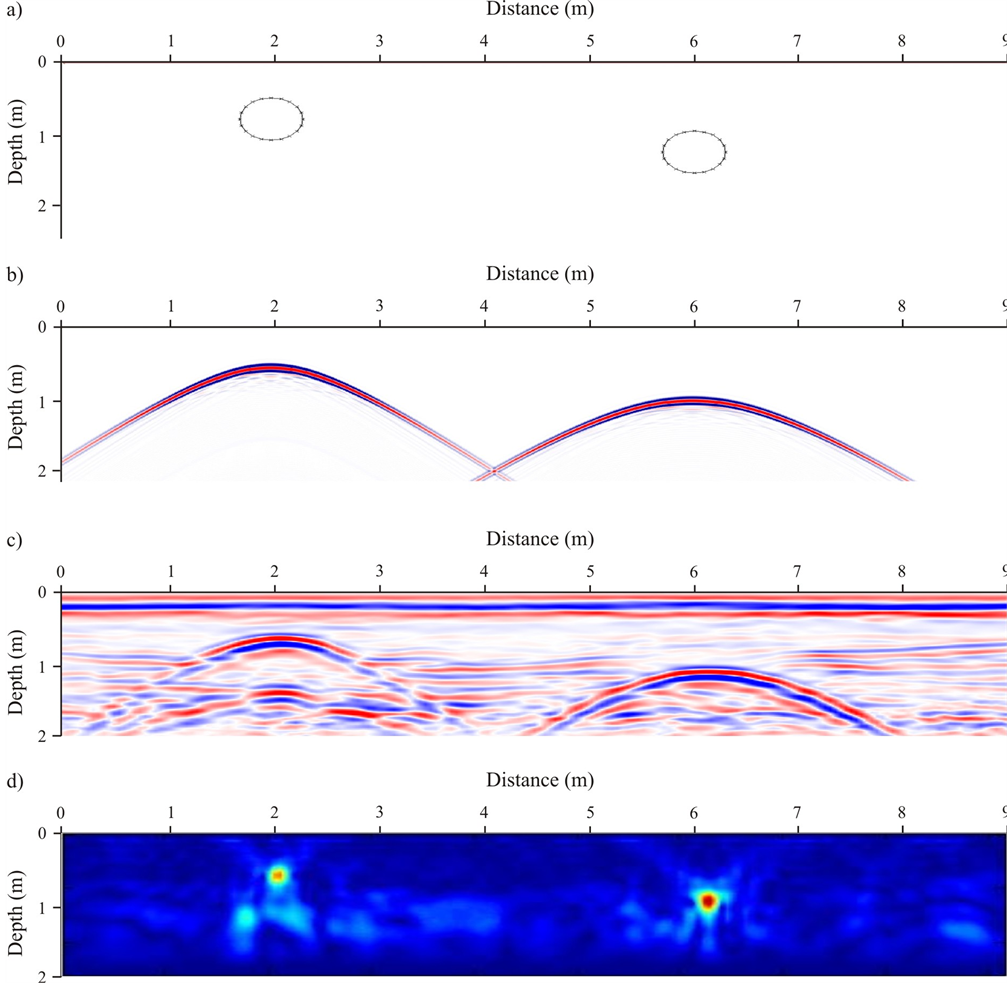
Figure 3. (a) Spatial distribution of two steel tanks empty buried in the horizontal position at IAG/USP test site. (b) GPR numerical modeling result for 200 MHz frequency perpendicular to the targets of Figure 3(a). (c) GPR result for 200 MHz frequency on the targets of Figure 3(a). (d) Microwave tomography result of Figure 3(c).
second one (5 m position) is filled with water. Figure 4(b) shows the result of GPR numerical modeling for 200 MHz frequency perpendicular to the targets of Figure 4(a). Observe that the empty plastic tank shows a strong reflector for the top with normal polarity. On the other hand, the plastic tank filled with water shows a weak reflector for its top characterized by the inverted polarity of GPR signal when compared with empty plastic tank and its bottom was clearly detected being characterized by a strong reflector.
Figure 4(c) presents GPR profile of 200 MHz on the targets of Figure 4(a). Note that the reflection pattern is different for empty and filled with water plastic tanks. The empty plastic tank is characterized by a strong hyperbolic reflector on the top. However, the plastic tank filled with water presents a weak reflection on the top and a strong reflection on its bottom. Observe that the real results are very similar to the numerical results.
Figure 4(d) presents the microwave tomography image for the Figure 4(c).
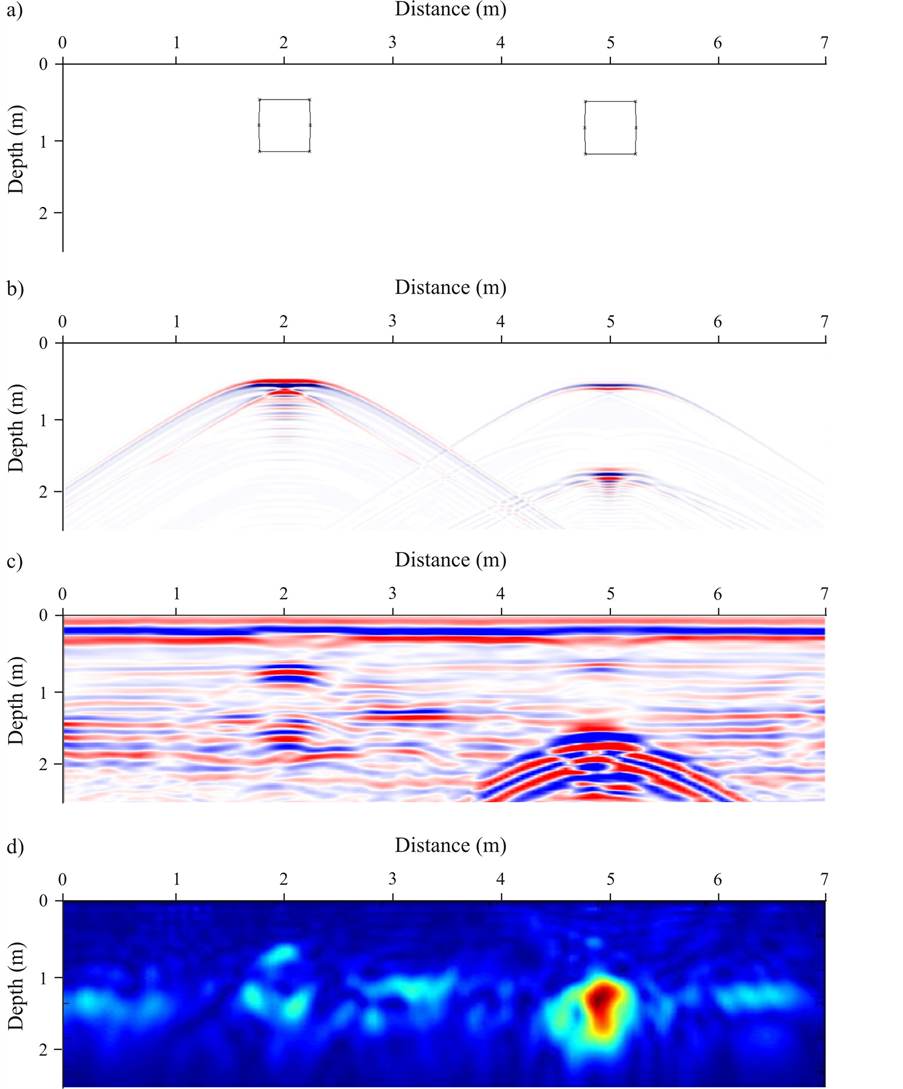
Figure 4. (a) Spatial distribution of two plastic tanks buried in the vertical position at IAG/USP test site. (b) GPR numerical modeling result for 200 MHz frequency perpendicular to the targets of Figure 4(a). (c) GPR result for 200 MHz frequency on the targets of Figure 4(a). (d) Microwave tomography result of Figure 4(c).
Observe that the top of the empty plastic tank (2 m position) appears as a weak anomaly, although it presents good amplitude. Some weak amplitude can be seen at 1.5 m in depth as well, corresponding to the bottom of the hole dug during the burial of this target. Microwave tomography also shows the anomaly referring to the plastic tank filled with water shifted for down in depth. This effect is caused by the strong reflection seen in real data. That anomaly is much stronger than the reflection at the top of this target. Some reverberation can be seen below this reflection as well, at the deepest part of the data. As a result, the microwave tomography recovers these anomalies as part of a single target but locates it at a deepest position. In this sense, the tomographic analysis must be done carefully in order to avoid a wrong interpretation.
The results show that GPR signatures of known targets are important to calibration of the results. They can be used as a reference guide for concrete tubes and steel/plastic tanks buried in subsoil, and contribute to our ability to interpret geophysical data.
5. Conclusions
The IAG/USP geophysical test site is pioneer in Brazil, and it was constructed at University of São Paulo campus for teaching and research purposes. Concrete tubes, steel/plastic tanks were buried to simulate urban problems, and environmental studies.
The numeric modeling allowed estimating the GPR results over concrete tubes and steel/plastic tanks and it presented a good accordance with real data reducing the ambiguity in the interpretation of results. The 200 MHz GPR profiles presented typically hyperbolic reflection pattern over concrete tubes, and steel/plastic tanks buried in subsoil. Vertical and horizontal concrete tubes, as well steel and plastic tanks showed different reflection patterns. The polarity inverted identified in the plastic tanks empty and filled with water can be considerate as a good indicative to interpret GPR data on target in subsoil with some type of fluid inside of the tanks.
The microwave tomography images improved the spatial positioning of the concrete tubes and steel tanks, and allowed estimating their geometries. Microwave tomography images for the empty plastic tank show weak anomalies compared to the filled with water tank, but its geometry could be estimated based on those anomalies. On the other hand, the water-filled tank presented a strong anomaly at its bottom, and this anomaly is recovered by the tomographic process as the top of the target. This is a limitation of the proposed methodology, thus the analysis must be done carefully to avoid misinterpretations.
The results under controlled conditions showed that the location and the characterization of buried utilities are important to the mapping of the shallow subsurface. Therefore, the GPR is recommended to be used before beginning geotechnical excavation allows avoiding the accidents during the installation of new targets in subsoil.
Acknowledgements
JLP acknowledges CNPq-Conselho Nacional de Desenvolvimento Científico e Tecnológico for providing research support (301692/2013-0 and 406653/ 2013-5), and FAPESP-Fundação de Amparo à Pesquisa no Estado de São Paulo for providing financial support for IAG/USP geophysical test site construction (2002/07509-1), both are Brazilian Research Agency. ERA thanks to FAPESP for the PhD scholarship (2011/21013-8 and 2013/12606-0). IAG/USP is also acknowledged for providing infrastructure support. We thank to Ernande Costa Santos, Marcelo Cesar Stangari and the students for helping in geophysical data acquisition.
Cite this paper
Porsani, J.L., Almeida, E.R., Poluha, B. and dos Santos, V.R.N. (2017) GPR Tomographic Imaging of Concrete Tubes and Steel/Plastic Tanks Buried in IAG/USP Geophysical Test Site, Brazil. International Journal of Geosciences, 8, 647-658. https://doi.org/10.4236/ijg.2017.85035
References
- 1. Ward, S.H. and Hohmann, G.W. (1987) Electromagnetic Theory for Geophysical Applications. In: Nabighian, M.N., Ed., Electromagnetic Methods in Applied Geophysics, Vol. 1, Society of Exploration Geophysicists, 131-311.
- 2. Daniels, D.J. (1996) Surface Penetrating Radar. The Institution of Electrical Engineers, London, UK, 300 p.
- 3. Porsani, J.L. (1999) Ground Penetrating Radar (GPR): Proposta metodológica de emprego em estudos geológico-geotécnicos nas regioes de Rio Claro e Descalvado-SP. Ph.D. Thesis, Universidade Estadual Paulista Júlio de Mesquita, Brazil.
- 4. Annan, A.P. (2003) Ground Penetrating Radar Principles, Procedures & Applications. Sensors & Software Inc., 286 p.
- 5. Daniels, D.J. (2004) Ground Penetrating Radar. IET, London, UK.
https://doi.org/10.1049/PBRA015E - 6. Daniels, D.J. (2007) Ground Penetrating Radar. IET Radar, Sonar, Navigation and Avionics Series 15, 2nd Edition, 726.
- 7. Jol, H.M. (2009) Ground Penetrating Radar: Theory and Applications. Elsevier, Amsterdam.
- 8. Daniels, J.J., Roberts, R. and Vendl, M. (1995) Ground Penetrating Radar for the Detection of Liquid Contaminants. Journal of Applied Geophysics, 33, 95-207.
- 9. Zeng, X. and McMechan, G.A. (1997) GPR Characterization of Buried Tanks and Pipes. Geophysics, 62, 797-806.
https://doi.org/10.1190/1.1444189 - 10. Grandjean, G., Gourry, J.C. and Bitri, A. (2000) Evaluation of GPR Techniques for Civil-Engineering Applications: Study on a Test Site. Journal of Applied Geophysics, 45, 141-156.
- 11. Paniagua, J., Del Rio, M. and Rufo, M. (2004) Test Site for the Analysis of Subsoil GPR Signal Propagation. Tenth International Conference on Ground Penetrating Radar (GPR’2004), Delft, The Netherlands, 21-24 June 2004.
- 12. Porsani, J.L., Borges, W.R., Rodrigues, S.I. and Hiodo, F.Y. (2006) O Sítio Controlado de Geofísica Rasa do IAG/USP: Instalacao e Resultados GPR 2D-3D. Revista Brasileira de Geofísica, 24, 49-61.
https://doi.org/10.1590/S0102-261X2006000100004 - 13. Rodrigues, S.I. and Porsani, J.L. (2006) Utilizacao do GPR para caracterizar tambores plásticos enterrados no sítio controlado de geofísica rasa do IAG/USP. Revista Brasileira de Geofísica, 24, 157-168.
https://doi.org/10.1590/s0102-261x2006000200001 - 14. Porsani, J.L. and Sauck, W.A. (2007) GPR Profiles over Multiple Steel Tanks: Artifact Removal through Effective Data Processing. Geophysics, 72, J77-J83.
https://doi.org/10.1190/1.2783412 - 15. Porsani, J.L., Slob, E., Lima, R.S. and Leite, D.N. (2010) Comparing Detection and Location Performance of Perpendicular and Parallel Broadside GPR Antenna Orientations. Journal of Applied Geophysics, 70, 1-8.
- 16. Santos, V.R.N., Al-Nuaimy, W., Porsani, J.L., Hirata, N.S.T. and Alzubi, H.S. (2014) Spectral Analysis of Ground Penetrating Radar Signals in Concrete, Metallic and Plastic Targets. Journal of Applied Geophysics, 100, 32-43.
- 17. Gerber, R., Henningsen, P.F., Salat, C. and Junge, A. (2004) Investigation of the GPR Reflection Pattern for Shallow Depths on a Test Site. Tenth International Conference on Ground Penetrating Radar (GPR’2004), Delft, The Netherlands, 21-24 June 2004.
- 18. Porsani, J.L., Borges, W.R., Elis, V.R., Diogo, L.A., Hiodo, F.Y., Marrano, A. and Birelli, C.A. (2004) Investigacoes geofísicas de superfície e de poco no sítio controlado de geofísica rasa do IAG-USP. Revista Brasileira de Geofísica, 22, 245-258.
https://doi.org/10.1590/S0102-261X2004000300004 - 19. Santos, V.R.N. (2014) Deteccao e classificacao automática de interferências no subsolo com GPR utilizando redes neurais artificiais (RNAs): Estudo no SCGR do IAG/USP. Ph.D. Thesis, Universidade de Sao Paulo, Brazil.
- 20. Almeida, E.R. (2016) Análise da tomografia de micro-ondas em dados GPR sob condicoes controladas: Aplicacoes em arqueologia e estudos forenses. Ph.D. Thesis, Universidade de Sao Paulo, Brazil.
- 21. Sandmeier, K.J. (2016) ReflexW Version 8.1. Program for Processing of Seismic, Acoustic or Electromagnetic Reflection, Refraction and Transmission Data. Software Manual, Karlsruhe, Germany, 628 p.
- 22. Yee, K.S. (1966) Numerical Solution of Initial Boundary Value Problems Involving Maxwell’s Equations in Isotropic Media. IEEE Transactions on Antennas and Propagation, 4, 302-307.
- 23. Radzevicius, S.J. and Daniels, J.J. (2000) Ground Penetrating Radar Polarization and Scattering from Cylinders. Journal of Applied Geophysics, 45, 111-125.
- 24. Leone, G. and Soldovieri, F. (2003) Analysis of the Distorted Born Approximation for Subsurface Reconstruction: Truncation and Uncertainties Effects. IEEE Transactions on Geoscience and Remote Sensing, 41, 66-74.
https://doi.org/10.1109/TGRS.2002.806999 - 25. Soldovieri, F., Hugenschmidt, J., Persico, R. and Leone, G. (2007) A Linear Inverse Scattering Algorithm for Realistic GPR Applications. Near Surface Geophysics, 5, 29-41.
https://doi.org/10.3997/1873-0604.2006016 - 26. Almeida, E.R., Porsani, J.L., Catapano, I., Gennarelli, G. and Soldovieri, F. (2016) Microwave Tomography-Enhanced GPR in Forensic Surveys: The Case Study of a Tropical Environment. IEEE Journal of Selected Topics in Applied Earth Observations and Remote Sensing, 9, 115-124.
https://doi.org/10.1109/JSTARS.2015.2466556 - 27. Almeida, E.R. and Porsani, J.L. (2017) RADIMAGE V1.0. Programa para processamento de dados GPR. Software registrado pelo Instituto Nacional da Propriedade Industrial do Brasil, Número do Registro: BR512016001778-3.