International Journal of Geosciences
Vol.06 No.11(2015), Article ID:61180,14 pages
10.4236/ijg.2015.611093
Contamination of Heavy Metals and Nutrients in Sediment, Sludge and Sewage of India
Shobhana Ramteke1, Khageshwar Singh Patel1*, Yogita Nayak1, Nitin Kumar Jaiswal2, Vikash Kumar Jain3, Laura Borgese4, Alessandra Gianoncelli4, Elza Bontempi4
1School of Studies in Chemistry/Environmental Science, Pt. Ravishankar Shukla University, Raipur, India
2Department of Chemistry, ITM University, Raipur, India
3Department of Chemistry, P.S.K. Government College, Dharsiva, India
4INSTM and Chemistry for Technologies Laboratory, University of Brescia, Brescia, Italy

Copyright © 2015 by authors and Scientific Research Publishing Inc.
This work is licensed under the Creative Commons Attribution International License (CC BY).
http://creativecommons.org/licenses/by/4.0/


Received 8 October 2015; accepted 14 November 2015; published 17 November 2015
ABSTRACT
The stagnant water bodies in India are sink for contaminant i.e. detergent, fertilizer, nutrients, heavy metal, pesticide, microbe, etc. The contamination and sources of elements i.e. Al, K, P, S, Cl, As, Ca, Sr, Ba, Ti, V, Cr, Mn, Fe, Ni, Cu, Zn and Pb in the sediment, sludge and sewage materials of the most industrialized cities of central India i.e. Raipur, Bhilai and Korba is described. The dominated metals i.e. Al, K, Ca, Ti, Fe and Mn in the geowaste materials (n = 20) contributed in the range of 4.8% - 36.3% with mean value of 10.2% ± 2.9%. The å4 concentration of nutrients i.e. P, K, S and Cl ranged from 1.2 - 12.5 g/kg with mean value of 7.9 ± 1.3 g/kg. The concentration of other heavy metals (HMs) i.e. As, V, Cr, Ni, Cu, Zn and Pb ranged from 12 - 105, 35 - 175, 88 - 392, 14 - 77, 32 - 185, 38 - 626 and 18 - 228 mg/kg with mean value of 644 ± 78, 83 ± 15, 182 ± 41, 44 ± 7, 68 ± 18, 199 ± 71 and 85 ± 25 mg/kg, respectively. The spatial and vertical distribution, enrichment and sources of the elements in the sediments are discussed.
Keywords:
Heavy Metal, Nutrients, Contamination, Sources, Sediment

1. Introduction
The sediment consists of soil, pebbles, silt, clay and other materials [1] . The bottom of oceans, rivers, streams, lakes, ponds and mudflats is made up of sediment. The problem of sediment contamination is increasing in many areas throughout the world [2] . Sediment is often a rich source of food for the living creatures in water. Many of the sediments in our rivers, lakes, and oceans have been contaminated by pollutants i.e. black carbon, heavy metals, polychlorinated biphenyls (PCBs), dioxins and organochlorine pesticides, etc. [3] - [8] . Many heavy metals (HMs) cause damage to the liver, kidneys, blood circulation, nerves, and may also be a trigger of cancer [9] [10] . The HMs contaminations were reported in sediments of major rivers of the world [11] - [20] . The sludge, sewage, litter, marine boat traffic, and runoff waters are all potential sources for the HMs contamination of sediments [21] - [30] . In the present work, the contamination of heavy metals (i.e. As, V, Cr, Mn, Fe, Ni, Cu, Zn and Pb) and nutrients (i.e. P, K, S and Cl) in the sediment, sludge and sewage of Raipur, central India is described.
2. Materials and Methods
2.1. Study Area
Three most industrial cities of Chhattisgarh state namely: Raipur (21˚23'N, 81˚63'E), Bhilai (21˚18'N, 81˚28'E) and Korba (22˚21'N, 82˚40'E) were selected for the proposed investigation. Raipur is the capital city of the Chhattisgarh state, India with population of ≈2.0 million. The Raipur city and its neighborhood are now becoming an important regional commercial and industrial destination for the coal, power, steel and aluminum industries. Raipur is one of biggest iron and cement market in the country. Bhilai is the second-largest city inclusive of Durg city in Chhattisgarh with population of »1 million, and is located in the west of Raipur ≈ 22 km away. The town is famous for the operation of one of the largest steel plant in the World (capacity: 3.15 MT/Yr). Korba is another city in Chhattisgarh with ≈0.5 million population, famous for power supply and aluminum plant.
2.2. Sample Collection
The samples were collected using a stainless-steel scoop in the summer, 2012 from 20 locations of industrial area of Chhattisgarh, Figure 1. The sediment samples were collected from 18 ponds of cities: Bhilai, Raipur and Korba. The sludge and sewage were collected from the industrial site (i.e. Siltara) of Raipur city. They were kept in glass bottle (250 mL) and dried at 30˚C in an oven for overnight. The samples were crushed into fine particles by mortar and sieved out the particles of mesh size < 0.1 mm. The samples were stored in aluminum foil.
2.3. Analysis
A 5.0 g of the sample was extracted with 25 mL distilled water for 12 hr. The extract was decanted out for the pH value measurement. The CHNSO-IRMS Analyzer by SV Instruments Analytica Pvt. Ltd. was used for quantification of the total carbon (TC). The total carbon (TC = BC + OC + CC) in the soil sample was oxidized at 1020˚C with O2 in constant helium flow stream by detecting the resulting CO2 gas with a thermal conductivity detector. The H3PO4 (10 drops) treated soil sample was oxidized with O2 at 1020˚C in a similar way for determination of BC and OC contents. The OC was analyzed by titration method using K2Cr2O7 as oxidant [31] . The CC content in the soil was evaluated by subtracting the BC and OC content to the TC.
The Bruker S2-Picofox TXRF portable spectrometer equipped with poly capillary lens and the X-ray beam was used for the characterization of elements in the sediment samples. A suspended solution was prepared by mixing sample (10 mg) with solution (10 mL) containing triton 1% (w/v) and Ga 10 µg/mL in ultrasonic bath for 15 min. A 10 μL of sample solution was sprayed on the quartz filter by subsequent drying. The X-ray source was focused on the filter for quantification of the elements. The peak area of the signal was computed. Three replicate measurements for each sample were carried out. The content of 18 elements (i.e. Cl, S, P, K, Al, Ca, Sr, Ba, As, Ti, V, Cr, Mn, Fe, Ni, Cu, Zn and Pb) in each sample was analyzed.
2.4. Pollution Indices
The enrichment factor (Ef) was used to determine metal contamination in the geowaste materials with respect to the base line concentration. The concentration ratio of an element, X, to a crustal element (e.g. Al) in the soil sample to the  ratio in the earth’s crust was normalised by using following indices [32] [33] .
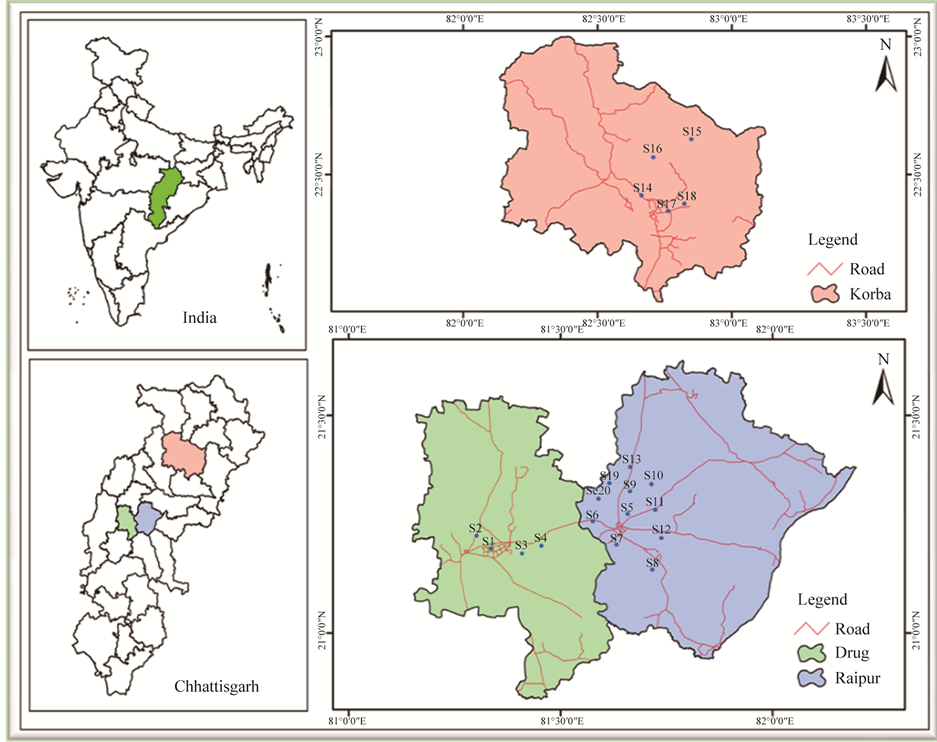
Figure 1. Representation of sampling locations in Raipur, Bhilai and Korba city, India.

where, symbols: Xs, Xe, Als and Ale denote concentration of metal and Al in the soil and earth crust, respectively.
3. Results and Discussion
3.1. pH of Extract
The color of sediments was varied from reddish (R) to black (B) due to deposition of the BC, metal oxides and organic resides. The pH value of the extract (n = 20) was ranged from 6.2 - 8.2 with mean value of 7.4 ± 0.3. The lower pH values of the SeK, SlR and SwR was observed due to presence of higher content of chlorine and sulfur, Figure 2.
3.2. Carbon Content
The carbon content of the geowaste materials is presented in Table 1. The concentration of BC, OC and CC was ranged from 4.87 - 9.62, 0.07 - 0.32 and 0.05% - 0.17% with mean value of 8.12 ± 0.57, 0.15 ± 0.02 and 0.11% ± 0.01%, respectively. They were found to correlate well (r = 0.72), indicating origin from the similar sources i.e. burning processes. The comparable content of the BC and CC in all types of waste materials were marked, Figure 3. The significantly higher content of OC in the sewage was seen due to input by the organic waste, Figure 3. The BC content in the sediment of the studied area was observed to be higher than in of other regions, probably due to huge coal burning in this region [34] - [36] .
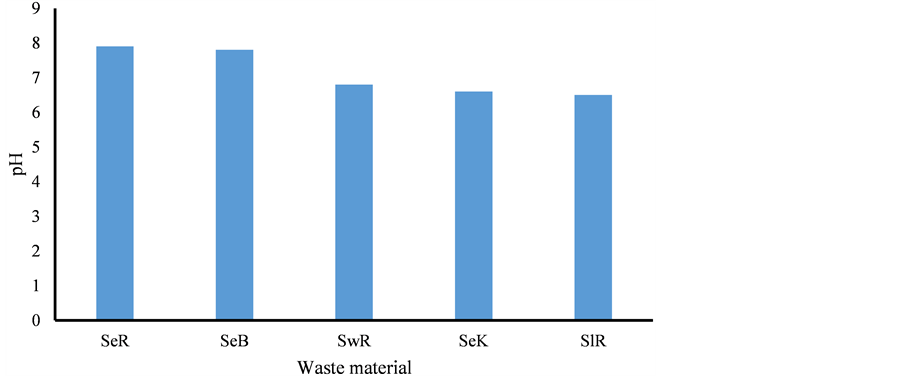
Figure 2. pH variation of sediment, sludge and sewage, Se = Sediment, Sl = Sludge, Sw = Sewage, R = Raipur, B = Bhilai, K = Korba.

Table 1. Acidity and carbon content of waste materials.
Se = Sediment, Sl = Sludge, Sw = Sewage, B = Black, DB = Deep back, LB = Light black, R = Reddish.
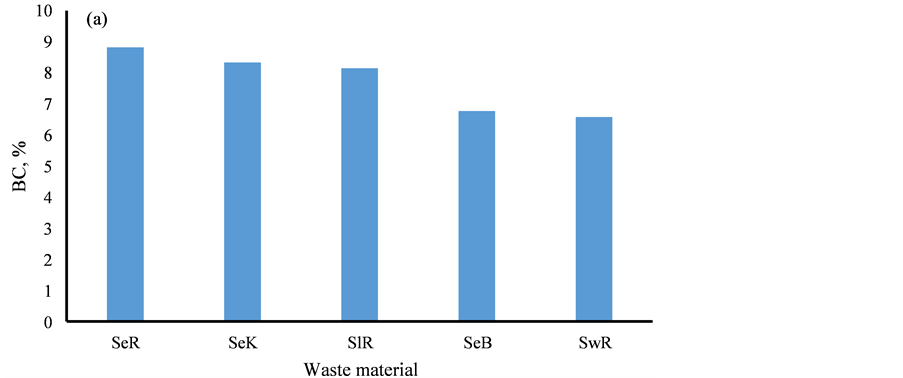
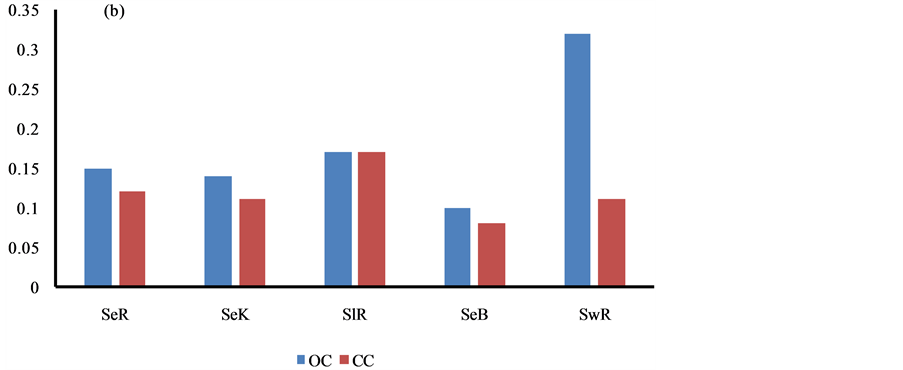
Figure 3. Spatial variations of carbon contents in sediment, sludge and sewage.
3.3. Content of Heavy Metals and Nutrients
The elevated concentration of metals i.e. Al, K, Ca, Ti, Fe and Mn in the geowaste materials was observed, ranging (n = 20) from 4864 - 18806, 593 - 11179, 579 - 72184, 2135 - 8121, 9737 - 319848 and 127 - 25614 mg/kg with mean value of 11088 ± 1851, 6874 ± 1304, 18268 ± 9468, 4116 ± 671, 73262 ± 34589 and 2782 ± 2484 mg/kg, respectively, Table 2. Among them, the highest Fe content was observed in all geowaste materials due to roasting of iron ores and huge coal burning in the studied areas. The concentration of P, S, Cl, As, Sr, Ba, V, Cr, Ni, Cu, Zn and Pb was marked in the sediments at traces, ranging from 95 - 584, 91 - 1822, 31 - 1117, 12 - 105, 40 - 135, 478 - 1078, 35 - 175, 88 - 392, 14 - 77, 32 - 185, 38 - 626 and 18 - 228 mg/kg with mean value of 232 ± 63, 604 ± 240, 231 ± 119, 39 ± 14, 79 ± 12, 644 ± 78, 83 ± 15, 182 ± 41, 44 ± 7, 68 ± 18, 199 ± 71 and 85 ± 25 mg/kg, respectively, Table 2.
The higher content of elements i.e. P, S, Ca, Ba, Cr, Fe, Cu and Pb was observed in the sediment of Bhilai city, due to input by the Steel plant effluents, Figure 4. Similarly, higher content of other eight elements i.e. Al, K, As, Sr, Ti, V, Ni and Zn was marked in Korba city due to huge coal burning by the Thermal power plants, Figure 4.
The content of elements i.e. Al, As, Ni, Cu, V, Ti and K was increased as the depth profile of the sediment was increased from 0 to 30 cm, may be due to their less binding with the organic materials, Figure 5. The reverse trend was marked with other elements i.e. Cl, S, Ca, Ba, Sr, Cr, Mn, Fe, Zn and Pb, may be due to higher adsorption with the organic materials, Figure 5.
The content of HMs and nutrient in the sediment, sludge and sewage wastes of Raipur city is presented in
(a) (b)
Table 2. (a) Concentration of element in waste materials, mg/kg; (b) Concentration of element in waste materials, mg/kg.
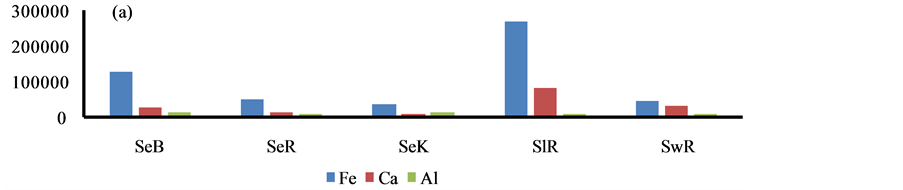
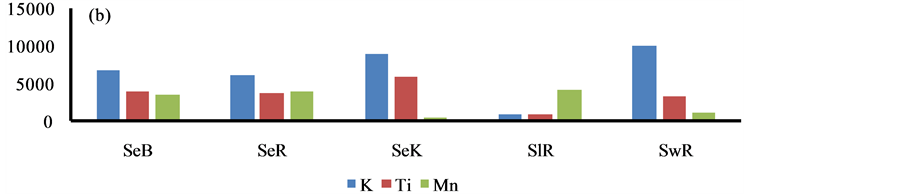
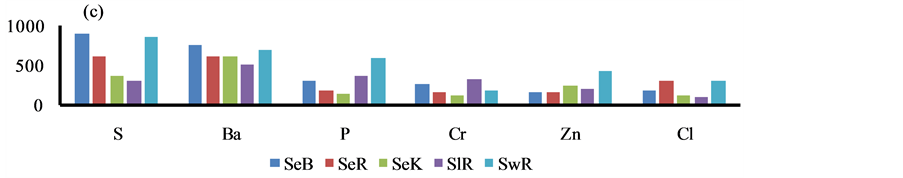
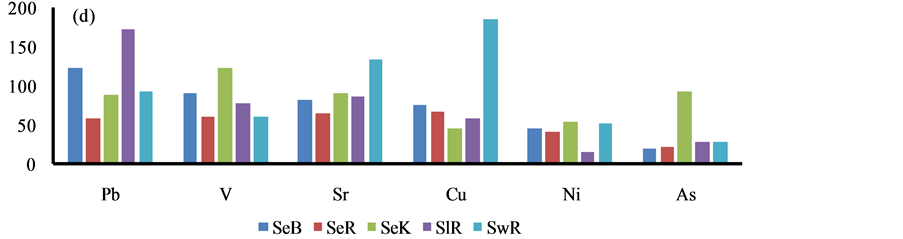
Figure 4. Spatial distribution of elements in the geowaste materials.
Figure 6. Sludge is a solid waste material produced by the iron and thermal power plants in the studied area. Sewage is also a solid waste contributed by domestic households, industrial and agricultural wastes. The highest content of Fe and Ca was marked in the sludge waste. The sewage waste was found to be very rich (1.2%) in nutrient (i.e. P + K + Cl + S) levels. However, the higher content of HMs (i.e. As + Ti + V + Cr + Mn + Ni + Cu + Zn + Pb) was seen in the sediment. The concentration of HMs i.e. Fe, Mn, As and Pb in the sediment of the study area was found to be higher than sediments of other regions due to a huge mineral and coal roasting [11] - [30] .
3.4. Enrichment of Elements
The Ef values of the elements are summarized in Table 3. The background concentration of Al, Fe, K, Ca, Ti, Mn, P, S, Cl, V, Cr, Zn, Ni, Cu, Pb and As reported was 82000, 39000, 23000, 22000, 4650, 775, 62, 655, 370, 97, 92, 67, 47, 28, 17 and 4.8 mg/kg, respectively [37] . Two metals i.e. As and Pb was found to be highly enriched (Ef > 27) in all samples. The highest Ef value for elements i.e. S, Cl, Cu and Zn was seen in the sewage waste, may be due to contribution by vehicle and cooking effluents. The extremely high Ef value of Fe, Mn, Cr and Ca was observed in the sludge waste due to input of the sponge iron and thermal power plant effluents.
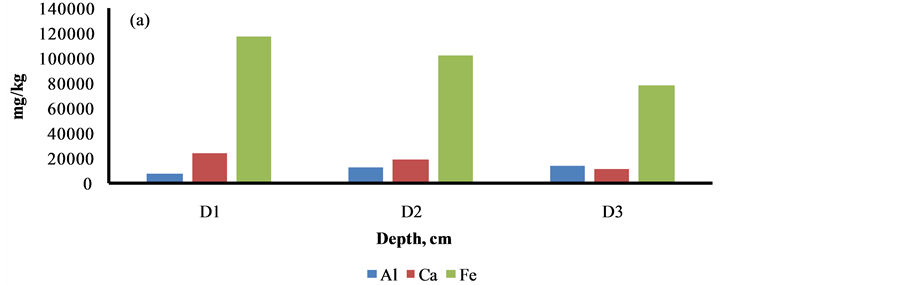
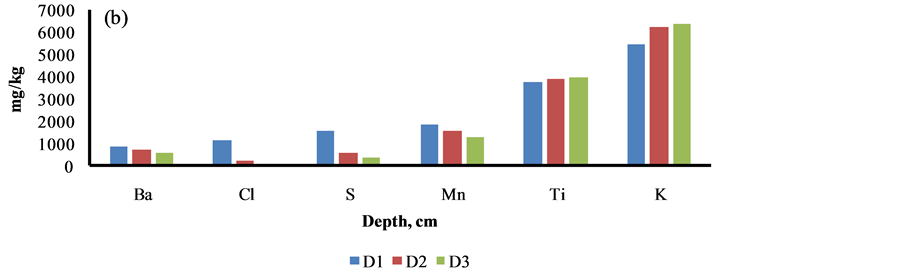
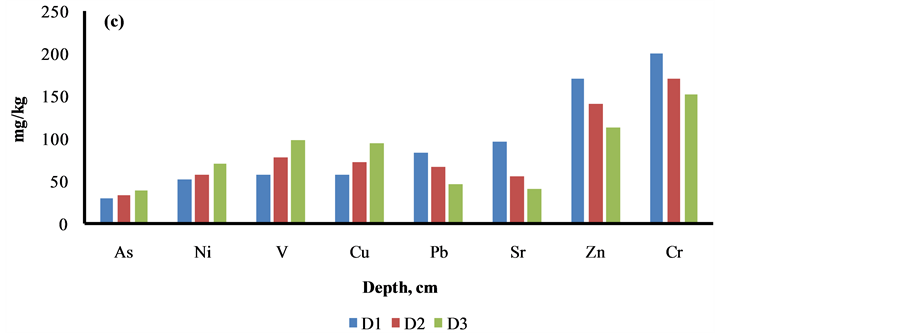
Figure 5. Depth profile studies of elements in Siltara sediment. D1 = 0 - 10 cm, D2 = 10 - 20 cm, D3 = 20 - 30 cm.
3.5. Composition of Geowaste Materials
The elemental and carbon fractions in the sediment, sludge and sewage are shown in Figure 7. The fraction of 18 elements (i.e. Al, K, P, S, Cl, As, Ca, Sr, Ba, Ti, V, Cr, Mn, Fe, Ni, Cu, Zn and Pb), BC, OC and CC in all sediment and sewage wastes was found comparable. However, two metals i.e. Ca and Fe were enriched several folds higher in the sludge due to sponge iron and their effluents.
3.6. Sources of Elements
Cluster analysis was performed on the dataset by Ward’s method using Euclidean distance as similarity measure. The variables were interrelated to each other according their maximum similarities. First, the interrelation takes place between two variables which have the most similarity and the next repetition other similar pair clusters were related together. Four clusters or class of sample sites were identified with distinct cluster centers (Figure 8).
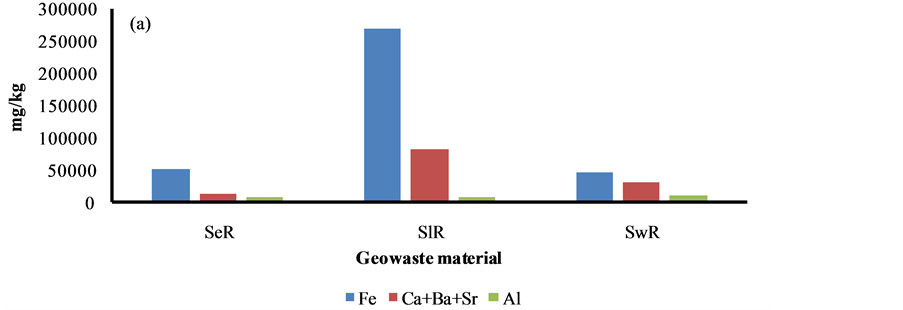
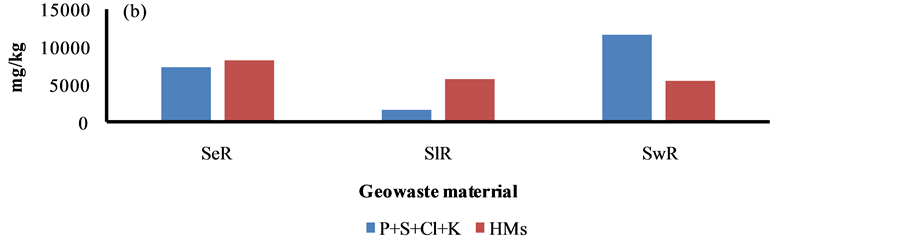
Figure 6. Distribution of HMs and nutrients in sediment, sludge and sewage at Raipur.
Table 3. Enrichment of elements.
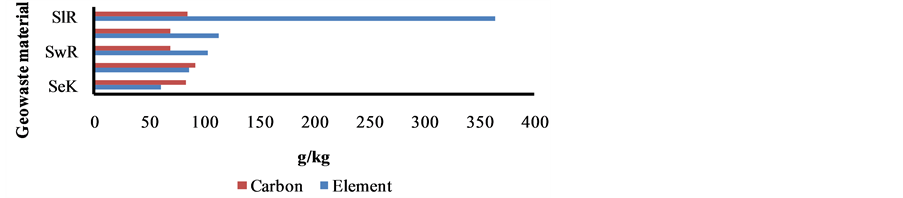
Figure 7. Fraction of element and carbon in sediment, sludge and sewage of Raipur.
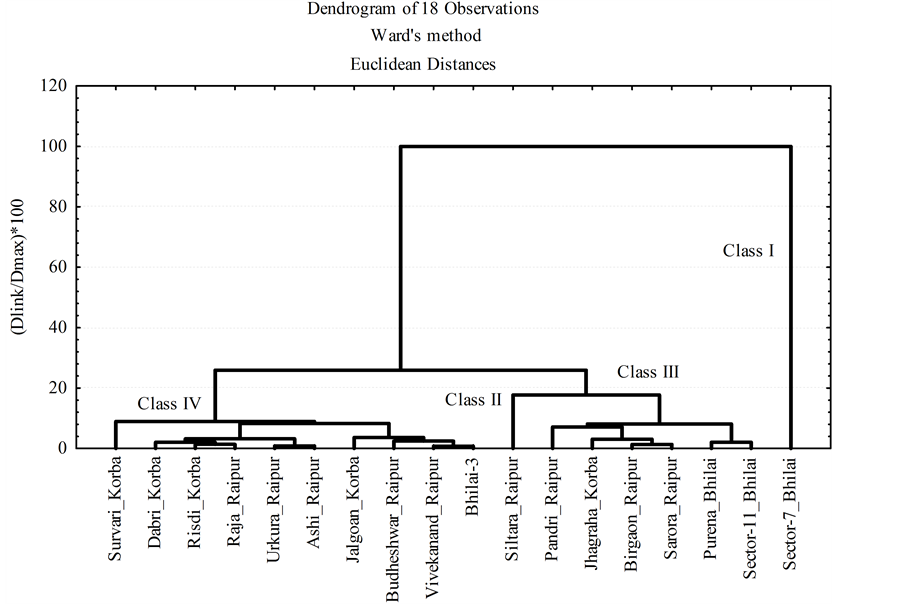
Figure 8. Dendrogram of eighteen sediment observations.
Class-I (n = 1) and Class-II (n = 1) comprise each one 5.56% of the total samples. Class I has the highest concentration of P, Ca and heavy metals (Cu, Cr, Mn, Fe, Zn and Pb). Class-II has the highest concentrations of OC, CC, S, Cl, Ni, As, Sr and Ba. Class-III (n = 6) comprises 33.33% of the total samples and has the highest concentration of Al, Ti and V. Class-IV (n = 10) has the highest concentration of K and lower or intermediate concentration of other elements between the class. On the whole, the concentrations of elements exceed highly their respective limit concentrations. The results of k-means clustering of the sediments in all the samples are shown in Table 4.
Using factor analysis (FA), linear correlation between heavy metal concentrations in the sediments was determined. After varimax rotation, heavy metals belonging to a given factor were defined by factor matrix. Metals having strong correlation were grouped into factors and the identification of factors is based on dominant influence [38] . Six factors with eigenvalues higher than 1 [39] were extracted by principal component method. These factors explained 86.56% of the total variance. The variable loadings, eigenvalues, explained variance and cumulative variance are presented in Table 5.
Factor-1 exhibit 34.31% of the total variance with high positive loadings on Mn (0.86), Cu (0.86), Zn (0.80) and Sr (0.81). This factor indicates strong association of Mn, Cu, Zn and Sr in the sediments. Factor-2 exhibit 19% of the total variance with high negative loadings on BC (−0.94), OC (−0.94) and CC (−0.89). This suggests that
Table 4. Results of the k-means hierarchical cluster analysis.
BC, OC and CC proceed from the same source. Factor-3 accounts for 12.14% of the total variance with high positive loadings on Ca (0.85), Cr (0.82) and Fe (0.91). Taking account of some high concentrations in Fe, Ca this factor can be attributed to mixed sources of Fe in the sediments from geogenic and anthropogenic source.
Factor-4 accounts for 9.04% of the total variance with high positive loading on Cl (0.73). High concentrations of Cl in the sediments could come from runoff, wastewater. Factor 5 accounts for 6.53% of the total variance with high negative loadings on Al (−0.73), V (−0.82) and Ti (−0.80). This factor shows the relationship of anthropogenic Ti and V with reference element Al. Factor 6 accounts for 5.55% of the total variance with high negative loading on pH (−0.87).
4. Conclusion
The geowaste materials i.e. sediment, sludge and sewage are rich with heavy metal and nutrient contents. The remarkably higher nutrient level is observed in the sewage, found useful as manure for crop productions. Iron is seen to be extremely enriched up to 27% in the sludge waste, and could be a cheaper resource for Fe recovery. The high BC levels in geomaterials may stabilize the heavy metal and nutrient contents. The toxic metals i.e. As and Pb were highly enriched (Ef > 27) in all geowaste materials. The vertical distribution of As was increased remarkably with increasing depth profile of the sediment.
Table 5. Rotated varimax factor of chemical constituents.
Significant loadings > 0.7 (in bold) at p < 0.05.
Acknowledgements
We are thankful to the Italian Ministry of Education, Rome for granting the research project to Prof. E. Bontempi for the collaborative work.
Cite this paper
Shobhana Ramteke,Khageshwar Singh Patel,Yogita Nayak,Nitin Kumar Jaiswal,Vikash Kumar Jain,Laura Borgese,Alessandra Gianoncelli,Elza Bontempi, (2015) Contamination of Heavy Metals and Nutrients in Sediment, Sludge and Sewage of India. International Journal of Geosciences,06,1179-1192. doi: 10.4236/ijg.2015.611093
References
- 1. Gary, N. (1999) Sedimentology & Stratigraphy. Wiley-Blackwell, Malden.
http://www.igc.usp.br/pessoais/renatoalmeida/Bibliografias/Sedimentology%20and%20Stratigraphy%20 Nichols2009.pdf - 2. Tarek, A.K. and Damià, B. (2009) Contaminated Sediments. Springer, New York.
http://www.jlakes.org/config/hpkx/news_category/2015-06-03/ContaminatedSediments-2009.pdf - 3. Selvaraj, K., Ram Mohan, V. and Szefer, P. (2004) Evaluation of Metal Contamination in Coastal Sediments of the Bay of Bengal, India: Geochemical and Statistical Approaches. Marine Pollution Bulletin, 49, 174-185. http://dx.doi.org/10.1016/j.marpolbul.2004.02.006
- 4. Bhattacharya, B., Sarkar, S.K. and Mukherjee, N. (2003) Organochlorine Pesticide Residues in Sediments of a Tropical Mangrove Estuary, India: Implications for Monitoring. Environmental International, 29, 587-592. http://dx.doi.org/10.1016/S0160-4120(03)00016-3
- 5. Muri, G., Wakeham, S.G. and Faganeli, J. (2003) Polycyclic Aromatic Hydrocarbons and Black Carbon in Sediments of a Remote Alpine Lake (Lake Planina, Northwest Slovenia). Environmental Toxicology and Chemistry, 22, 1009-1016. http://dx.doi.org/10.1002/etc.5620220508
- 6. Muri, G., Cermelj, B., Faganeli, J. and Brancelj, A. (2002) Black Carbon in Slovenian Alpine Lacustrine Sediments. Chemosphere, 46, 1225-1234. http://dx.doi.org/10.1016/S0045-6535(01)00295-8
- 7. Nemr, A.E., Said, T.O., Khaled, A., El-Sikaily, A. and Abd-Allah, A.M.A. (2007) The Distribution and Sources of Polycyclic Aromatic Hydrocarbons in Surface Sediments along the Egyptian Mediterranean Coast. Environmental Monitoring and Assessment, 124, 343-359. http://dx.doi.org/10.1007/s10661-006-9231-8
- 8. Vane, C.H., Harrison, I. and Kim, A.W. (2007) Polycyclic Aromatic Hydrocarbons (PAHs) and Polychlorinated Biphenyls (PCBs) in Sediments from the Mersey Estuary, U.K. Science of the Total Environment, 374, 112-126. http://dx.doi.org/10.1016/j.scitotenv.2006.12.036
- 9. Yin, H., Deng, J., Shao, S., Gao, F., Gao, J. and Fan, C. (2011) Distribution Characteristics and Toxicity Assessment of Heavy Metals in the Sediments of Lake Chaohu, China. Environmental Monitoring and Assessment, 179, 431-442. http://dx.doi.org/10.1007/s10661-010-1746-3
- 10. Fu, J., Hu, X., Tao, X., Yu, H. and Zhang, X. (2013) Risk and Toxicity Assessments of Heavy Metals in Sediments and Fishes from the Yangtze River and Taihu Lake, China. Chemosphere, 93, 1887-1895. http://dx.doi.org/10.1016/j.chemosphere.2013.06.061
- 11. Varol, M. and Sen, B. (2012) Assessment of Nutrient and Heavy Metal Contamination in Surface Water and Sediments of the Upper Tigris River, Turkey. CATENA, 92, 1-10.
http://dx.doi.org/10.1016/j.catena.2011.11.011 - 12. Varol, M. (2011) Assessment of Heavy Metal Contamination in Sediments of the Tigris River (Turkey) Using Pollution Indices and Multivariate Statistical Techniques. Journal of Hazardous Materials, 195, 355-364. http://dx.doi.org/10.1016/j.jhazmat.2011.08.051
- 13. Xia, P., Meng, X., Yin, P., Cao, Z. and Wang, X. (2011) Eighty-Year Sedimentary Record of Heavy Metal Inputs in the Intertidal Sediments from the Nanliu River Estuary, Beibu Gulf of South China Sea. Environmental Pollution, 159, 92-99. http://dx.doi.org/10.1016/j.envpol.2010.09.014
- 14. Buccolieri, A., Buccolieri, G., Cardellicchio, N., Dell’Atti, A. and Leo, A.D. (2006) Heavy Metals in Marine Sediments of Taranto Gulf (Ionian Sea, Southern Italy). Marine Chemistry, 99, 227-235.
http://dx.doi.org/10.1016/j.marchem.2005.09.009 - 15. Wu, S.H., Zhou, S.L. and Li, X.G. (2011) Determining the Anthropogenic Contribution of Heavy Metal Accumulations around a Typical Industrial Town: Xushe, China. Journal of Geochemical Exploration, 110, 92-97. http://dx.doi.org/10.1016/j.gexplo.2011.04.002
- 16. Ip, C.C.M., Li, X.D., Zhang, G., Wai, O.W.H. and Li, Y.S. (2007) Trace Metal Distribution in Sediments of the Pearl River Estuary and the Surrounding Coastal Area, South China. Environmental Pollution, 147, 311-323. http://dx.doi.org/10.1016/j.envpol.2006.06.028
- 17. Suthar, S., Nema, A.K., Chabukdhara, M. and Gupta, S.K. (2009) Assessment of Metals in Water and Sediments of Hindon River, India: Impact of Industrial and Urban Discharges. Journal of Hazardous Materials, 171, 1088-1095. http://dx.doi.org/10.1016/j.jhazmat.2009.06.109
- 18. Fang, T.H., Li, J.Y., Feng, H.M. and Chen, H.Y. (2009) Distribution and Contamination of Trace Metals in Surface Sediments of the East China Sea. Marine Environmental Research, 68, 178-187.
http://dx.doi.org/10.1016/j.marenvres.2009.06.005 - 19. Zhang, Y.F., Wang, L.J., Huo, C.L. and Guan, D.M. (2008) Assessment on Heavy Metals Pollution in Surface Sediments in Jinzhou Bay. Marine Environmental Science, 2, 178-181.
- 20. Wagemann, R., Snow, N.B., Rosenberg, D.M. and Lutz, A. (1978) Arsenic in Sediments, Water and Aquatic Biota from Lakes in the Vicinity of Yellowknife, Northwest Territories, Canada. Archives of Environmental Contamination and Toxicology, 7, 169-191. http://dx.doi.org/10.1007/BF02332047
- 21. Leal-Acosta, M.L., Shumilin, E., Mirlean, N., Sapozhnikov, D. and Gordeev, V. (2010) Arsenic and Mercury Contamination of Sediments of Geothermal Springs, Mangrove Lagoon and the Santispac Bight, Bahía Concepción, Baja California Peninsula. Bulletin of Environmental Contamination and Toxicology, 85, 609-613. http://dx.doi.org/10.1007/s00128-010-0135-5
- 22. Al-Musharafi, S.K., Mahmoud, I.Y. and Al-Bahry, S.N. (2014) Environmental Contamination by Industrial Effluents and Sludge Relative to Heavy Metals. Journal of Geoscience and Environment Protection, 2, 14-18. http://dx.doi.org/10.4236/gep.2014.22003
- 23. Fuentes, A., Lloréns, M., Sáez, J., Isabel Aguilar, M., Pérez-Marí, A.B., Ortu?o, J.F. and Victor Meseguer, V.F. (2006) Ecotoxicity, Phytotoxicity and Extractability of Heavy Metals from Different Stabilised Sewage Sludges. Environmental Pollution, 143, 355-360. http://dx.doi.org/10.1016/j.envpol.2005.11.035
- 24. García-Delgado, M., Rodríguez-Cruz, M.S., Lorenzo, L.F., Arienzo, M. and Sánchez-Martín, M.J. (2007) Seasonal and Time Variability of Heavy Metal Content and of Its Chemical Forms in Sewage Sludges from different Wastewater Treatment Plants. Science of the Total Environment, 382, 82-92.
http://dx.doi.org/10.1016/j.scitotenv.2007.04.009 - 25. Wong, J.W.C., Li, K., Fang, M. and Su, D.C. (2001) Toxicity Evaluation of Sewage Sludge in Hong Kong. Environment International, 27, 373-380. http://dx.doi.org/10.1016/S0160-4120(01)00088-5
- 26. Scancar, J., Milacic, R., Stracar, M. and Burica, O. (2000) Total Metal Concentrations and Partitioning of Cd, Cr, Cu, Fe, Ni and Zn in Sewage Sludge. Science of the Total Environment, 250, 9-19.
http://dx.doi.org/10.1016/S0048-9697(99)00478-7 - 27. Smith, S.R. (2009) A Critical Review of the Bioavailability and Impacts of Heavy Metals in Municipal Solid Waste Composts Compared to Sewage Sludge. Environment International, 35, 142-156.
http://dx.doi.org/10.1016/j.envint.2008.06.009 - 28. Wang, C., Li, X.C., Ma, H.T., Qian, J. and Zhai, J.B. (2006) Distribution of Extractable Fractions of Heavy Metals in Sludge during the Wastewater Treatment Process. Journal of Hazardous Materials, 137, 1277-1283. http://dx.doi.org/10.1016/j.jhazmat.2006.04.026
- 29. Amir, S., Hafidi, M., Merlina, G. and Revel, J.C. (2005) Sequential Extraction of Heavy Metals during Composting of Sewage Sludge. Chemosphere, 59, 801-810.
http://dx.doi.org/10.1016/j.chemosphere.2004.11.016 - 30. Wang, C., Hu, X., Chen, M.L. and Wu, Y.H. (2005) Total Concentrations and Fractions of Cd, Cr, Pb, Cu, Ni and Zn in Sewage Sludge from Municipal and Industrial Wastewater Treatment Plants. Journal of Hazardous Materials, 119, 245-249. http://dx.doi.org/10.1016/j.jhazmat.2004.11.023
- 31. Chen, M., Li, X.M., Yang, Q., Zeng, G.M., Zhang, Y., Liao, D.X., Liu, J.J., Hu, J.M. and Guo, L. (2008) Total Concentrations and Speciation of Heavy Metals in Municipal Sludge from Changsha, Zhuzhou and Xiangtan in Middle-South Region of China. Journal of Hazardous Materials, 160, 324-329.
http://dx.doi.org/10.1016/j.jhazmat.2008.03.036 - 32. Walkley, A. and Black, I.A.(1934) An Examination of the Degtjareff Method for Determining Soil Organic Matter and a Proposed Modification of the Chromic Acid Titration Method. Soil Science, 37, 29-38. http://dx.doi.org/10.1097/00010694-193401000-00003
- 33. Sinex, S.A. and Helz, G.R. (1981) Regional Geochemistry of Trace Elements in Chesapeake Bay Sediments. Environmental Geology, 3, 315-323. http://dx.doi.org/10.1007/BF02473521
- 34. Caeiro, S., Costa, M.H., Ramos, T.B., Fernandes, F., Silveira, N., Coimbra, A., Medeiros, G. and Painho, M. (2005) Assessing Heavy Metal Contamination in Sado Estuary Sediment: An Index Analysis Approach. Ecological Indicators, 5, 151-169. http://dx.doi.org/10.1016/j.ecolind.2005.02.001
- 35. Hung, C.C., Gong, G.C., Jiann, K.T., Yeager, K.M., Santschi, P.H., Wade, T.L., Sericano, J.L. and Hsieh, H.L. (2006) Relationship between Carbonaceous Materials and Polychlorinated Biphenyls (PCBs) in the Sediments of the Danshui River and adjacent Coastal Areas, Taiwan. Chemosphere, 65, 1452-1461. http://dx.doi.org/10.1016/j.chemosphere.2006.04.037
- 36. Kang, Y., Wang, X., Dai, M., Feng, H., Li, A. and Song, Q. (2009) Black Carbon and Polycyclic Aromatic Hydrocarbons (PAHs) in Surface Sediments of China’s Marginal Seas. Chinese Journal of Oceanology and Limnology, 27, 297-308. http://dx.doi.org/10.1007/s00343-009-9151-x
- 37. Rudnick, R.L. and Gao, S. (2003) Composition of the Continental Crust. In: Holland, H.D. and K.K. Turekian, Eds., The Crust, Treatise on Geochemistry, Vol. 3, Elsevier-Pergamum, Oxford, 1-64.
http://dx.doi.org/10.1016/B0-08-043751-6/03016-4 - 38. Krishna, A., Satyanarayanan, K. and Govil, P.K. (2009) Assessment of Heavy Metal Pollution Using Multivariate Statistical Techniques in an Industrial Area: A Case Study from Patancheru, Medak District, Andhra Pradesh. India Journal of hazardous Materials, 167, 366-373.
http://dx.doi.org/10.1016/j.jhazmat.2008.12.131 - 39. Kaiser, H.F. (1958) The Varimax Criteria for Analytical Rotation in Factor Analysis. Psychometrika, 23, 187-200.
http://econpapers.repec.org/scripts/redir.pf?u=http%3A%2F%2Fhdl.handle.net%2F10.1007%2FBF02289 233;h=repec:spr:psycho:v:23:y:1958:i:3:p:187-200
http://dx.doi.org/10.1007/BF02289233
NOTES

*Corresponding author.