Soft
Vol. 2 No. 1 (2013) , Article ID: 29505 , 6 pages DOI:10.4236/soft.2013.21001
Potential Correlation between Spontaneous Emulsification and the Plait Point in the System Water/Benzene/Ethanol: A Phase Diagram Approach
Ugelstad Laboratory, Norwegian University of Science and Technology, Trondheim, Norway
Email: stic30kan@gmail.com
Received January 15, 2013; revised February 19, 2013; accepted March 12, 2013
Keywords: Emulsions; Spontaneous Emulsification; Phase Diagrams; Plait Point
ABSTRACT
The separation of phases after the stability composition at a plait point is exceeded has significant effect on the reactions during spontaneous emulsification, but experimental efforts to obtain accurate information are extremely difficult, because even the smallest scattering of the numbers has a large effect on the result. In the present contribution a model system was applied that closely mirrored experimental values and the mass ratio of the two phases could be calculated with high accuracy. Extrapolation of the ratio between phase masses towards the critical composition showed the two phase masses each close to 0.5, while a composition with a miniscule difference from this composition extrapolated to 1.0. The results showed spontaneous emulsification between solutions at the plait point and water to consist of two processes; an initial extremely fast reaction and a slower process between the aqueous phase formed in the primary emulsification and water.
1. Introduction
The criterion for achieving spontaneous emulsification is that sufficient internal excess energy exists to compensate for the energy to form the emulsion. The first publication in the area [1] listed the reaction energy from an interfacial neutralization as the source of energy and later treatments added negative interfacial energy, interface destabilization and “diffusion and stranding” as early reviewed by Davies and Rideal [2] as well as Salager [3] and several aspects were covered of these approaches [4,5]. A fundamentally new perspective was introduced by Miller and associates [6,7] in a diffusion path approach showing spontaneous emulsification to occur, when the path encountered a multi-phase range. Hence, phase diagram features became constructive tool to illustrate the fundamentals of the process [6,7]. A recent investigation [8] of this kind gave counterintuitive results, revealing cases of addition of water leading to an initial reduction of the aqueous phase.
These findings demonstrated the need to clarify the spontaneous emulsification for compositions close to the plait point, but experimentally the necessary accuracy is difficult to attain and Wheeler and Widom [9] instead calculated the interactions between di-functional (“diatomic”) molecules of the types AA, AB and BB, postulating interactions favoring the contacts of A ends with A ends and of B ends with B ends over the contacts of A ends with B ends. Near the plait point the shape of the binodal curve (two-phase coexistence curve) in the isothermal composition plane differed from the parabolic coexistence curves predicted by equations of state; such as the van der Waals equation. Instead, the calculated co-existence curve was closer to the nearly cubic curves for liquid-vapor equilibrium found in real one-component fluids.
The present numerical calculation is based on extensive experimental information on the system water/benzene/ethanol [10-16], which has been characterized by algebraic expressions using probability curve functions with the Weibull approach [13,14]. However, for the present problem, these modeling attempts do not provide sufficient accuracy and a different algebra[17,18] was utilized in order exactly to calculate the conditions in the plait point range of the diagram, Figure 1(c).
2. Fundamental Basis
The present numerical calculation is based on extensive experimental information on the system water/benzene/ethanol [10-16], which has been characterized by algebraic expressions using probability curve functions with the Weibull approach [13,14]. However, for the present problem, these modeling attempts do not pro-
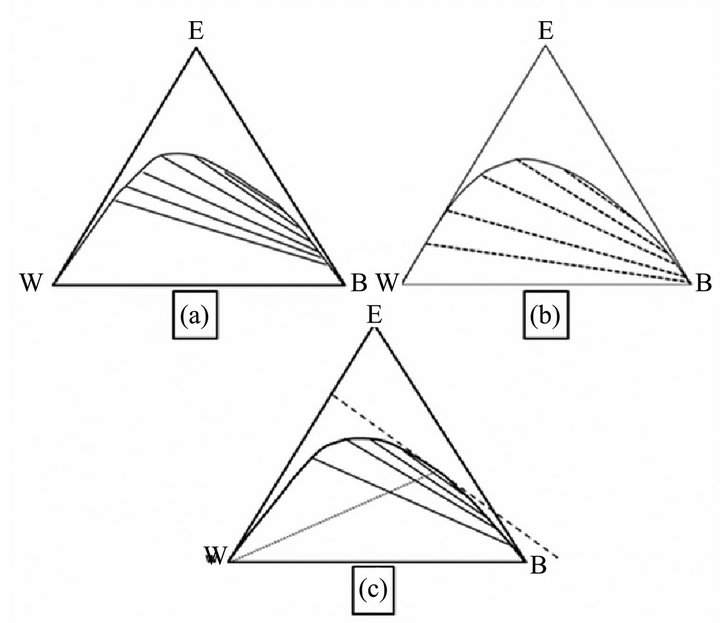
Figure 1. The phase diagram of the system water, benzene and ethanol. (a) [10]; (b) [11] and (c) [15].
vide sufficient accuracy and a different algebra [17,18] was utilized in order exactly to calculate conditions in the plait point range of the diagram, Figure 1 (c).
In the present calculations the mass fraction of a compound is represented by Yu, in which u denotes water by W, benzene by B and ethanol by E and the composition at one point is given as (YW, YE, YB). In addition, the two phases formed during the emulsification are marked as Aq, if the composition is along the branch from the plait point towards water and Oi, if located on the branch towards the benzene corner. Hence AqYW means the mass fraction of water in a composition on the aqueous branch, while YAq signifies the mass fraction of the entire aqueous phase. The coordinates for the de-mixing line and the tie lines were published by Ross and Patterson [15], who also gave a comparison with published values. Table 1 presents the values form Ross and Patterson and includes those for the plait point (0.100, 0.383, 0.517) from [16].
3. Basic Equations
In the phase diagram approach, the emulsification process is illustrated by adding water to a water poor composition, following the equilibrium changes in the phase fractions and compositions versus the water fraction. The conditions for large fractions of water have been described [8] revealing the aqueous fraction of the emulsion approaching unity and virtually all the added water entering the aqueous phase. In the present contribution the conditions close to the plait point are of interest; and two equilibrium aqueous/oil phase combinations closest to the plait point from [15,16] were used, Figure 2.
In addition the coordinates for the plait point according to [16] were combined with the ones by Ross and Patterson [15] and empirical functions of YE (YW) and YB (YW) were established in the range for the present investigation, 0.030 < YW < 0.214, Figure 2.
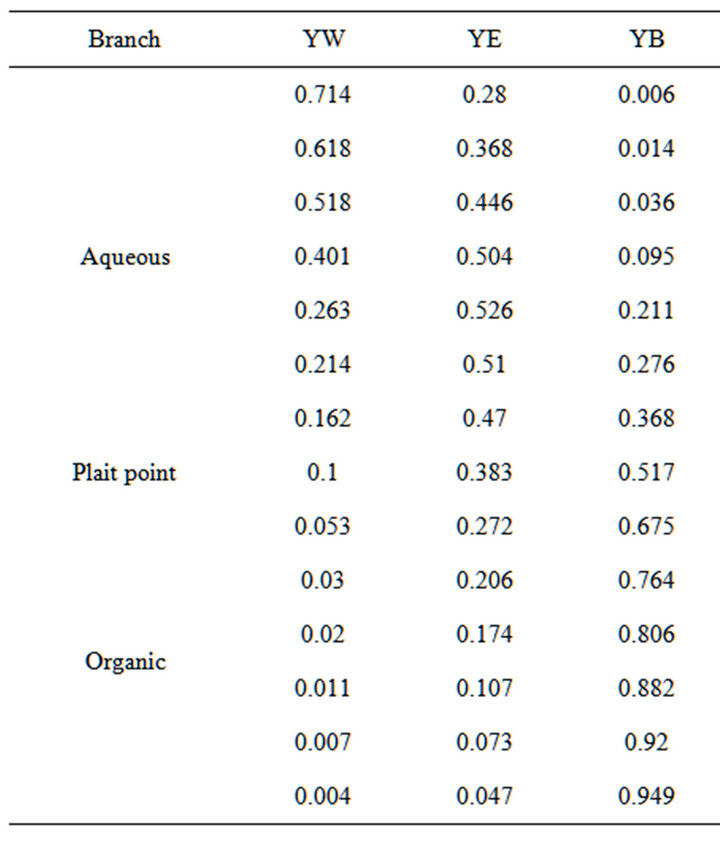
Table 1. The coordinates for the de-mixing line in mass fractions, according to Ross and Patterson [15] (indices W, E, and B indicate water, ethanol and benzene).
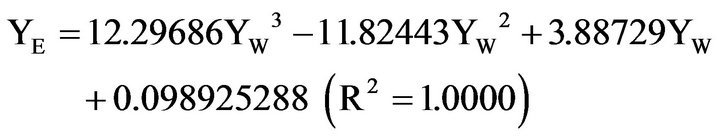 (1)
(1)
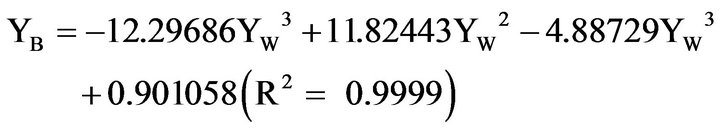 (2)
(2)
The number of digits in the constant terms may appear excessive, but are a consequence of the extreme accuracy needed for calculations close to the plait point. The sum of the numbers of YE and YB from Equations (1), (2) give a sum of mass fractions at YW = 0.1, which differs from unity by 3 × 10⁻¹³. In the continued treatment the demixing line is defined according to equations (1), (2), within the range given. This designation is necessary to avoid erroneous results in the calculations close to the plait point from the inevitable scattering of experimental numbers. Simultaneously, the equations adequately represent the water/benzene/ethanol de-mixing line at 20˚C, differing less than 0.4% from the experimental values [15,16].
However, while equations (1, 2) accurately predict the coordinates for the de-mixing line close to the plait point, they do not provide guidance as to the location and direction of tie lines in the range between the tangent at the plait point and the next tie line between (0.162, 0.470, 0.368) (Aq) and (0.053, 0.272, 0.675) (Oi). These were established using an early experimental result [19], which revealed tie lines to converge to a focal point on the water/hydrocarbon axis. No thermodynamic basis has been found for this correlation, but the experimental results have been reviewed [20], finding less satisfactory accuracy for compositions with small mass fractions, but very good agreement for mass fractions at a significant level.
With this background, the calculations could adjust the plait point slightly to ensure complete agreement with the experimental and calculated tie line between (0.162, 0.470, 0.368) (Aq) and (0.053, 0.272, 0.675) (Oi) or accept a deviation of less than 0.5% between the calculated and experimental tie lines. Since the numerical calculations were made significantly closer to the plait point than the mentioned experimental tie line, the plait point was retained at YW = 0.1 and YE and YB according to equations (1), (2). The focal point on the water/ benzene axis is defined by the tangent at the plait point and the tie lines all emanate from this point, providing exact numbers to make the calculations close to the plait point both realistic and credible. In summary; for the calculations the plait point is located at PPYW at exactly 0.1 and the coordinates PPYE and PPYB are those calculated according to equations (1), (2). This condition means the calculations close to the plait point are made with maximum accuracy, while still realistically representing the physical system of water/benzene/ ethanol with a precision equal to the experimental results.
The focal point, (FYW, 0, 1 – FYW) is calculated from the dYE/dYW of equation (1) at the defined plait point, (PPYW , PPYE, PPYB).
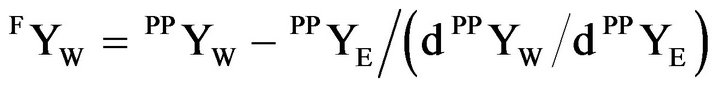 (3)
(3)
The calculations of the mass fractions of the two phases used the YE mass fraction in the phases for acceptable accuracy.
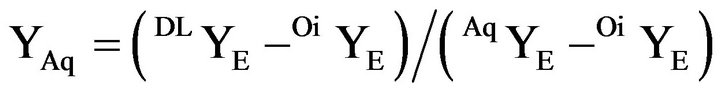 (4)
(4)
The coordinate for the dilution line, DLYE, is obtained from
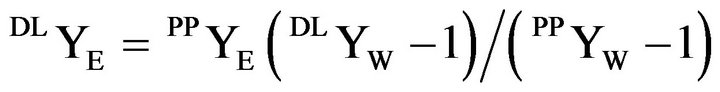 (5)
(5)
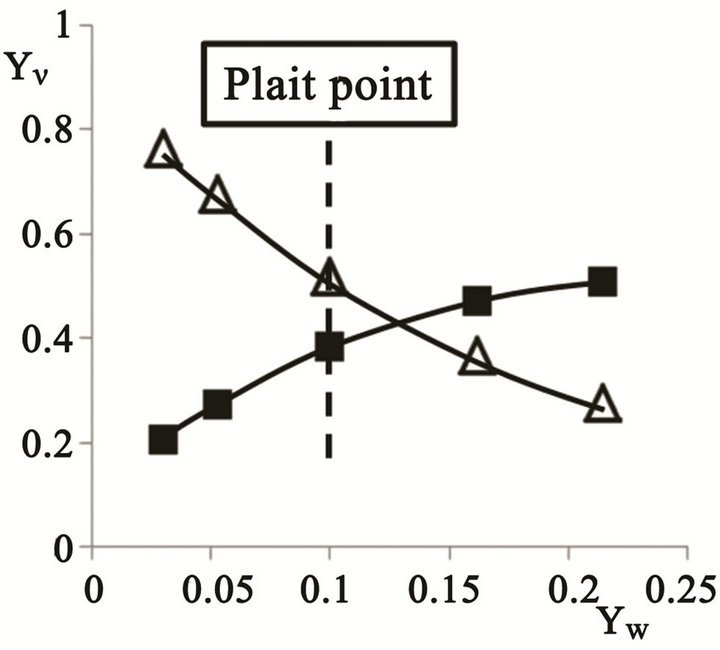
Figure 2.The mass fractions of ethanol (n) and benzene (r) versus the mass fraction of water, YW, on the de-mixing line close to the plait point, (0.1, 0.383, 0.517).
In which the the plait point (PPYW, PPYE, PPYB).
A rational approach to the calculations is to draw tie lines (TL) from the focal point (FYW, 0, 1 – FYW) through selected compositions on the dilution line and attain the coordinates on the de-mixing line by combining tie line equation with Equation (1). However, this approach did not result in sufficient accuracy of the de-mixing line coordinates and the tie line was instead drawn from selected points on the aqueous branch of the de-mixing line, (AqYW, AqYE, AqYB), giving
 (6)
(6)
A combination of this equation with Equation (1) and [4] provided the numbers to calculate the phase mass fractions.
4. Numerical Calculations
The critical point coordinates combined with the derivative of the de-mixing function from equation (1), 1.8914, gave FYW = −0.1018, but a more exact number was used in the calculations against the need for extreme accuracy.
The selected values for DLYW and the resulting DLYE are given in Table 2.
The mass fractions were calculated in the range for 0.101 < DMYW < 0.2 using the calculated values, while the fractions from those in the range 0.263 < DMYW < 0.852 used the experimental numbers [15]. The first tie line in Table 2 is extremely close to the plait point; significantly closer than would be available experimentally. The mass fraction of the aqueous phase was calculated and shown in Figure 3 for different mass fractions of the dilution water. The corresponding numbers for the oil phase are
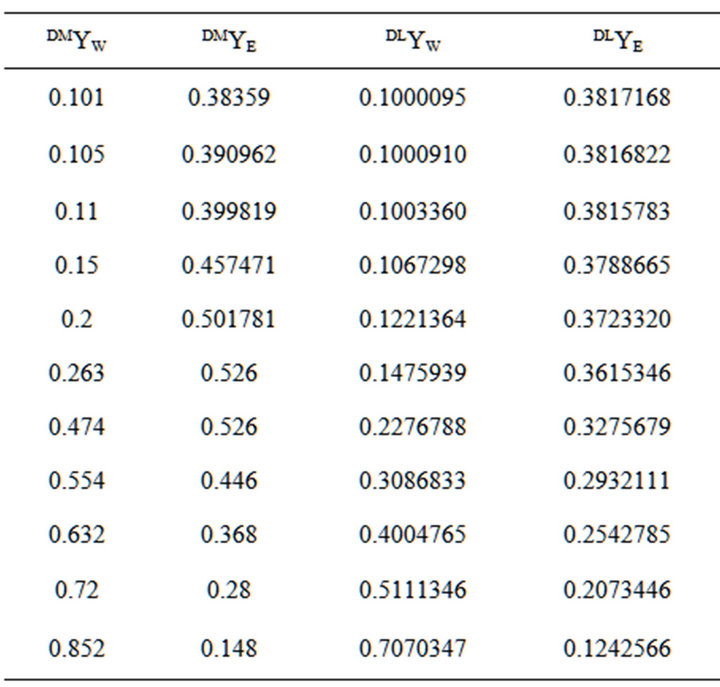
Table 2.The coordinates for the water dilution line from the plait point.
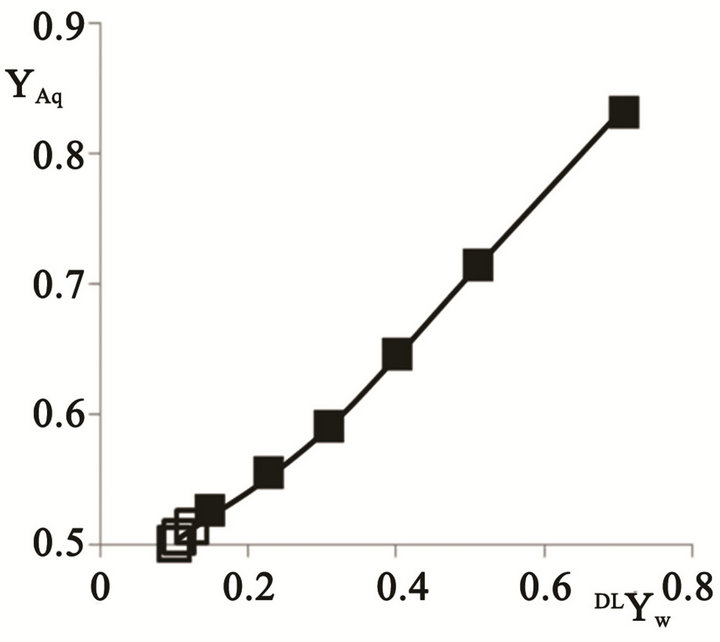
Figure 3. The aqueous phase mass fraction versus added water mass fraction.
not given, since the sum of the fractions equal unity.
5. Discussion
Several aspects of the results merit a further analysis. One central facet is the extent to which numbers contribute to the understanding of the mass fractions of the two liquid phases formed at initial addition of water to a composition at the plait point. This phenomenon has been widely analyzed since the early contribution by Wheeler and Widom [9], because of its significance for emulsion inversion; an industrially central item [4]. The treatments of this specific item are per se interesting; having developed from the very early studies [21-25], via the interesting usage of the catastrophe theory [26-28) until its final repudiation [29]. Ross and Kornbrekke [30] interpreted the inversion as a stochastic process. These attempts gave a different number for the mass fractions of the two liquid phases formed with Smith and Lim predicting equal fractions for the system water/butoxyethanol [25], while Waessen and Stein revealed the results better to be represented by a water fraction of 0.53 [31] The results of the present contribution support show mass fractions of 0.5, Figure 3.
The second topic of significance is the direct effect on spontaneous emulsification of the plait point, when compositions on the de-mixing line encounter water. The experimental investigations so far [8], revealed the process to become more intense for compositions close to the plait point and the present results are useful to understand this fact, when reflected against the features of the phase diagram for the system water/benzene/ethanol. The diagram displays the change in mass fractions of the two phases formed with the added water; the fundamentals of the process. The phase diagram details are transformed to mass changes, instead of the mass fractions, of the two phases, when the changes due to added water are calculated.
The initial emulsion is assumed of unity mass and the added mass of water is ryw.
The total mass of the emulsion, Emyt is
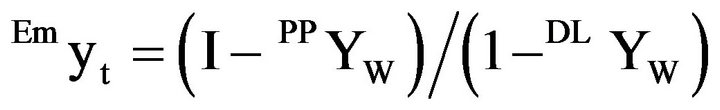 (7)
(7)
The mass of the phases become
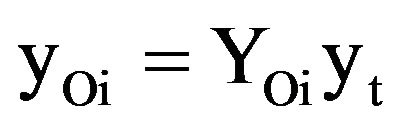 (8)
(8)
and
 (9)
(9)
with

The mass of the two phases versus the total emulsion mass is displayed in Figure 4.
The aqueous phase mass is approximately linearly increased, while that of the oil phase remains nearly constant, indicating the added water to be exclusively absorbed by the aqueous phase. The terminus of the added water is better illustrated by the derivative dyn/dyt , which is shown in Figure 5 versus the total emulsion mass.
Figure 5 illustrates the addition of the added water to each phase. The increase in the aqueous phase is virtually identical to the mass of added water; i.e. all the added water ends in the aqueous phase.
This information refers to equilibrium conditions and it is crucial to realize the importance of the fact that spontaneous emulsification is a kinetic process and, at a first glance, and an equilibrium analysis may appear both trivial and of little relevance to the physical actions. A cursory analysis shows an O/W emulsion formed by contacting water with a solution at the plait point, as indicated by the mass fractions in Figure 4. Subsequently added water would be expected to dissolve into aqueous phase and no further emulsification should be expected. However, such an analysis does not take into account the features of the phase diagram, which indicate the process to be significantly more complex.
Initially, the composition at the plait point is a onephase liquid, but the smallest addition of water leads to an emulsion of equal mass of an aqueous and oil phase. As consequence the derivative of the phase masses with respect to added water goes to infinity causing a most intense emulsification; a rational expectation as shown by experiments [32]. This mechanism is probably the most significant mechanism underlying the powerful increase of spontaneous emulsification for compositions close to the plait point [8]. However, such emulsification also leads to highly complex emulsions [32] and the phase diagram offers a potential explanation for their formation, Figure 6.
According to the diagram, initial entry of water into a composition at the plait point leads to a separation into an aqueous phase, Aq I, and an oil phase, Oi I, the initial emulsion. The crucial factor for the “secondary emulsification” is the fact that the Aq I is not mutually soluble with water and the exposure to the latter leads to a
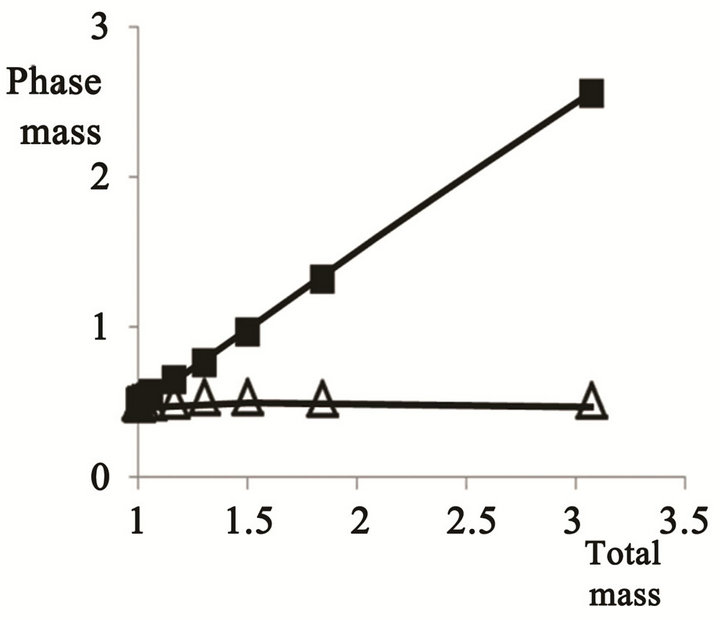
Figure 4. The mass of the aqueous (n) and oil (D) phases versus the total emulsion mass.
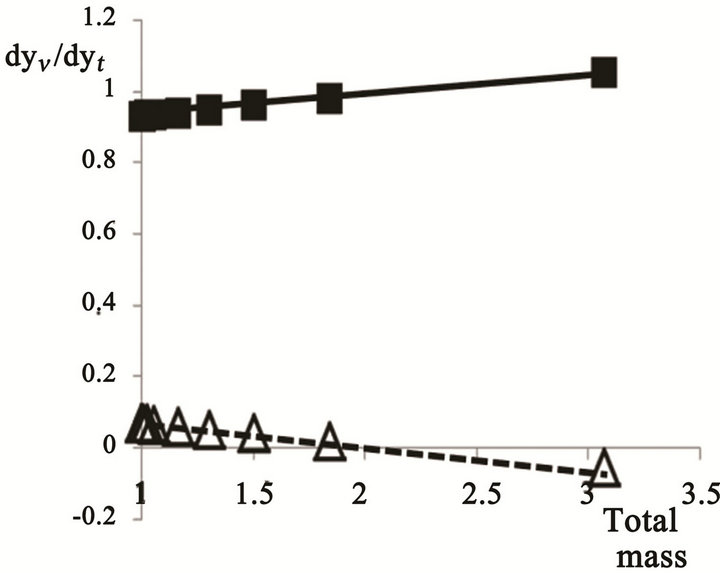
Figure 5. The derivative of mass of water added to each phase/total mass versus the total mass.
n Aqueous phase; D Oil phase
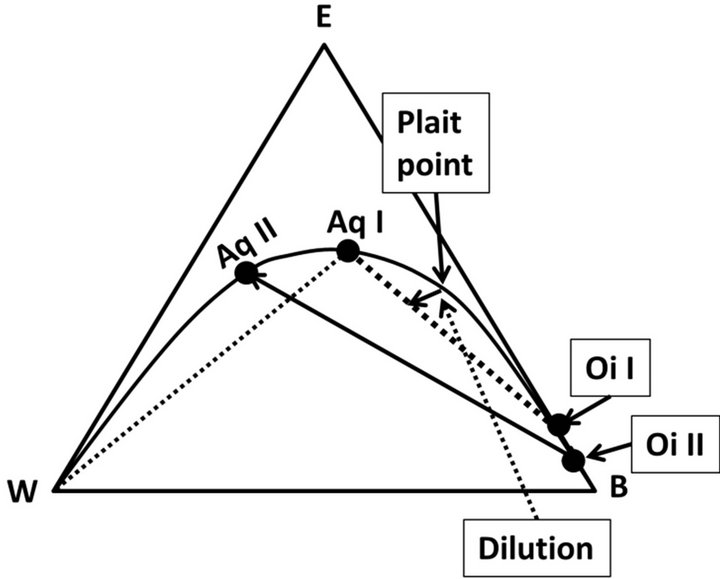
Figure 6. Illustration of the “secondary” emulsification. An emulsion of phases Aq I and Oi I are formed, when water is added (Dilution) to a composition at “Plait point”. The aqueous phase formed, Aq I, and water are not mutually soluble and a “secondary emulsion” emulsion is formed, represented by Aq II and OI II.
“secondary emulsion” signified by the phases Aq II and Oi II. Such spontaneous emulsification between water and an aqueous solution in the water/benzene/ethanol system has recently been described [33]. The process was significantly slower (minutes) than the primary process at the plait point; indicating a factor for the complexity of emulsions of this kind.
6. Summary
Spontaneous emulsification between solutions close to the plait point and water was related to the phase diagram features in the system water/benzene/ethanol.
The process was found to consist of two main mechanisms: An initial extremely fast action, when the solution spontaneously separates into two phases at the smallest addition of water and a slower process, when the aqueous phase of the primary emulsion encounters water.
7. Acknowledgements
The support from the Ugelstad Laboratory is gratefully acknowledged
REFERENCES
- J. Gad, “Zur Lehre von der Fettresorption,” Archive Anatomischer Physiologie, 1878, pp. 181-192.
- J. T. Davies and E. K. Rideal, “Interfacial Phenomena,” Academic Press, New York, 1963, Chapter 8.
- J. C. Lopez-Montilla, P. E. Herrera-Morales, S. Pandey and D. O. Shah, “Spontaneous Emulsification: Mechanisms, Physicochemical Aspects, Modeling and Applications,” Journal of Dispersion Science and Technology, Vol. 23, No. 1-3, 2002, pp. 219-268.
- J. L Salager, A. Forgiarini, L. Márquez, A. Peña, A. Pizzino, P. Rodriguez and M. Rondón-González, “Using Emulsion Inversion in industrial Processes,” Advances in Colloid and Interface Science, Vol. 108-109, 2004, pp. 259-272. doi:10.1016/j.cis.2003.10.008
- O. Theissen and G. Gompper, “Lattice-Boltzmann Study of Spontaneous Emulsification,” The European Physical Journal, Vol. 11, No. 1, 1999, pp. 91-100.
- K. J. Ruschak and C. A. Miller, “Spontaneous Emulsification in Ternary Systems with Mass Transfer,” Industrial & Engineering Chemistry Fundamentals, Vol. 11, No. 4, 1972, pp. 534-540. doi:10.1021/i160044a017
- C. A. Miller, “Spontaneous Emulsification Produced by Diffusion—A Review,” Colloids and Surfaces, Vol. 29, No. 1, 1988, pp. 89-102. doi:10.1016/0166-6622(88)80173-2
- A. Bozeya, A. Al-Bawab, S. E. Friberg and C. A. Miller, “Spontaneous Emulsification and Phase Equilibria in the System Water, Ethanol and Benzene,” Journal of Dispersion Science and Technology, in Press.
- J. C. Wheeler and B. Widom, “Phase Transitions and Critical Points in a Model Three-Component System,” Journal of the American Chemical Society, Vol. 90, No. 12, 1968, pp. 3064-3071. doi:10.1021/ja01014a013
- K. A. Varteressian and M. R. Fensce, “Liquid-Liquid Extraction,” Industrial & Engineering Chemistry, Vol. 28, No. 11, 1936, pp. 929-933. doi:10.1021/ie50323a027
- V. Brandan, A. Chlanese and M. Rossi, “Ternary LiquidLiquid Equilibrium Data for the Water-Ethanol-Benzene System,” Journal of Chemical & Engineering Data, Vol. 30, No. 1, 1985, pp. 27-29. doi:10.1021/je00039a009
- B. Dobson, “The Weibull Analysis Handbook,” 2nd Edition, ASQ Quality Press, Milwaukee, 2006.
- K. Y. Lee, “Model to Describe the Binodal Curve on a Type 1 Ternary Phase Diagram,” Journal of Environmental Engineering, Vol. 270, 2010, pp. 650-668. doi:10.1061/(ASCE)EE.1943-7870.0000196
- K. Y. Lee and C. A. Peters, “UNIFAC Modeling of Cosolvent Phase Partitioning in Nonaqueous Phase Liquid-Liquid Water System,” Journal of Environmental Engineering, Vol. 130, No. 4, 2004, pp. 478-483. doi:10.1061/(ASCE)0733-9372(2004)130:4(478)
- S. Ross and R. E. Patterson, “Surface and Interfacial Tensions of Conjugate Soluitons in Ternary Systems,” Journal of Chemical & Engineering Data, Vol. 24, No. 2, 1979, pp. 111-115. doi:10.1021/je60081a012
- A. Seidel and W. Linke, “Solubility of Inorganic and Organic Compounds,” Supplement to 3rd Edition, D. Van Nostrand Company, New York, 1919, p. 921.
- S. E. Friberg and A. Al-Bawab, “Analytical Expressions to Calculate Relative Amounts of Phases in a Three-Phase Emulsion,” Langmuir, Vol. 21, No. 22, 2005, pp. 9896- 9900. doi:10.1021/la058007n
- S. E. Friberg, “Weight Fractions in a Three-Phase Emulsion with an L (Alpha) Phase,” Colloids and Surfaces A, Vol. 282-283, 2006, pp. 369-376.
- D. N. Tarasekov and T. A. Paul’sen, “Focal Point of Tie Lines in a Ternary System,” Journal of General Chemistry (USSR), Vol. 8, 1938, pp. 76-83.
- J. Bachman, “Convergence of Tie Lines in Ternary Liquid Systems,” The Journal of Physical Chemistry, Vol. 44, No. 4, 1940, pp. 446-449. doi:10.1021/j150400a009
- W. Ostwald, “Beitrage der Kolloidchemie des Kautchuks,” Zeitschrift für Chemie und Industrie der Kolloide, Vol. 6, No. 2, 1910, pp. 103-112. doi:10.1007/BF01465754
- W. D. Bancroft, “The Theory of Emulsions V,” The Journal of Physical Chemistry, Vol. 17, No. 6, 1913, pp. 501- 519. doi:10.1021/j150141a002
- J. S. Rowlinson and B. Widom, “Molecular Theory of Capillarity,” Clarendon, Oxford, 1984, p. 327.
- K. H. Lim, W. Zhang and D. H. Smith, “Temperature Dependence of Emulsion Morphologies and the Dispersion Morphology Diagram: Two-phase Emulsions of the System C6H13(OC2H4)2OH-Tetradecane-Water,” Colloids and Surfaces, Vol. 264, No. 1-3, 2005, pp. 43-48. doi:10.1016/j.colsurfa.2005.05.004
- D. H. Smith and K. H. Lim, “An Experimental Test of the Catastrophe and Critical-Scaling Theories of Emulsion Inversion,” Langmuir, Vol. 6, No. 6, 1990, pp. 1071-1077. doi:10.1021/la00096a008
- R. Thom, “Stabilité Structurelle et Morphoge'ne'se,” Benjamin, London, 1972.
- E. Dickinson, “Interpretation of Emulsion Phase Inversion as a Cusp Catastrophe,” Journal of Colloid and Interface Science, Vol. 84, No. 1, 1981, pp. 284-287. doi:10.1016/0021-9797(81)90290-3
- J. L. Salager, “Phase Behavior of Amphiphile-Oil-Water Systems Related to the Butterfly Catastrophe,” Journal of Colloid and Interface Science, Vol. 105, No. 1, 1985, pp. 21-26. doi:10.1016/0021-9797(85)90342-X
- G. E J. Vaessen, M. Visschers and N. H. Stein, “Predicting Catastrophic Phase Inversion on the Basis of Droplet Coalescence Kinetics,” Langmuir, Vol. 12, No. 4, 1966, pp. 875-882. doi:10.1021/la950379g
- S. Ross and R. E. Kornbrekke, “Change of morphology of a liquid-liquid dispersion as a stochastic process,” Journal of Colloid and Interface Science, Vol. 81, No. 1, 1981, pp. 58-69. doi:10.1016/0021-9797(81)90301-5
- G. E. J. Vaessen and H. N. Stein, “The Applicability of Catastrophe Theory to Emulsion Phase Inversion,” Journal of Colloid and Interface Science, Vol. 176, No. 2, 1995, pp. 378-387. doi:10.1006/jcis.1995.9954
- A. Al-Bawab, A. Bozeya, S. E. Friberg, L. Ge and G. Rong, “Some Experiments on Complex Spontaneous Emulsification in the System Water-Benzene-Ethanol,” Colloid and Polymer Science, 2013 (in Press).
- A. Bozeya, A. Al-Bawab, S. E. Friberg, L. Ge and G. Rong, “Spontaneous Emulsification between Incompatible Aqueous Solutions in the Water/Ethanol/Benzene System,” Journal of Colloid and Interface Science, 2013 (in Press).