Journal of Flow Control, Measurement & Visualization
Vol.04 No.03(2016), Article ID:68195,14 pages
10.4236/jfcmv.2016.43008
Attenuation Effect of Expansion Configuration and Acoustic Material on Propagation of Blast Waves in a Duct
Motonobu Ishiguro1, Kenji Shinkai1, Ryo Shimamura1, Hironobu Gunji2, Yoko Takakura1*
1Course of Mechanical Engineering, Graduate School of Engineering, Tokai University, Kanagawa, Japan
2Department of Prime Mover Engineering, Tokai University, Kanagawa, Japan

Copyright © 2016 by authors and Scientific Research Publishing Inc.
This work is licensed under the Creative Commons Attribution International License (CC BY).
http://creativecommons.org/licenses/by/4.0/


Received 8 February 2016; accepted 3 June 2016; published 12 July 2016
ABSTRACT
With recent increase of cars, the noise problem has been caused by the exhaust sounds released from exhaust pipes, which consist of weak and pulsed shock waves called blast waves. To diminish the noise, a silencer is set up in front of the exhaust pipe. In the present study, reflectors were installed in the high-pressure section of the shock tube to generate blast waves, and three types of expansion region were investigated, combined with acoustic material of glass wool. The pressure decay was evaluated by transmission factor and reflection factor for the incident blast wave, together with pressure histories and high-speed Schlieren photography. As results, it was confirmed that the acoustic material greatly contributed to blast-wave attenuation: the one stage expansion model with glass wool recorded the highest decay of the peak over pressure for transmission, and other models with glass wool showed the second highest. The acoustic material also contributed to decay of reflected shock waves propagating toward an upstream duct.
Keywords:
Blast Wave, Shock Tube, Exhaust Noise, Decay Factor, Silencer Model, Acoustic Material

1. Introduction
With recent increase of road vehicles, the noise released from exhaust pipes has caused one of public hazards [1] . Such noise is also referred to as high frequency exhaust noise, generation of which is considered to be related with weak shock waves. Therefore for reduction of the noise usually silencers are installed to attenuate shock waves.
In experimental pressure measurements using actual cars [2] , it is reported that shock waves with Mach number about 1.1 are generated in the exhaust pipe, and pulsed pressure profiles are shown in the upstream side of the silencer. The pulsed shock wave is considered to be the blast wave, which is an unsteady pressure wave where the shock wave is accompanied by expansion waves. In the blast wave, the pressure decays just behind the abrupt rise by a shock wave, while in the usual shock wave, the pressure is kept constant behind the pressure rise. The blast waves are generated by the explosion, and in the natural phenomena they are caused by the volcanic eruption. In this research, the blast waves are generated in a shock tube by the way shown in [3] .
Till now various researches have been reported about silencers of cars, models of which are classified typically into one-stage and multi-stage expansion models, by the number of partitioned chambers with diameter higher than that of the exhaust pipe. In early-stage investigations, Kanai presented theoretical equations to give attenuation characteristics of pure sound for fundamental expansion models [4] , investigated attenuation characteristics of exhaust noise theoretically and experimentally, and showed that multi-stage expansion models with connecting pipes or expansion chambers filled with the acoustic material of glass wool had much efficacy [5] . Izumu, et al. investigated the attenuation effects for the noise of airflows less than 50 m/s for one-stage models with several adapters in either side of inflow or outflow duct [6] . These early-stage investigations were carried out mainly from the view point of acoustics. However, it was pointed out that a linear acoustic theory held for waves of infinitesimal pressure amplitudes, and not for waves of finite amplitudes generated in the exhaust pipe, where the nonlinear compression wave developed into the shock wave [7] . Subsequently, from the view point of decreasing the pressure rise by shock waves, experiments using a shock tube and corresponding numerical simulations were carried out for one-stage and two-stage expansion models with simplified configurations [8] [9] . Further, the way to generate blast waves in a shock tube was devised to evaluate the pressure decay in typical basic models [3] . In these investigations, it was shown that the two-stage models were more effective to decrease the peak over pressure than the one-stage expansion models. Moreover, flow simulation was also shown for configurations of multi-stage expansion models closer to the actual car silencers [10] .
Recently, in industrial products, the use of sound absorbing materials has spread rapidly, and also in the actual silencers, nowadays, it is of the mainstream to combine the basic configurations above stated and acoustic materials, but the effects are not open to the public. Further in the public reports, as incident waves the usual shock wave are adopted, but seldom are the blast wave. Therefore in this research, silencer models with basic expansion configurations are adopted without and with the acoustic material such as glass wool to evaluate the pressure decay of blast waves quantitatively, using the blast wave generation mechanism in a shock tube [3] [11] . As the evaluation methods, besides the decay factor for shock transmission [3] , the decay factor for shock reflection is also introduced here.
The aim of the present research is to investigate and evaluate, in a shock tube, the decay of blast waves about the three types of expansion region, one-stage type, two-stage type and front-slope type without and with the acoustic material of glass wool, by qualitative interpretation for high-speed Schlieren photography and by quantitative measurement on pressure.
2. Principle to Generate Blast Wave
In the Riemann problems for the perfect gas with the initial conditions given for states 1 and 4 corresponding to low and high pressure sections, respectively, solutions can be constructed with similarity for state 2 between the shock wave and the contact surface and state 3 between the contact and the expansion tail, and also for states of the expansion fan between the wave tail and front. Pressure p, velocity u, temperature T and sound speed  (γ is the ratio of the specific heats and R is the gas constant) with subscript for each state are derived with speed of the shock wave cS, that of the contact surface u2 = u3, and that of the characteristic curves u ± a, in text books for engineering [12] and mathematical [13] fields. In the x-t diagram, the expansion wave consists of characteristics going away from each other, the compression wave consists of characteristics approaching each other, and the shock wave occurs at the crossing point of characteristics.
Generation mechanism of blast waves here is that the backward expansion wave, generated in the high-pres- sure section immediately after rupture, is reflected by the end wall of the section, and follows the preceding shock wave [3] . Figure 1 shows the x-t diagram from the rupture until the characteristic curve issued from the reflection of the characteristic line for the expansion-wave front at the section end firstly interacts with
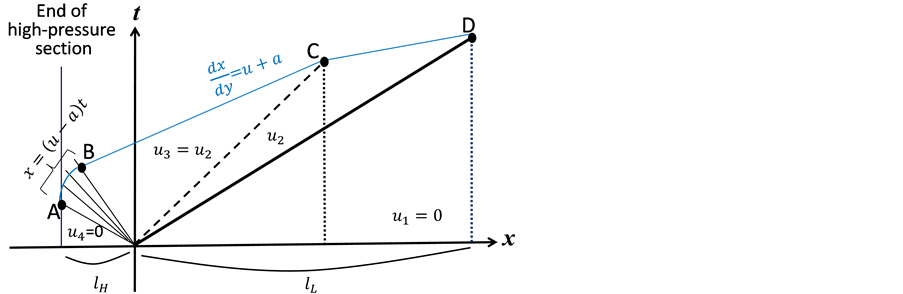
Figure 1. x-t diagram.
the other characteristics forming the expansion wave, the contact surface, and the shock wave. Here it is assumed that the trajectory of the characteristic curve from the reflection of the expansion front is not affected by the subsequent reflected characteristics, that is, the reflected characteristic of the wave front proceeds on the exact solution of the Riemann problem, because we are interested in obtaining briefly the distance at which the reflected expansion front overtakes the shock wave.
Let the lengths of low and high pressure sections be lL and lH, respectively, then derive the reflecting point of the expansion front A (tA, xA), the interacting points with the expansion tail B (tB, xB), with the contact surface C (tC, xC), and with the shock wave D (tD, xD).
First, in expansion portion interacting states from point A to point B can be expressed by the following equations 1) each characteristics forming the expansion fan are written by
 (1)
(1)
2) the following equality hold, using the Generalized Riemann invariant across the characteristics (1) [14] ,
 , (2)
, (2)
3) the characteristic curve issued from the reflection of the characteristic line for the expansion-wave front is expressed as
 . (3)
. (3)
u and a are solved simultaneously by Equation (1) and Equation (2), and substitution of them into Equation (3) leads to
 (4)
(4)
Equation(4) is numerically solved by the second-order Runge-Kutta method from point A  to point B
 , that is, during
 .
.
Next, in state 3 from point B to point C the characteristic curve (3) can be written as
 , (5)
, (5)
until it overtakes the contact surface with trajectory below,
 . (6)
. (6)
Point C can be computed as the intersection of Equation (5) and Equation (6)
 (7)
(7)
Finally, in state 2 from point C to point D the characteristic curve (3) can be written as
 (8)
(8)
until it overtakes the shock wave with trajectory below,
 . (9)
. (9)
Point D can be computed as the intersection of Equations ((8) and (9)):
 (10)
(10)
Thus, when the length of the high pressure section is given to be lH, the length in the low pressure side necessary for the reflected expansion front to overtake the shock wave has been determined to be
 . (11)
For location x > lL the blast wave can be observed. Figure 2 shows relation of lL and lH required to generate a blast wave for the given pressure ratio of .
.
3. Experimental Setup
3.1. Shock Tube
Figure 3 shows a schematic diagram of the shock tube used in the present study. The high pressure chamber and the low pressure chamber are formed by a circular duct with inner diameter 144.6 mm and a rectangular duct with height 120 mm and width 40 mm, respectively. Using a direct-current rupture device [10] , the diaphragm with Nichrome wire adhered is broken by burning off with electricity. The blast wave generator that consists of four plates (Figure 4) is placed in the high-pressure chamber as shown in Figure 3. There is a very small gap between the plates and the chamber wall, the first plate nearest to the diaphragm acts mainly as the end of the high-pressure section, and the other plates slightly adjust smoothness of the blast wave. In the low-pressure chamber, an expansion region (170 mm) with an inflow duct (750 mm) and an outflow duct (500 mm) is installed.
3.2. Generation of Blast Waves
Throughout the present paper, the pressure ratio is about 2 (the gauge pressure in the high-pressure section is set as 0.1 MPa, and the low-pressure section is open to the atmosphere), and the length of high-pressure section, i.e., distance from the diaphragm to the nearest plate, is 100 mm. Since Figure 2 indicates that the length of the low-pressure section necessary for blast-wave generation is about 2000 mm, the low-pressure section length of
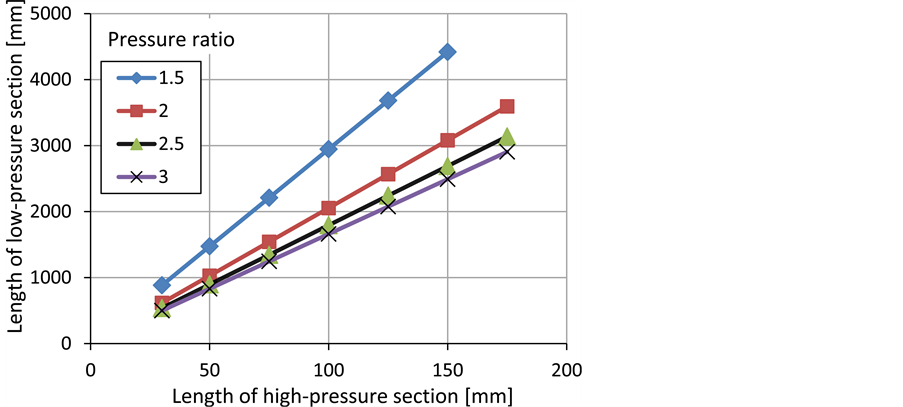
Figure 2. Length of low-pressure section necessary for blast wave generation.

Figure 3. Schematic diagram of shock tube.

Figure 4. Blast wave generator.
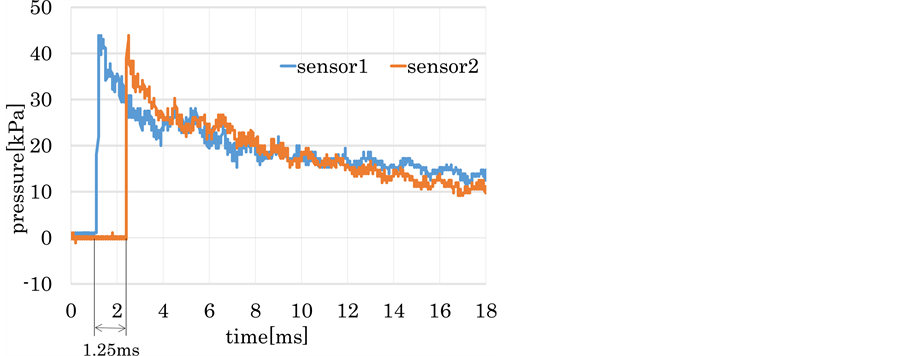
Figure 5. Pressure histories of blast waves measured.
the shock tube shown in Figure 3 meets the condition. Figure 5 shows the time histories of pressure measured at sensor location x = 1750 mm from the diaphragm and at sensor location x = 2250 mm in the shock tube without models of an expansion region and inflow/outflow ducts. The pressure curves show the shape of blast waves where the pressure behind a shock wave gradually decreases by interaction with expansion waves. Since the distance between sensors 1 and 2 is 500 mm, with the propagation time of the blast-wave front of 1.25 ms and the sound speed of 345m/s at temperature 23˚C, the blast-wave velocity and Mach number are calculated as 400 m/s and 1.16, respectively. On the other hand, the theoretical shock Mach number at pressure ratio 2 is also 1.16. The reason why Mach numbers agree between the measured blast wave and the theoretical shock wave is considered that the blast wave is measured at about x = 2000 mm where the expansion waves just overtake the shock wave.
3.3. Silencer Models
In the present study three types of expansion region was adopted without and with acoustic material, and totally six types of silencer models are shown in Figure 6. Figure 6(a) shows the detail of one-stage expansion model, where the height of inflow and outflow ducts is d = 35 mm, the length and height of expansion region are L = 170 mm and D = 75 mm, and the ratio of heights is D/d = 2.14, which are common in all models. According to JIS (Japanese Industrial Standards) for silencers [15] , D/d should be less than 3.5, whose condition applies to the present case. In all the models, pressure sensors 1 and 2 are set up just in upstream and downstream sides of the expansion region, respectively. Figure 6(b) is a two-stage expansion model, where the expansion region is partitioned into two chambers with a central connecting duct, whose height X is changed for X = 35 mm (standard case with X = d), 25 mm, 15 mm. Figure 6(c) is a front-slope model, where the upstream wall has inclination, whose angle α is changed for α = 15˚, 30˚, 45˚. According to Izumi, et al. [6] , noise reduction of about 5 db is gained with a bell-mouse set at the entrance to prevent airflow disturbances by rapid expansion of the duct, the reason of which is considered that the noise generated by impingement of the jet from the entrance against the rear end of the expansion region is attenuated. Here for simplicity of configurations, the straight slope is adopted instead of the bell-mouse. Partly to weaken the impingement and reflection of the shock wave at the rear end, the acoustic material is also used. Figure 6(d), Figure 6(e) and Figure 6(f) show models of type Figures 6(a)- (c) with non-combustible glass wool as the acoustic material, respectively. In Figure 6(d), a perforated panel (thickness: 1 mm, diameter of a hole: 5 mm, porosity: 35%) is put in the one-stage expansion region at the same height of the upper and lower wall of the inflow duct, to enclose the glass wool in the space of 20 mm between the panel and the expansion wall as actual car mufflers. In Figure 6(e), the above perforated panel is put in the two-stage expansion model with the height of central duct of X = 35 mm, same as the height of an inflow duct, to enclose the glass wool. In Figure 6(f), the glass wool is put in the rear-cavity portion of the front-slope model.
3.4. Schlieren System
Figure 7 shows Schlieren system using a high-speed camera for the purpose of visualization. Diode laser CAVILUX HF (Cavitar Ltd.) is used for a light source. The light is collected by a convex lens into the pin pole, which is placed such that the reflected light from the concave mirror forms parallel rays passing through the test section. The parallel rays are collected by the concave mirror on the other side of the test section and focused to a point at the knife edge set vertically, and continue on to high-speed video camera PHANTOM v711 (Vision Research Inc.). Schlieren photographies were taken with frame rate of 28,006 to 63,551 per second, resolution of 640 × 480 pixels or 320 × 240 pixels, and exposure time of 1.00 μs.
4. Results and Discussion
In the present experiments, the high-pressure section is filled with the air of 0.1 MPa in gauge pressure, and the low-pressure section is open to the atmosphere. Therefore the pressure ratio is about 2 and then blast-wave Mach number is 1.16 as described in Sec. 2.2.
Experimental results are evaluated as follows. Let (ΔPin)max and (ΔPout)max be the maximum pressure rise of


 (a) (b) (c)

 (d) (e) (f)
Figure 6. Model geometries without and with acoustic material. (a) One-stage expansion model; (b) Two-stage expansion model; (c) Front-slope model; (d) One-stage type with glass wool; (e) Two-stage type with glass wool; (f) Front-slope type with rear glass wool.

Figure 7. Schematic setup of Schlieren system.
the incident wave just in upstream side of the expansion region (at sensor 1) and the maximum pressure rise of the transmitted wave propagating just into downstream side of that (at sensor 2), and (ΔPref)max be the maximum pressure rise of the reflected wave (at sensor 1), and pressure decay factors are defined by two ways:
Comparison 1) Decay Factor for Transmission
 (12)
(12)
Comparison 2) Decay Factor for Reflection
 (13)
(13)
In addition, as methods to attenuate the shock wave propagating in a ducts, there are two types by set of expansion regions and by set of obstacles such as orifices and nozzles [16] [17] . The terms “transmission” and “reflection” are used in the latter types, whereas existence of the reflected wave has not been clearly pointed out in the former types. In the present research of the former type, these terminologies are used by regarding the expansion regions as “media”, as well as obstacles.
4.1. One-Stage Expansion Model
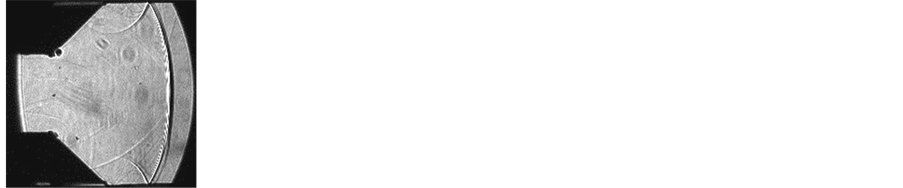
Figures 8(a)-(c) show phenomena in time history of Schlieren photography. Figure 8(a) shows the overall propagating process: (a-1): the incident blast wave passes the sensor1 just in upstream side of the silencer model; (a-2): the shock wave emitted from the duct is diffracted by the expansion wave generated at the corner of the duct, the entrance of the silencer model, resulting in the propagation of the cylindrical shock wave in the silencer; a pair of vortices with reverse direction appears at the corner of duct due to the interaction of emitted shock wave with the corner; the cylindrical shock appears to reflect regularly at the upper and lower walls; (a-3): transition seems to occur from the regular to the Mach reflections at the walls, although the process cannot be investigated due to the low frame rate; the reason why the transition is assumed is that the angle between the incident cylindrical shock and the wall is getting larger with propagation [18] ; and (a-4): the shock wave propagates into the outflow duct, passing sensor 2, and at the same time reflects upstream at the end wall of the expansion chamber. The more detailed process for transmission and reflection of the shock wave is shown in Figure 8(b); the blast wave reaching the chamber end interacts with the corner, resulting in two-directional waves: the shock wave propagating downstream into the outflow duct and the reflected shock wave propagating upstream toward the entrance of the chamber. Figure 8(c) shows detailed phenomena near the chamber entrance where the reflected shock wave propagating upstream reaches the entrance in the countering flow and further propagates into the inflow duct.
In the pressure histories shown in Figure 8(d), sensor 1 shows rapid pressure rise of the wave front and then the second pressure rise 1.2 ms after the first rise, which can be considered with the Schlieren photography that the first rise is generated by the incident shock (Figure 8(a-1)) and the second one is by the reflected shock propagating upstream back to the entrance (Figure 8(c-4)). By comparisons 1 and 2 (see the comparison points


 (a-1) 0.0 ms (a-2) 0.107 ms (a-3) 0.396 ms (a-4) 0.537 ms(a)


 (b-1) 0.474 ms (b-2) 0.490 ms (b-3)0.506 ms (b-4)0.522 ms(b)


 (c-1) 1.000 ms (c-2) 1.071 ms (c-3) 1.142 ms (c-4) 1.214 ms(c)
 (d)
(d)
Figure 8. One-stage expansion model. (a) Overall process of shock propagation: pictures (a-1) and (a-2) show left half and pictures (a-3) and (a-4) show right half; (b) Process for transmission and reflection of shock wave at end of expansion region: all show right half; (c) Process of reflected shock wave propagating upstream near entrance of expansion region: all show right half; (d) Pressure histories.
in Figure 8(d)), decay factors for transmission and reflection are evaluated as ηP1 = 89% and ηP2 = 114%, respectively.
4.2. Two-Stage Expansion Model
Figure 9 shows phenomena in time history of Schlieren photography for the model with narrowest connecting duct X = 15 mm: (1) the incident blast wave passes the sensor 1 just in upstream side of the model; (2) the shock front is diffracted and propagated in the first expansion chamber with a pair of vortices formed near the entrance, and the blast wave reaching the end of the first chamber interacts with the corner; as the result, the shock wave propagating downstream into the connecting and the reflected shock wave moving upstream are generated; (3) the transmitted wave diffracts and propagates in the second expansion chamber with vortices formed near the entrance; and (4) the shock wave interacts with the corner, which yields again waves propagating into the opposite directions: the shock transmitting into the outflow duct, passing sensor 2, and reflected shock moving upstream.
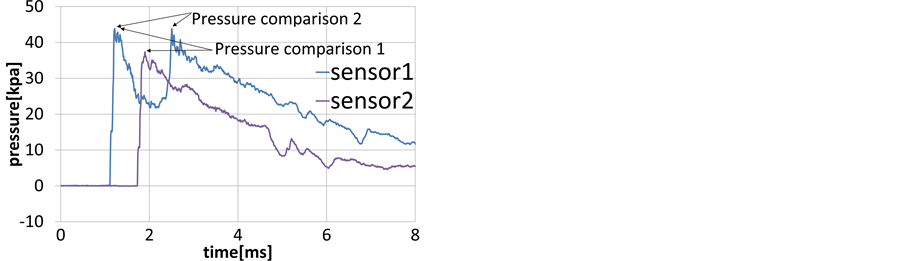
Figures 10(a)-(c) show pressure histories when the height of the connecting duct is changed for X = 35 mm, 25 mm, 15 mm, respectively. As reflected shock waves are generated in both the first and second chambers, the wave shapes of sensor 1 show, after the first rapid pressure rise, the second and third pressure rises, where the third rise is weak because the wave returns through the second and first chambers. The decay factors for transmission and reflection are (a) for X = 35 mm, ηP1 = 83% and ηP2 = 110%; (b) for X = 25 mm,ηP1 = 80% and ηP2 = 125%; (c) for X = 15 mm, ηP1 = 76% and ηP2 = 130%; respectively. In comparison 1, the transmission decay becomes more effective in the two-stage expansion type than in the one-stage type, and as the connecting duct between two chambers becomes narrower. The reason is considered that expansion waves are generated in the entrances of two chambers and that a narrower duct generates stronger expansion waves. That is to say, the rapid expansion of a duct is effective for decay of blast waves. On the other hand, in comparison 2, the reflective decay becomes larger as the height of the connecting duct becomes smaller. When the above are applied to car


 (1) 0.0 ms (2) 0.250 ms (3) 0.413 ms (4) 0.587 ms
Figure 9. Schlieren photography (X = 15 mm) in two-stage expansion model: pictures (1) and (2) show stage 1 and pictures (3) and (4) show stage 2.
 (a) (b)
 (c)
(c)
Figure 10. Pressure histories in two-stage expansion model. (a) X = 35 mm; (b) X = 25 mm; (c) X = 15 mm.
mufflers, there yields the trade-off relation that the noise reduction effect increases but the pressure wave propagating toward the engine becomes strong, as the connecting duct between two chambers becomes narrower.
4.3. Front-Slope Model
In this case propagation phenomena of blast waves are almost similar to the one-stage model. Figure 11 shows time history of Schlieren photography for the model with front inclination angle α = 45˚. (1) the incident blast wave passes the sensor1; (2) the shock front is diffracted by the expansion wave generated at the corner of the duct and propagated with a pair of vortices formed near the entrance, and the regularly reflective wave is newly generated by the other corner of the slope end; (3) transition seems to occur from the regular to the Mach reflections; and (4) the shock wave is split into two waves: transmission into the outflow duct and reflection upstream at the expansion end.
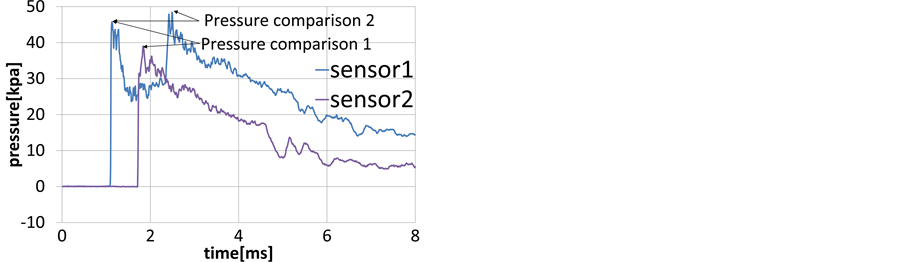
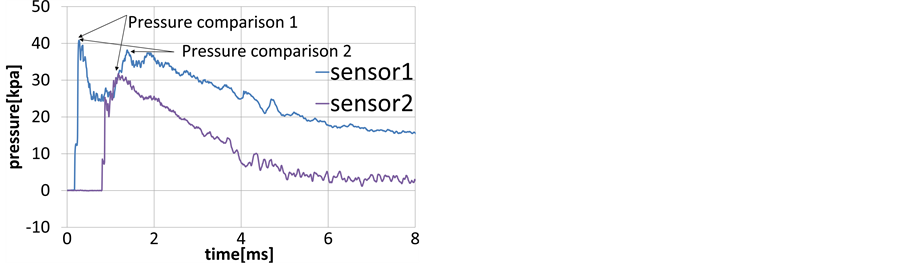
Figures 12(a)-(c) show pressure histories when the inclination angle is changed for α = 15˚, α = 30˚, α = 45˚, respectively. All the wave shapes in sensor 1 show pressure rises in two stage, where the second rise is caused by the reflected shock. The decay factors for transmission and reflection are(a) for α = 15˚, ηP1 = 84% and ηP2 = 100%; (b) for α = 30˚,ηP1 = 86% and ηP2 = 109%; (c) for α = 45˚, ηP1 = 86% and ηP2 = 113%; respectively. In comparison 1, the transmission decay becomes more improved in the front-slope type than in the one-stage type, but there is almost no effect of inclination angles. The reason seems to be related with regeneration of the regular reflection by the corner of the slope end. In comparison 2, as the slope angle becomes larger, the second pressure rise becomes higher with the reflective decay factor larger, which indicates that forward flows are more suppressed with pressure wave propagating toward the engine in the application to the car mufflers.
4.4. One-Stage Expansion Model with Glass Wool
Figure 13(a) and Figure 13(b) show phenomena in time history of Schlieren photography and pressure histories, respectively. In Figure 12(a), (1) the incident blast wave passes the entrance; (2) the shock front propagates; (3) the reflected shock propagates with its intensity weaker, by which the effect of the perforated panel and the acoustic material is expected; (4) in the enlarged view we can see the phenomena that numerous expansion waves are generated from the perforated panel. The reason for generation of expansion waves can be considered as follows: when the shock wave interacts with the perforated panel, the shock wave not only reflects at the panel but also propagates inside holes of the panel; the transmitted wave reflects at the end of each hole as the expansion waves, because the acoustic impedance of material of the panel is higher than that of the air in the cavity, and the reflected expansion wave goes through the end of each hole into the air in the main flow path as the expansion wave. Interaction of expansion wave with the shock front causes pressure drop. Also the acoustic material will cause the pressure drop. The two causes, interaction of the shock wave with the multilayer medium that has different acoustic impedances and effect of the acoustic material, lead to the remarkable effect for the pressure decay. By comparisons 1 and 2, the decay factors for transmission and reflection are evaluated as ηP1 = 59% and ηP2 = 83%, respectively.
4.5. Two-Stage Expansion Model with Glass Wool
Figure 14 shows pressure histories. The decay factors for transmission and reflection are evaluated as ηP1 =71% and ηP2 = 87%, respectively, which also confirms remarkable decay effect for the shock wave.


 (1) 0.0 ms (2) 0.126 ms (3) 0.315 ms (4) 0.488 ms
Figure 11. Schlieren photography (α = 45˚) in front-slope model: pictures (1) and (2) show left half and pictures (3) and (4) show right half.
 (a) (b)
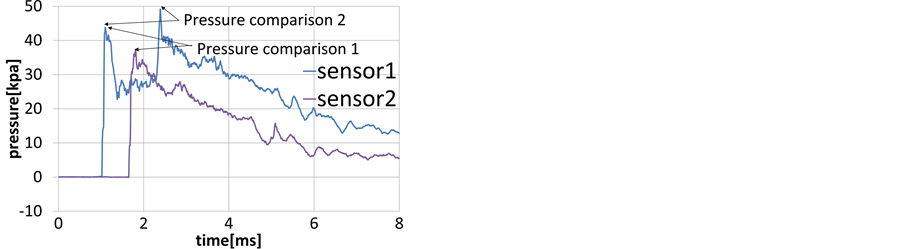 (c)
(c)
Figure 12. Pressure histories in front slope model. (a) α = 15˚; (b) α = 30˚; (c) α = 45˚.


 (a-1) 0.0 ms (a-2) 0.204 ms (a-3) 0.440ms
 (a-4) Enlarged view at 0.204 ms(a)
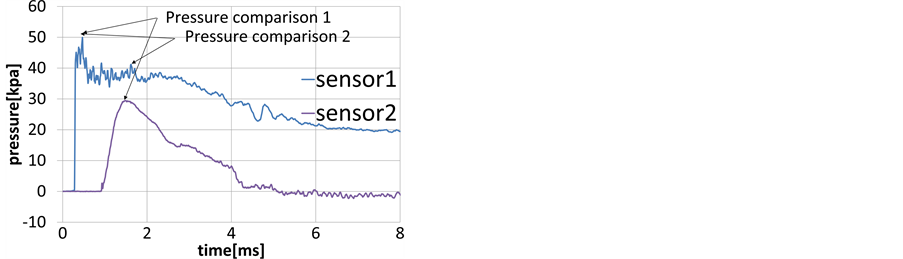 (b)
(b)
Figure 13. One-stage expansion model with glass wool. (a) Schlieren photography: pictures (a-1), (a-2) and (a-4) show left half and picture (a-3) shows right half; (b) Pressure histories.
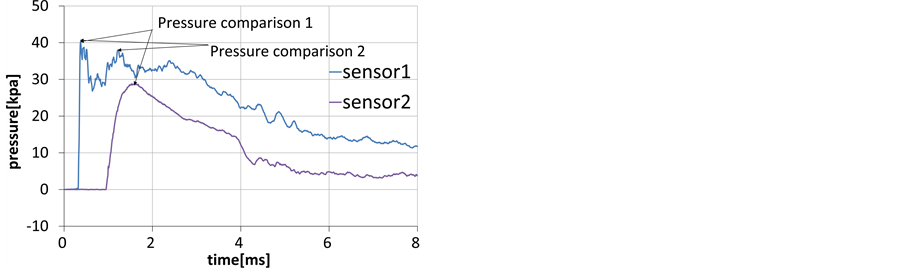
Figure 14. Two-stage expansion model with glass wool.
 (a) (b)
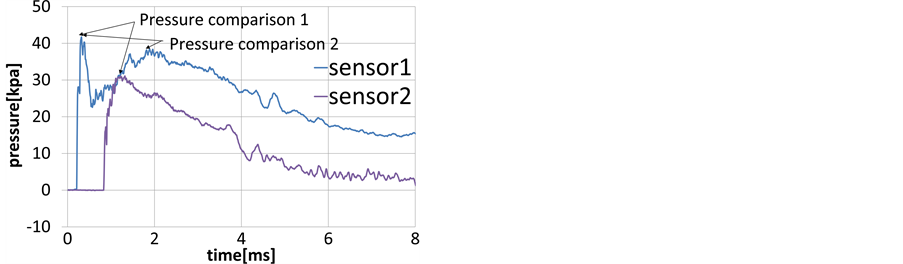 (c)
(c)
Figure 15. Pressure history in front-slope model with rear glass wool. (a) α = 15˚; (b) α = 30˚; (c) α = 45˚.
4.6. Front-Slope Model with Rear Glass Wool
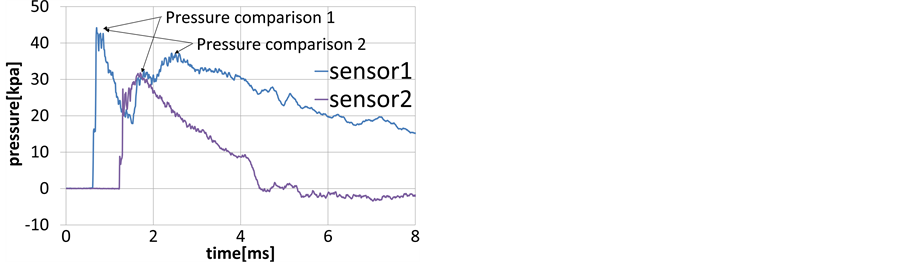
Figures 15(a)-(c) show pressure histories when the front inclination angle is changed. Compared with cases without acoustic material, in sensor 1 all the second pressure rises by the reflection wave in sensor 1 become less steep and lower, and in sensor 2 all the pressure rises at shock front in sensor 2 become lower, which shows decay effect for shock waves by acoustic material. The decay factors for transmission and reflection are(a) for α = 15˚, ηP1 = 71% and ηP2 = 84%; (b) for α = 30˚, ηP1 = 78% and ηP2 = 96%; (c) for α = 45˚, ηP1 = 74% and ηP2 = 91%; respectively.
4.7. Summary for Decay Factors
Table 1 summarizes the decay factors for transmission and reflection of a blast wave in the models presented here. Without the acoustic material, the two-stage expansion and front-slope models make the transmission decay factor decrease but the reflective decay factor increase, compared with the one-stage model. The acoustic material makes both decay factor decrease.

Table 1. Summary of decay factors for transmission and reflection of blast wave.
5. Conclusions
With regard to configurations, for transmission decay of a blast wave, two-stage expansion and front-slope types have enhanced effects, compared with a one-stage type, whereas for reflective decay, any type does not show attenuation effects:
1) In the two-stage expansion type, the narrower the connecting duct, the better the transmission decay.
2) In the front-slope type, any slope angle has constant effect for the transmission decay.
With regard to use of acoustic material, the remarkable decay effects have been confirmed for both transmission and reflection:
1) The highest decay factor for transmission is recorded by the one-stage expansion type with acoustic material.
2) The acoustic material also restrains the intensity of the reflective shock wave propagating upstream toward the inflow duct.
Acknowledgements
The authors would like to express their sincere gratitude to Dr. Ichiro Sakamoto, National Traffic Safety and Environment Laboratory, for his sincere advice on the present study, to Mr. Kazutoshi Higuchi, JFD Engineering Corporation, for his advice on the experimental devices, and also to reviewers for their fruitful suggestions, above all, interpretation of phenomena and discussion on the pressure drop from the viewpoint of multilayer medium.
Cite this paper
Motonobu Ishiguro,Kenji Shinkai,Ryo Shimamura,Hironobu Gunji,Yoko Takakura, (2016) Attenuation Effect of Expansion Configuration and Acoustic Material on Propagation of Blast Waves in a Duct. Journal of Flow Control, Measurement & Visualization,04,79-92. doi: 10.4236/jfcmv.2016.43008
References
- 1. Takubo, S., Matsumoto, H. and Hariu, N. (2012) Visualization of the Noise Generates Internal Devices of the Automotive Exhaust System. Proceedings of the 51st Conference of the Japan Society of Mechanical Engineers, Hokkaido Branch, Kitami, 20th October, 2012, 193-194.
- 2. Sekine, N., Matsumura, S., Takayama, K., Ono, O. and Itoh, K. (1988) Initiation and Propagation of Shock Waves in the Exhaust Pipe of an Internal Combustion Engines. Transaction of the Japan Society of Mechanical Engineers (Series B), 54, 527-531. http://dx.doi.org/10.1299/kikaib.54.527
- 3. Sakamoto, I., Higashino, F. and Higuchi, K. (2001) Decay of Pressure Waves Passing through Expansion Region in a Two Dimensional Duct. Transaction of the Japan Society of Mechanical Engineers (Series B), 67, 1170-1176. http://dx.doi.org/10.1299/kikaib.67.1170
- 4. Kanai, T. (1960) Investigation of Silencing Characteristics of Mufflers (1st Report, Silencing Characteristics for Pure Sound). Transaction of the Japan Society of Mechanical Engineers (Series 2), 26, 1183-1191.
- 5. Kanai, T. (1960) Investigation of Silencing Characteristics of Mufflers (2nd Report, Silencing Characteristics for Exhaust Noise). Transaction of the Japan Society of Mechanical Engineers (Series 2), 26, 1191-1197.
- 6. Izumi, H., Kojima, N. and Fukuda, M. (1984) Study on Silencers with Airflow (2nd Report). Transaction of the Japan Society of Mechanical Engineers (Series B), 50, 1879-1887. http://dx.doi.org/10.1299/kikaib.50.1879
- 7. Matsumura, S., Onodera, O., Ito, K. and Takayama, K. (1990) Shock Wave Formation in the Exhaust Pipe of an Internal Combustion Engine. Transaction of the Japan Society of Mechanical Engineers (Series B), 56, 3786-3791. http://dx.doi.org/10.1299/kikaib.56.3786
- 8. Sekine, N., Onodera, O. and Takayama, K. (1994) Study of Silencer Characteristics in a Gas Flow with Shock Wave (1st Report, Propagation of Shock Wave in the Silencer). Transaction of the Japan Society of Mechanical Engineers (Series B), 60, 2315-2320. http://dx.doi.org/10.1299/kikaib.60.2315
- 9. Sekine, N., Onodera, O. and Takayama, K. (1995) Study of Silencer Characteristics in a Gas Flow with Shock Wave (2nd Report, Pressure Characteristics of Silencer). Transaction of the Japan Society of Mechanical Engineers (Series B), 61, 1252-1257. http://dx.doi.org/10.1299/kikaib.61.1252
- 10. Kojima, T., Yang, N. and Gakumasawa, H. (2006) Study on the Reduction of the Shock Waves of Flow in Silencer. Research Reports of the School of Engineering, Kinki University, 40, 127-134.
- 11. Namiki, T., Shimamura, R., Ohki, K. and Takakura, Y. (2014) Rupturing Device and Generation Characteristics of Shock and Blast Waves. Proceedings of the Symposium on Shock Waves in Japan, Sagamihara, 5th March 2014, P-04 (USB).
- 12. Liepmann, H. W. and Roshko, A. (1960) Elements of Gasdynamics. John Wiley and Sons, Inc., New York.
- 13. LeVeque, R.J. (1992) Numerical Methods for Conservation Laws. Birkhäuser, Basel. http://dx.doi.org/10.1007/978-3-0348-8629-1
- 14. Toro, E.F. (1997) Riemann Solvers and Numerical Methods for Fluid Dynamics. Springer, Berlin Heidelberg. http://dx.doi.org/10.1007/978-3-662-03490-3
- 15. JIS B 8379 (2009) Silencer for Air Pressure.
- 16. Takiya, T., Higashino, F., Terada, Y., Komura, A., Sugiyama, H. and Ando, M. (1998) Geometrical Effects of Baffle Plates on Shock Wave Decay in a Synchrotron Radiation Beamline. Transaction of the Japan Society of Mechanical Engineers (Series B), 64, 1720-1724. http://dx.doi.org/10.1299/kikaib.64.1720
- 17. Park, J.-W. and Kim, J.-S. (2014) Feasibility of Shock Attenuation by Simple Obstacles in Mitigating Severe Accident Explosive Loads. Annals of Nuclear Energy, 70, 109-121. http://dx.doi.org/10.1016/j.anucene.2014.03.012
- 18. Ben-Dor, G. (1992) Shock Wave Reflection Phenomena. Springer, New York. http://dx.doi.org/10.1007/978-1-4757-4279-4
Nomenclature
a: sound speed
cS: speed of shock wave
D: height of expansion region
d: height of inflow and outflow duct
L: length of expansion region
lH: length of high-pressure section
lL: length of low-pressure section
p: pressure
R: gas constant
T: temperature
t: time
u: velocity
X: height of central duct in two-stage expansion model (Figure 6)
x: spatial coordinate with origin at initial discontinuity, i.e., location of diaphragm
α: inclination angle in front-slope model (Figure 6)
(ΔPin)max: maximum pressure rise of the incident wave (detected at sensor 1)
(ΔPout)max: maximum pressure rise of the transmissive wave (detected at sensor 2)
(ΔPref)max: maximum pressure rise of the reflected wave (detected at sensor 1)
γ: ratio of the specific heats
ηP1: decay factor for transmission
ηP2: decay factor for reflection
NOTES

*Corresponding author.