Journal of Flow Control, Measurement & Visualization
Vol.04 No.04(2016), Article ID:70533,18 pages
10.4236/jfcmv.2016.44012
Grid Convergence Property of Three-Dimensional Measurement-Integrated Simulation for Unsteady Flow behind a Square Cylinder with Karman Vortex Street
Takayuki Yamagata1, Toshiyuki Hayase2*
1Visualization Research Center, Niigata University, Niigata, Japan
2Institute of Fluid Science, Tohoku University, Aoba-ku Sendai, Japan

Copyright © 2016 by authors and Scientific Research Publishing Inc.
This work is licensed under the Creative Commons Attribution International License (CC BY 4.0).
http://creativecommons.org/licenses/by/4.0/


Received: March 28, 2016; Accepted: July 3, 2016; Published: September 13, 2016
ABSTRACT
The purpose of this study was to clarify grid convergence property of three-dimen- sional measurement-integrated (3D-MI) simulation for a flow behind a square cylinder with Karman vortex street. Measurement-integrated (MI) simulation is a kind of the observer in the dynamical system theory by using CFD scheme as a mathematical model of the system. In a former study, two-dimensional MI (2D-MI) simulation with a coarse grid system showed a fairly good result in comparison with a 2D ordinary (2D-O) simulation, but the results were degraded with grid refinement. In this study, 3D-MI simulation and three-dimensional ordinary (3D-O) simulation were performed with three grid systems of different grid resolutions, and their grid convergence properties were compared. As a result, all 3D-MI simulations reproduced the vortex shedding frequency identical to that of the experiment, and the flow fields obtained were very close, within 5% difference between the results, while the results of the 3D-O simulations showed variation of the solution under convergence. It is shown that the grid convergence property of 3D-MI simulation is
1-1a
Keywords:
Measurement-Integrated Simulation, Grid Convergence, Square Cylinder, Flow Measurement, Numerical Simulation, Pressure Measurement, Flow Observer, Karman Vortex

1. Introduction
Both numerical simulation and measurement are essential techniques in analyses of flow problems. Flow measurement provides the actual property of a flow such as velocity and pressure within the range of measurement precision, but they are usually limited to partial information of the flow. Numerical simulation, therefore, plays an important role in elucidating the detailed structure of a flow. The numerical simulation yields detailed velocity and pressure fields of the flow, but its reliability depends on boundary and initial conditions as well as unknown disturbances. Therefore, neither numerical simulation nor measurement is expected to reproduce “real flows” exactly.
In order to reproduce real flows correctly, many studies have been conducted by integrating numerical simulation and measurement [1] . Combining particle tracking veloci- metry (PTV) and direct numerical simulation (DNS) with a linear combination, Suzuki et al. have developed a method that obtains unmeasurable quantities of an unsteady flow such as pressure fields and vorticity distributions [2] , and have evaluated the data-assimi- lation capabilities of the method [3] . Buffoni et al. have proposed an estimation method of a velocity field based on a non-linear low-dimensional model of the flow with velocity or shear stress measurement, treating an unsteady flow around a square cylinder with a low Reynolds number [4] . Recently, the methodology combining measurement and simulation has been used to obtain the velocity in regions where no velocity information is available in particle image velocimetry (PIV) [5] , and to estimate time-resolved velocity fields from non-time-resolved PIV data [6] . The present authors have also studied measurement-integrated (MI) simulation, which is a kind of the state observer in dynamical system theory employing the CFD scheme as a model instead of a linear differential equation [7] [8] . The validity of the MI simulation has been shown for several flow related problems. Conducting a numerical experiment of a developed turbulent flow in a square duct, Hayase and Hayashi [7] have shown that the MI simulation converges to the model solution of the real flow by adding pressure difference into the numerical simulation as feedback signals. As a medical application, Funamoto et al. [9] conducted the MI simulation of a blood flow using Doppler velocity measurement of medical ultrasonography, showing the complex blood flow velocity field in an aneurism.
The flow treated herein is a wake flow behind a square cylinder in a confined wind tunnel. Flows around bluff bodies provide fundamental problems in many engineering applications such as basic flow for vehicles and large structures, including important phenomena such as vortex shedding. A number of studies on the flow around cylinders have been conducted numerically and experimentally. The critical Reynolds number has been investigated in flows around circular [10] - [12] and rectangular [13] - [15] cylinders in which vortex shedding from two-dimensional bluff bodies reveals three-di- mensional behavior. Turbulent wake flow behind a bluff body is also the subject of intense scrutiny and has been studied experimentally and numerically [16] . Recently, large-scale computations such as LES of a turbulent wake [17] [18] and simulation of three-dimensional vortical structures behind two square cylinders [19] [20] have been performed. Traditional studies gave priority to clarifying the relation between some flow parameters and flow phenomena, investigating the Strouhal-Reynolds number relation experimentally and numerically in a wide range of Reynolds number [21] . Davis et al. [22] and Sohankar et al. [23] have reported that the Strouhal number is influenced by many parameters, i.e., the aspect ratio of a rectangular cylinder, blockage and inlet/outlet boundary conditions, as well as Reynolds number. As mentioned above, it is difficult to obtain exact boundary and initial conditions of a real flow. Therefore, predicting the shedding frequency of the Karman vortex, which is fundamental characteristic of the wake flow, is difficult if based only on numerical simulation under non- controlled flow conditions. In contrast, the MI simulation reproduced the vortex shedding frequency and the velocity fluctuation of the experimental flow by using measured pressure under unknown boundary conditions in a previous study [24] . In a two-di- mensional analysis of a Karman vortex street behind a square cylinder, Nisugi et al. [25] developed a hybrid wind tunnel, an on-line flow analysis system, by integrating numerical simulation and wind tunnel experiment based on the MI simulation, and showed that the MI simulation reproduces the velocity fluctuation and the shedding frequency of the Karman vortex in the case of a relatively low Reynolds number of 1200, even with a coarse grid system. In addition, allowing us to use a coarse grid system, the MI simulation has been able to reproduce a real flow in real time. The reproduced pressure fields have shown good agreement with measured pressure on the sidewall of a wind tunnel [26] . If the reproduction of the detailed information of real flows becomes possible in real time, it would be expected that the control of the flow behind bluff bodies [27] [28] can be performed with high accuracy. In a recent paper, we have reported that the increase of feedback data is effective to improve the reproducibility of the velocity field by integrating numerical simulation and particle image velocimetry [29] . However, previous studies of the MI simulation in a hybrid wind tunnel were performed in two-dimensional analysis and the reproducibility of three-dimensional flow was not investigated. In addition, the MI simulation with a coarse grid system showed good agreement with the experiment, but the simulation with a fine grid system resulted in an increase of the error of the velocity fluctuation in a previous two-dimensional study [25] . Therefore, the influence of grid resolutions on the reproducibility of a flow needs to be investigated in three-dimensional analysis of the MI simulation.
The purpose of this study was to clarify the grid convergence property of a three- dimensional measurement-integrated (3D-MI) simulation for a flow behind a square cylinder with a Karman vortex street for a relatively low Reynolds number. 3D-MI simulation and three-dimensional ordinary (3D-O) simulation were performed and their grid convergence properties were investigated by comparing with those of laser Doppler velocimetry (LDV) measurement and previous two-dimensional (2D) analysis. Some results were discussed from fluid dynamic point view for instantaneous 3D flow structure and variations of lift and drag coefficients.
2. Methods
2.1. Experimental Apparatus
A hybrid wind tunnel is an on-line flow analysis system, which integrates numerical simulation and flow measurement. Figure 1(a) shows the configuration of the system, including a process flowchart of the MI simulation. The system consists of a wind tunnel with a square cylinder, pressure sensors (SSK, DP8A-2, 20 Pa, resonant frequency 260 Hz), a workstation (SGI, OCTAIN, 300 MHz, 2 CPU) and a supercomputer (SGI, Silicon Graphics Prism, 1.6 MHz, 128 CPU). The appearance of the experimental apparatus is shown in Figure 1(b), in which the square cylinder is placed in the wind tunnel on the left side and the pressure sensors are seen in the upper left. On the monitor of the workstation, a reproduced pressure field is visualized in real time.
The geometry of the wind tunnel is shown in Figure 2. The wind tunnel is a square duct made of acrylic plastic with a length of 2510 mm and a cross section of 200 × 200 mm. The square cylinder with a cross section of 30 × 30 mm is made of aluminum and is placed at 515 mm downstream from the inflow boundary. We define Cartesian coordinate system O-xyz with an origin at the center of the cylinder and corresponding velocity components as, u, v and w. As a flow straightening device, a filter (Bridgestone, Everlight SR-HR-13, 30 mm in width) is placed at the inflow boundary and steel meshes

 (a) (b)
Figure 1.Configuration of hybrid wind tunnel: (a) schematic diagram; (b) experimental apparatus.

Figure 2. Geometry of wind tunnel and computational domain (units in mm).
(5 mm in mesh size, 1 mm in thickness) are placed at 205 mm (upstream side) and 105 mm (downstream side) from both ends of the wind tunnel. The flow is made by suction with an air blower (Nishimuradenki, NK-200), which is connected to the outflow boundary of the wind tunnel through a flexible tube (inner diameter of 175 mm). The flow rate of the air blower is controlled by an inverter (Mitsubishidenki, FR-520-1.5 K). Pressure at the front and the both sides of the cylinder is measured to provide the information of the real flow for the numerical simulation (see Figure 3). Pressure holes are located at the middle of the surfaces and are connected with the pressure sensors through a copper tube with a diameter of 3 mm and a length of 200 mm and a plastic tube with a diameter of 8 mm and a length of 200 mm. The resonant frequency of the tube is estimated to be 430 Hz under the assumption of a closed air column. Output signals of the pressure sensors are imported into the workstation with an analog-digital converter (VMIC, MVIPCI-3322, 1000 Hz, 16 bit) through a low-pass filter (NEC SANEI, 9B02, 10 Hz) to extract signals corresponding to vortex shedding. In the workstation, electric noises of the signals are suppressed by a digital low-pass filter (IIR-filter, Butterworth, 20 Hz) and the signals are transferred to a supercomputer with socket communication. The uncertainty in the pressure measurement was estimated to be 6%. Major error comes from sensor drift and electrical noise. Using the pressure signals, the MI simulation is performed on the supercomputer to obtain a solution corresponding to the real flow. Details of the MI simulation are described in the next section. The result of the MI simulation is transferred to the workstation and the flow field is visualized. In a previous study, the MI simulation was performed in two-dimensional analysis and the operation described above was performed in real time [8] . In the present study, we dealt with three-dimensional analysis, and the MI simulation was performed off-line with pre-measured pressure because of increased computational time.
2.2. Measurement-Integrated Simulation
Governing equations of MI simulation are the Navier-Stokes equation with a body force term (1) and the pressure Equation (2) for incompressible fluid.

Figure 3. Details of the square cylinder.
 (1)
(1)
 (2)
(2)
The difference between MI simulation and ordinary simulation is the existence of the artificial body force f, which is a feedback signal derived from the difference between computed result and measurement data. Determination of the feedback signal is the key for the MI simulation design.
Since this study focused on the Karman vortex street, the measurement data are defined as the pressure on the both sides of the cylinder relative to the stagnation pressure (see Figure 3). Feedback forces FA and FB are added in the streamwise momentum equation at the control volumes in the upstream side of the pressure nodes. The forces are calculated proportional to the difference between the measured pressures ,
,  and computed ones PAS, PBS as follows [26] :
 , (3)
, (3)
where K* is the feedback gain (non-dimensional); ΔV is a control volume and L is a reference length (cylinder width D = 30 mm). Streamwise flows at the feedback points are accelerated or decelerated by the artificial forces FA, FB to reduce the difference between the measured pressure and the calculated one. It should be noted that the feedback forces are virtual forces to reduce the error of the numerical simulation. In previous two-dimensional analysis, the middle plane of the wind tunnel was treated, and pressures on the cylinder were measured in the plane for calculation of feedback forces. In present study, the feedback forces calculated in the middle plane were applied to all feedback points along span-wise direction corresponding to the feedback law of the two-dimensional analysis (see Figure 3).
2.3. Computational Conditions
The governing equations were discretized with the finite volume method and solved with an algorithm similar to the SIMPLER method. The computational domain considered for analysis is shown in Figure 2. Dimensions related to the domain are, respectively, 37.0D in the streamwise direction, 6.7D in the wall-normal and the span-wise directions. Three staggered grid systems in the Cartesian coordinate were employed. The numbers of grid points were, respectively, Nx × Ny × Nz = 111 × 21 × 21 (grid A), 222 × 42 × 42 (grid B) and 444 × 84 × 84 (grid C). In a coarse grid system (grid A), the grid spacing was defined as hx = hy = hz = D/3, and the non-uniform meshes were partially employed near the sidewall of the wind tunnel in the wall-normal and span-wise directions to match the position of the sidewall. Although the present grid system is too coarse for ordinary simulation, the two-dimensional analysis in the previous study revealed that the velocity field of the Karman vortex street was correctly reproduced with this grid system [24] . The uniform velocity profile with U = 0.605 m/s, corresponding to the Reynolds number Re = 1200 of previous studies [24] - [26] , was applied at the inflow boundary. The convective boundary condition was used at the outflow boundary. The time step of computation was set as Δt = 0.01 s (non-dimensional time step 0.2). The frequency of the Karman vortex shedding was fs = 2.81 Hz at the Reynolds number of 1200 in wind tunnel experiment. The optimal feedback gain was so determined that the calculated pressure at the feedback point best agrees with the measured one. The gains determined by test computations were K* = 5.4 for grid A, K* = 10.8 for grid B and K* = 21.6 for grid C. The case of null feedback gain K* = 0.0 is equivalent to the ordinary numerical simulation without the feedback mechanism. Computational conditions for all grid systems are summarized in Table 1. The relative CPU time in the table means the computational time relative to the one of the coarse grid A. The CPU time for the fine grid C is 55 times that for the coarse grid A with twice the number of CPUs.
3. Results and Discussion
To evaluate the grid convergence of the 3D-MI simulation, 3D-MI and 3D-O simulations were performed with the above-mentioned three grid systems. Figure 4(a) compares the time histories of pressure at the feedback point A (see Figure 3) between the 3D-O simulations and measurement. The measured pressure oscillates periodically corresponding to the vortex shedding from the square cylinder. The ordinary simulation with the coarse grid A and middle grid B fails to reproduce the pressure oscillation because the grid resolutions are insufficient for the ordinary simulation. The pressure oscillation of fine grid C shows nearly the same amplitude as that of the measurement, but is naturally out of phase with that of the measurement. Figure 4(b) shows the corresponding results for the 3D-MI simulations. All MI simulations show in-phase oscillation with the measurement and good agreement in the amplitude. The effects of the feedback forces are especially seen in the results of the coarse grid A. Large feedback force appears in coarse grid A due to a large control volume, whereas the feedback gain is small.

Table 1. Computational condition.
The frequencies of the vortex shedding are compared among computations and experiment. Figure 5 shows the Strouhal numbers (St = f D/U) calculated from the vortex shedding frequencies with the grid spacing. The Strouhal number evaluated from the pressure measurement experiment is St = 0.14, which is almost the same as that of the previous research by Davis et al. St = 0.15 [22] . The results of two-dimensional (2D) analysis in the former study are also plotted in the figure. The former two-dimensional ordinary (2D-O) simulation fails to reproduce the vortex shedding frequency even with the fine grid system. The reason for this is that the 2D model of simulation is inappropriate for the reproduction of the 3D real flow phenomenon. The 3D-O simulation with fine grid C improves the reproducibility of the shedding frequency more than does the 2D-O simulation, but the difference still exists, probably due to the difference of the inlet boundary condition between the simulation and the experiment. A uniform inlet velocity profile is assumed in the simulations, but non-uniformity is inevitable in the experiment. Davis et al. [22] have numerically and experimentally demonstrated that

 (a) (b)
Figure 4. Time histories of pressure at the feedback point: (a) 3D-O simulation; (b) 3D-MI simulation.

Figure 5. Strouhal number with grid spacing.
the shedding frequency of the Karman vortex is affected by the upstream velocity profile. On the other hand, both 2D- and 3D-MI simulations reproduce the Strouhal number exactly identical to that of the experiment in all the grid systems.
Grid convergence was also investigated for distributions of the mean streamwise velocity and its fluctuation in comparison with the laser Doppler velocimetry (LDV) measurement in former work [24] . LDV equipment (TSI, LDP 100) consists of an optical head (diode laser power 50 mW, wavelength 690 nm, beam spacing 50 mm, focal length 250 mm) and a digital signal processor (Doppler frequency range 100 Hz to 75 MHz, downmix frequency 40 MHz). Oil mist with an average diameter of 1 μm was supplied by a fog generator (DANTEC, 2010). The number of valid data obtained in LDV processing was about 500 samples per second. In total, 413 measurement points were arranged in the middle plane of the wind tunnel, and the streamwise velocity was measured around the cylinder −3.5D ≤ x ≤ 4.5D at an interval of 0.33D and downstream 4.5D ≤ x ≤ 14.5D at an interval of 1.0D. Figure 6(a) shows the distribution of the mean streamwise velocity with a recirculation area behind a square cylinder. Figure 6(b) shows the distribution of the streamwise velocity fluctuation with two peaks due to the vortex shedding behind the cylinder. Both distributions show asymmetry due to non-uniformity of the inflow velocity distribution which was generated through the filter and the steel mesh mentioned in Section 2.1.
Figure 7 compares distributions of the mean streamwise velocity um between 3D-O simulations (left) and 3D-MI simulations (right) with coarse grid A, middle grid B and fine grid C. The mean streamwise velocities um are calculated for 20 s for grids A and B, and 10 s for grid C in steady oscillation, and are normalized by averaged inflow velocity U. Ordinary simulations with grid A and grid B show recirculation areas extending downstream to 6D and 4D, respectively, due to the poor grid resolution. The mean velocity field with grid C agrees with the experiment of Figure 6(a). In contrast, the MI simulations with grid A and grid B significantly improve the size of the recirculation area in comparison with the ordinary simulation. The result of MI simulation with grid C is almost the same as that of the ordinary simulation.
Figure 8 compares distributions of the root-mean-square values of the streamwise velocity fluctuations urms between 3D-O simulations (left) and 3D-MI simulations (right) with the three grid systems. These values are evaluated in the time intervals and

 (a) (b)
Figure 6. Experimental velocity field: (a) mean velocity um; (b) velocity fluctuation urms.

Figure 7. Comparison of mean velocity um: 3D-O simulation (left); 3D-MI simulation (right): (a) Grid A; (b) grid B; (c) grid C.
normalized by the averaged inflow velocity in the same manner as those for the mean streamwise velocities. The ordinary simulations with grid A and B show the peaks of the velocity fluctuation far downstream around x = 7D and 4D. The ordinary simulation with grid C correctly represents the peaks of the velocity fluctuation at x = 1.5D corresponding to the experiment (Figure 6(b)). The MI simulations with grid A and B improve the position of the peaks of the velocity fluctuations. The results of the MI simulation with grid B is almost the same as those of the MI simulation and the ordinary simulation with grid C. In the former two-dimensional analysis, excessive velocity fluctuation appeared in the downstream region for fine grid C [24] , whereas the excessive velocity fluctuation was not seen in the present three-dimensional analysis.
To evaluate the reproducibility of the velocity field quantitatively, we define the error norm as follows.
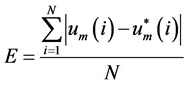 (4)
(4)
where  and
and  are time averaged values of the computation and LDV measurement for streamwise velocity or its fluctuation; i is grid index; and N is the number of the data in the domain. Figure 9(a) shows the error norm of the mean streamwise velocity umean with grid spacing including the results of the former two-dimensional analysis

Figure 8. Comparison of velocity fluctuation u’rms: 3D-O simulation (left); 3D-MI simulation (right): (a) grid A; (b) grid B; (c) grid C.

Figure 9. Error norm with respect to experiment: (a) mean velocity; (b) velocity fluctuation.
(broken lines). In the 3D-O simulation (open triangle), the error norm strongly depends on the grid spacing. The error norm of the coarse grid A is 18% and it linearly decreases to 8% of fine grid C. In contrast, the error norm of the 3D-MI simulation (close triangle) is almost independent of the grid spacing in the present condition. The 3D-MI simulation with coarse grid A shows the level of error as those of the 3D-MI and 3D-O simulations with fine grid C. In the results of two-dimensional analysis (broken line), the difference between the 2D-MI simulation and the 2D-O simulation is not so significant as the 3D case. The error norms of the 2D-MI and 2D-O simulations decrease with grid refinement. As for the error norm of the streamwise velocity fluctuations in Figure 9(b), the errors of 3D-O simulation decrease with increasing grid resolution from 8% of grid A to 4% of grid C. Similar to the former mean streamwise velocity case, the 3D-MI simulation is less sensitive to the grid resolution. The error norm of grid A is 5%, almost the same level as fine grid C. The 2D-O and 2D-MI simulations show a substantial increase of the error norm with improving grid resolutions. For coarse grid A, error norms are almost the same between 2D- and 3D-MI simulations or between 2D- and 3D-O simulations, but they deviate with grid refinement. Consequently, the grid convergence property of the 3D-MI simulation is monotonic and better than that of the 3D-O simulation due to the effect of the feedback signal, whereas those of 2D-O and 2D-MI simulations for streamwise velocity fluctuation are divergent due to the incapability to represent 3D effect.
In the followings, some results are discussed from fluid dynamic point view for instantaneous 3D flow structure and variations of drag and lift coefficients.
We compare instantaneous flow structures obtained by the 3D-MI simulation with coarse grid A with those with fine grid C. Figure 10(a) shows the iso-surfaces of instantaneous u (left), v (middle) and w (right) velocity distributions for the 3D-MI simulation
 (a)
(a) (b)
(b)
Figure 10. Isosurfaces of the velocity components u (left, gray = 1.5, dark gray = 0.9), v (center, gray = −0.4, dark gray = 0.4) and w (right, gray = −0.2, dark gray = 0.2) of the MI simulation: (a) grid C; (b) grid A.
with fine grid C. Figure 10(b) shows the corresponding results with coarse grid A. All the velocity components are normalized by the averaged inflow velocity U. The quasi two-dimensional flow structure corresponding to the Karman vortex street appears behind the cylinder in these results. It was revealed that the 3D-MI simulation with the coarse grid A is capable of reproducing the large flow structure of the Karman vortex street obtained with fine grid C.
Instantaneous flow fields are compared in more detail in Figure 11. Figure 11(a) shows velocity distributions on the middle planes perpendicular to the cylinder (upper) and parallel to the cylinder (lower) for the u (left), v (middle) and w (right) velocities

Figure 11. Distribution of the velocity components u (left), v (middle) and w (right) of the MI simulation on x-y plane (upper) and x-z plane (lower): (a) grid C; (b) grid A.
for the MI simulation with fine grid C. The contours of u and v velocities in the above figure represent the existence of the vortex shedding. In the figure of w, the flows heading to the middle of the wind tunnel appear periodically from connections between the cylinder and wind tunnel walls. Figure 11(b) shows the corresponding results of the 3D-MI simulation with coarse grid A. In the upper figures, large structures of u and v velocity components are well reproduced although the w velocity component is rather weak. In the lower figures, the results of u and v velocity components are symmetric on the centerline, while that of w is anti-symmetric. The distribution of u velocity is qualitatively the same as that of fine grid C although the recirculation area behind the cylinder is somewhat larger. Large structures of the v and w velocity distributions were also reproduced properly. Difference between the results of two grids seems more significant for w velocity in comparison with those of the other velocity components probably because the magnitude of the w velocity is smaller than those of the others.
Figure 12 shows time histories of drag and lift coefficients for the square cylinder obtained from the coarse gird 3D-MI and 3D-O simulations to be compared with that of the fine grid 3D-MI simulation. In Figure 12(a) the drag coefficient of the coarse grid 3D-O simulation is 1.6 and that of the coarse grid 3D-MI simulation is 2.2 in time average, which is close to that of the fine grid 3D-MI simulation of 2.4. Note that the drag coefficient of the fine grid 3D-MI simulation is slightly higher than the experimental value of 2.1 [22] , probably due to the difference of the inlet boundary condition and blockage ratio. The coarse grid 3D-MI simulation, however, fails to reproduce the fluctuation of the drag. This is probably attributable to the fact that the coarse grid 3D-MI simulation cannot reproduce the detachment of the recirculation area from the cylinder (see Figure 11(a) and Figure 11(b)). In Figure 12(b), the coarse grid 3D-O simulation does not reproduce the oscillation of the lift coefficient, but the result of the coarse grid 3D-MI simulation agrees with that of the fine grid MI simulation.
4. Conclusion
The purpose of this study was to clarify grid convergence property of 3D-MI simulation


Figure 12. Time histories of aerodynamic coefficients of the 3D-MI and 3D-O simulations: (a) drag coefficient; (b) lift coefficient.
for a flow behind a square cylinder with Karman vortex street. 3D-MI and 3D-O simulations were performed with three grid systems of different grid resolutions. All 3D-MI simulations reproduced the vortex shedding frequency exactly identical to that of the experiment, and the flow fields obtained were very close, within a difference of 5% between the results, while the results of the 3D-O simulations showed variation of the solution under grid convergence. It is shown that the grid convergence property of 3D-MI simulation is monotonic and better than that of 3D-O simulation, whereas those of 2D-O and 2D-MI simulations for streamwise velocity fluctuation are divergent. The solution of 3D-MI simulation with relatively coarse grid system properly reproduces the basic three-dimensional structure of the wake flow as well as the drag and lift coefficients. In this study, the relatively low Reynolds number of 1200 was treated in order to investigate fundamental grid convergence property of the 3D-MI simulation in comparison with the former 2D-MI simulation and experiment. Fully turbulent flow at higher Reynolds number is an important issue in practical applications, which is our future work.
Acknowledgements
This work was partly supported by the JSPS Core-to-Core Program, a Advanced Research Networks, “International research core on smart layered materials and structures for energy saving”, and a collaborative research project of Institute of Fluid Science, Tohoku University.
Cite this paper
Yamagata, T. and Hayase, T. (2016) Grid Convergence Pro- perty of Three-Dimensional Measurement- Integrated Simulation for Unsteady Flow behind a Square Cylinder with Karman Vortex Street. Journal of Flow Control, Measurement & Visualization, 4, 125-142. http://dx.doi.org/10.4236/jfcmv.2016.44012
References
- 1. Hayase, T. (2015) Numerical Simulation of Real-World Flows. Fluid Dynamics Research, 47, Article ID: 051201. http://dx.doi.org/10.1088/0169-5983/47/5/051201
- 2. Suzuki, T., Ji, H. and Yamamoto, F. (2009) Unsteady PTV Velocity Field Past an Airfoil Solved with DNS: Part 1. Algorithm of Hybrid Simulation and Hybrid Velocity Field at Re = 10^3. Experiments in Fluids, 47, 957-976. http://dx.doi.org/10.1007/s00348-009-0691-9
- 3. Suzuki, T. and Yamamoto, F. (2015) Hierarchy of Hybrid Unsteady-Flow Simulations Integrating Time-Resolved PTV with DNS and Their Data-Assimilation Capabilities. Fluid Dynamics Research, 47, Article ID: 051407.
- 4. Buffoni, M., Camarri, S., Iollo, A., Lombardi, E. and Salvetti, M.V. (2008) A Non-Linear Observer for Unsteady Three-Dimensional Flows. Journal of Computational Physics, 227, 2626-2643. http://dx.doi.org/10.1016/j.jcp.2007.11.005
- 5. Sciacchitano, A., Dwight, R.P. and Scarano, F. (2012) Navier-Stokes Simulations in Gappy PIV Data. Experiments in Fluids, 53, 1421-1435. http://dx.doi.org/10.1007/s00348-012-1366-5
- 6. Tu, J.H., Griffin, J., Hart, A., Rowley, C.W., Cattafesta, L.N. and Ukeiley, L.S. (2013) Integration of Non-Time-Resolved PIV and Time-Resolved Velocity Point Sensors for Dynamic Estimation of Velocity Fields. Experiments in Fluids, 54, 1429.
- 7. Hayase, T. and Hayashi, S. (1997) State Estimator of Flow as an Integrated Computational Method with the Feedback of Online Experimental Measurement. Journal of Fluids Engineering-Transactions of the ASME, 119, 814-822. http://dx.doi.org/10.1115/1.2819503
- 8. Hayase, T. (2015) A Review of Measurement-Integrated Simulation of Complex Real Flows. Journal of Flow Control, Measurement & Visualization, 3, 51-66. http://dx.doi.org/10.4236/jfcmv.2015.32006
- 9. Funamoto, K., Hayase, T., Shirai, A., Saijo, Y. and Yambe, T. (2005) Fundamental Study of Ultrasonic-Measurement-Integrated Simulation of Real Blood Flow in the Aorta. Annals of Biomedical Engineering, 33, 415-428. http://dx.doi.org/10.1007/s10439-005-2495-2
- 10. Williamson, C.H.K. (1988) Defining a Universal and Continuous Strouhal-Reynolds Number Relationship for the Laminar Vortex Shedding of a Circular-Cylinder. Physics of Fluids, 31, 2742-2744. http://dx.doi.org/10.1063/1.866978
- 11. Williamson, C.H.K. (1996) Three-Dimensional Wake Transition. Journal of Fluid Mechanics, 328, 345-407. http://dx.doi.org/10.1017/S0022112096008750
- 12. Norberg, C. (1994) An Experimental Investigation of the Flow around a Circular-Cylinder - Influence of Aspect Ratio. Journal of Fluid Mechanics, 258, 287-316. http://dx.doi.org/10.1017/S0022112094003332
- 13. Sohankar, A., Norberg, C. and Davidson, L. (1999) Simulation of Three-Dimensional Flow around a Square Cylinder at Moderate Reynolds Numbers. Physics of Fluids, 11, 288-306. http://dx.doi.org/10.1063/1.869879
- 14. Luo, S.C., Chew, Y.T. and Ng, Y.T. (2003) Characteristics of Square Cylinder Wake Transition Flows. Physics of Fluids, 15, 2549-2559. http://dx.doi.org/10.1063/1.1596413
- 15. Saha, A.K., Biswas, G. and Muralidhar, K. (2003) Three-Dimensional Study of Flow Past a Square Cylinder at Low Reynolds Numbers. International Journal of Heat and Fluid Flow, 24, 54-66. http://dx.doi.org/10.1016/S0142-727X(02)00208-4
- 16. Nakagawa, S., Nitta, K. and Senda, M. (1999) An Experimental Study on Unsteady Turbulent near Wake of a Rectangular Cylinder in Channel Flow. Experiments in Fluids, 27, 284- 294. http://dx.doi.org/10.1007/s003480050353
- 17. Liou, T.M., Chen, S.H. and Hwang, P.W. (2002) Large Eddy Simulation of Turbulent Wake behind a Square Cylinder with a Nearby Wall. Journal of Fluids Engineering-Transactions of the ASME, 124, 81-90. http://dx.doi.org/10.1115/1.1445797
- 18. Kuroda, M., Tamura, T. and Suzuki, M. (2007) Applicability of LES to the Turbulent Wake of a Rectangular Cylinder—Comparison with PIV Data. Journal of Wind Engineering and Industrial Aerodynamics, 95, 1242-1258. http://dx.doi.org/10.1016/j.jweia.2007.02.004
- 19. Inoue, O., Iwakami, W. and Hatakeyama, N. (2006) Aeolian Tones Radiated from Flow Past Two Square Cylinders in a Side-by-Side Arrangement. Physics of Fluids, 18, Article ID: 046104. http://dx.doi.org/10.1063/1.2191847
- 20. Sau, A., Hsu, T.W. and Ou, S.H. (2007) Three-Dimensional Evolution of Vortical Structures and Associated Flow Bifurcations in the Wake of Two Side-by-Side Square Cylinders. Physics of Fluids, 19, Article ID: 084105. http://dx.doi.org/10.1063/1.2757712
- 21. Okajima, A. (1982) Strouhal Numbers of Rectangular Cylinders. Journal of Fluid Mechanics, 123, 379-398. http://dx.doi.org/10.1017/S0022112082003115
- 22. Davis, R.W., Moore, E.F. and Purtell, L.P. (1984) A Numerical-Experimental Study of Confined Flow around Rectangular Cylinders. Physics of Fluids, 27, 46-59. http://dx.doi.org/10.1063/1.864486
- 23. Sohankar, A., Norberg, C. and Davidson, L. (1998) Low-Reynolds-Number Flow around a Square Cylinder at Incidence: Study of Blockage, Onset of Vortex Shedding and Outlet Boundary Condition. International Journal for Numerical Methods in Fluids, 26, 39-56. http://dx.doi.org/10.1002/(SICI)1097-0363(19980115)26:1<39::AID-FLD623>3.0.CO;2-P
- 24. Hayase, T., Nisugi, K. and Shirai, A. (2005) Numerical Realization for Analysis of Real Flows by Integrating Computation and Measurement. International Journal for Numerical Methods in Fluids, 47, 543-559. http://dx.doi.org/10.1002/fld.829
- 25. Nisugi, K., Hayase, T. and Shirai, A. (2004) Fundamental Study of Hybrid Wind Tunnel Integrating Numerical Simulation and Experiment in Analysis of Flow Field. JSME International Journal Series B-Fluids and Thermal Engineering, 47, 593-604. http://dx.doi.org/10.1299/jsmeb.47.593
- 26. Yamagata, T., Shibata, H., Smit, K. and Hayase, T. (2007) Reproduction of a Real Flow with Karman Vortex Street by Integrating Flow Simulation and Pressure Measurement on an Obstacle. Proceedings of the 3rd Asian-Pacific Congress on Computational Mechanics, Kyoto, 3-6 December 2007, 1-9.
- 27. Gopalkrishnan, R., Triantafyllou, M.S., Triantafyllou, G.S. and Barrett, D. (1994) Active Vorticity Control in a Shear-Flow Using a Flapping Foil. Journal of Fluid Mechanics, 274, 1-21. http://dx.doi.org/10.1017/S0022112094002016
- 28. Zhou, L., Cheng, M. and Hung, K.C. (2005) Suppression of Fluid Force on a Square Cylinder by Flow Control. Journal of Fluids and Structures, 21, 151-167. http://dx.doi.org/10.1016/j.jfluidstructs.2005.07.002
- 29. Yamagata, T., Hayase, T. and Higuchi, H. (2008) Effect of Feedback Data Rate in PIV Measurement-Integrated Simulation. Journal of Fluid Science and Technology, 3, 477-487. http://dx.doi.org/10.1299/jfst.3.477
Nomenclatures
CD: Drag coefficient
CL: Lift coefficient
D: Width of cylinder
E: Error norm
f: Feedback force
FA, FB: Feedback forces at both sides of cylinder
fs: Vortex shedding frequency
hx, hy, hz: Grid spacing in x, y, z directions
K*: Feedback gain
L: Reference length
Nx, Ny, Nz: Numbers of grid points in x, y, z directions
p: Pressure
PAS, PBS: Computed pressure
 ,
, : Measured pressure
Re: Reynolds number
St: Strouhal number
t: Time
u: Velocity vector
u, v, w: Velocity components in x, y, z directions
U: Mean inflow velocity
um: Mean velocity
urms: Velocity fluctuation
Δt: Time step
ΔV: Control volume
μ: Viscosity of fluid
ρ: Density of fluid

Submit or recommend next manuscript to SCIRP and we will provide best service for you:
Accepting pre-submission inquiries through Email, Facebook, LinkedIn, Twitter, etc.
A wide selection of journals (inclusive of 9 subjects, more than 200 journals)
Providing 24-hour high-quality service
User-friendly online submission system
Fair and swift peer-review system
Efficient typesetting and proofreading procedure
Display of the result of downloads and visits, as well as the number of cited articles
Maximum dissemination of your research work
Submit your manuscript at: http://papersubmission.scirp.org/