Journal of Flow Control, Measurement & Visualization
Vol.2 No.2(2014), Article ID:44766,7 pages DOI:10.4236/jfcmv.2014.22005
Three-Dimensional Imaging of Pore-Scale Water Flooding Phenomena in Water-Wet and Oil-Wet Porous Media
Arief Setiawan1, Tetsuya Suekane2, Yoshihiro Deguchi1, Koji Kusano1
1Department of Mechanical Engineering, The University of Tokushima, Tokushima, Japan
2Department of Energy Sciences, Tokyo Institute of Technology, Tokyo, Japan
Email: ars_wa2@yahoo.co.id, tsuekane@es.titech.ac.jp
Copyright © 2014 by authors and Scientific Research Publishing Inc.
This work is licensed under the Creative Commons Attribution International License (CC BY).
http://creativecommons.org/licenses/by/4.0/


Received 27 November 2013; revised 20 January 2014; accepted 21 January 2014
ABSTRACT
The penetration of water during water flooding has been observed over many years using several methods. A microfocused X-ray computed tomography scanner can be used to directly observe 3D water flooding in a nondestructive manner. To eliminate the possibility of false images being produced because of X-ray broadening effects, we developed a visualization method by arranging the brightness distribution of all phases involved. Water flooding experiments were conducted using oil-wet and water-wet porous media. The water phase was injected upward into packed glass beads containing an oil phase, and the process was scanned every minute until steady state was reached. Using this scheme, real-time, the water invasion pattern and oil trapping process in clusters of pores and individual pores can be observed clearly. By eliminating false images, the boundary of each phase could be identified with high precision, even in a single pore. Pore-level phenomena, including snap off (which has never before been captured in a real 3D porous medium), piston-like displacement, and the curvature of the interface, were also observed. Direct measurement of the pore throat radius and the contact angle between the wetting and nonwetting phases gave an approximation of the capillary pressure during the piston-like displacement and snap-off processes.
Keywords:Visualization, Porous Medium, Pore-Scale Water Flooding, Oil Trapping, X-Ray CT Scanner

1. Introduction
Water flooding is one of the most important processes in oil production. Water is injected into an oil reservoir to maintain the reservoir pressure, and the water sweeps some of the oil toward the production well. During this process, some oil is left behind by the water and becomes trapped in the porous reservoir medium. The stability of the displacement front of the water is highly affected by variations in the pore channel diameters, which cause capillary pressure differences and capillary fingering, thus reducing the sweeping efficiency. The differences in density and viscosity between the displacing and displaced fluids enhance the instability of the displacement front [1] . Usually, less than 50% of the original oil in a reservoir can be recovered using water flooding, with the rest becoming trapped because of the capillary pressure holding it in the pore spaces. Understanding the phenomena inside the reservoir rock by direct observations is a crucial step toward developing an advanced water flooding method that will significantly improve the oil recovery factor.
So far, many studies of the water flooding process have been conducted using micromodels etched on a glass plate [2] [3] or simulations [4] . Micromodels usually describe the water flooding process in two dimensions, and water flooding simulations require many parameters to be precisely determined. An additional scheme is required for the process to be studied more realistically. Pore-scale observations in 3D porous media offer a solution, because pore-scale processes govern the fundamental behaviors of the multiphase flow phenomena in porous media [5] . The development of microfocused X-ray computed tomography (CT) scanner technology now allows the nondestructive visualization of the phenomena [6] , and its application allows observations that are critical to our understanding of fluid transport.
Water flooding in natural or artificial porous media has been observed using microfocused X-ray CT scanners, yielding parameters such as saturation, flow distribution, trapped oil size, and trapped oil distribution. However, these phenomena have been observed over time in only a few studies. Usually, only the initial state (before water is injected) and the final state (after water has been injected) are observed, and the resolution and image quality limit observations to, at best, a cluster of pores. In this paper, the visualization of the water flooding process over time by using a microfocused X-ray CT scanner was discussed. A scheme was developed, so that it allows the time-dependent processes, including the initial state, the initiation of water invasion, the invasion pattern, and the trapping phenomena, can be observed clearly, step-by-step. These phenomena can be visualized in 3D in a single pore and in a cluster of pores.
2. Experiments
2.1. Experimental Scheme
The water flooding process was visualized using a microfocused X-ray CT scanner (ScanXmate-G100S110; Comscantechno Co.). Recent developments in high-resolution X-ray CT scanners have enabled us to directly observe the porous structures [5] . The image resolution depended on the ratio of the distances between the X-ray source, detector, and the object. The focal spot size of the X-ray CT scanner used in this experiment was 5 µm. The X-ray CT scanner captured 600 projections from angular orientations while the object is spinning 360 degrees during its process. The commercial software embedded with the X-ray machine reconstructed the most probable image in equally spaced grid size that consist of 512 images showing cross sectional view along the porous medium. The resolution of those 512 images was 504 × 504 pixels.
The X-ray CT scanner produced images in gray scales, whose intensity was proportional to X-ray absorption. Iodododecane doped with 23 wt% dodecane was used as the oil phase and distilled water as the water phase, to allow the phases to be distinguished clearly in the images. The properties of each phase used are listed in Table 1. Two different glass bead treatments were used. Glass beads fabricated from silica fibers, with diameters of 350 - 500 µm (average 400 µm), were used as oil-wet glass beads. In addition, the same glass beads washed with toluene, ethanol, and then water, to remove the coating, were used as water-wet glass beads.
A tube with an inner diameter of 4 mm and height of 50 mm was filled with oil, and the glass beads were poured slowly into it, avoiding entrapping air. The packed glass beads were scanned to determine the initial conditions. Water was then injected upward at Ca = 4.9 × 10⁻⁷ for 2 hours. The experimental setup is shown schematically in Figure 1. The capillary number, Ca, is defined as the ratio of the viscous force to the capillary force at the pore scale (Equation (1)).
 (1)
(1)
where ![]() is the displacing phase velocity,
is the displacing phase velocity, ![]() is the water viscosity, and
is the water viscosity, and ![]() is the interfacial tension between
is the interfacial tension between

Table 1. Properties of fluids.
aMeasured at 20˚C, bMeasured by Kestin et al. [9] , cMeasured with falling ball viscometer at 20˚C.
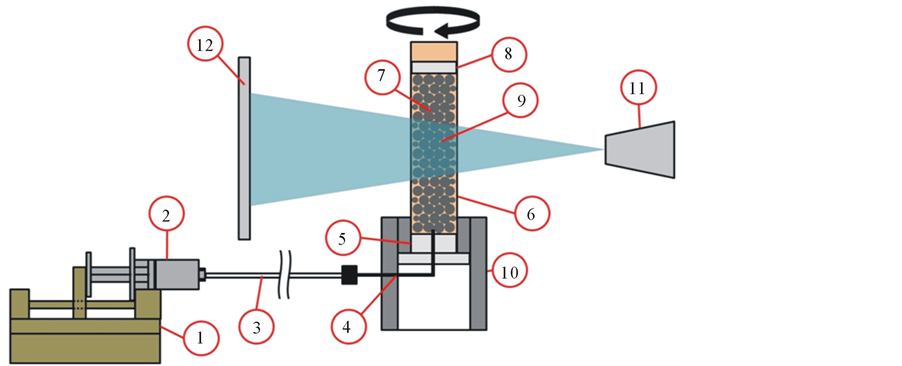
Figure 1. Experimental setup. (1) Syringe pump, (2) syringe, (3) tubing, (4) needle, (5) bottom cap, (6) resin tube, (7) glass beads, (8) filter, (9) observed area, (10) holder, (11) X-ray source, (12) X-ray detector.
the oil and water. The displacing phase velocity was adjusted to 1.1 × 10⁻⁵ m/s. The interfacial tension between water phase and oil phase was 22.5 mN/m measured by the pendant drop method. At capillary numbers below 10−6, the trapping mechanism will be dominated by capillary forces, and the viscous force can be neglected [7] .
To observe critical phenomena during water invasion and oil trapping process, porous medium was scanned every minute for the first 30 minutes. Finally, steady state condition was scanned after injection of water for 2 hours. Each scanning process took 60 seconds with 10 frames per second. By using such a scheme, the water invasion process can be visualized clearly.
2.2. Image Processing
The image resolution was 9.484 µm/pixel, and the scale, boundary, and optimum brightness were set using the image processing software ImageJ [8] . To allow the system to be visualized clearly, the tube was set as close as possible to the X-ray source. A 4 mm high section of the tube, approximately in the middle of the tube, was observed so that the entrance and exit effects were excluded.
Each phase was visualized with a different brightness, as shown in Figure 2. The glass beads, water, and oil were distinguished using appropriate brightness threshold values for each phase and they could be independently removed, digitally, from each 3D structure at each time interval, if required. We used global thresholding, choosing the threshold values from the histogram. Change of the brightness threshold value for 1 or 2 points above or below the correct value may cause less than 1% difference in water and oil saturation.
Images from the image processing software were used to construct 3D images using the volume rendering software VG Studio Max 2.1. Images at the initial conditions were used to construct the glass bead structures for all data. The volume fraction and position of glass beads structure were checked in each time interval to confirm that it remained in the same position. Images from each time interval were used to digitally extract the water phase and oil phase independently. The 3D glass bead image under the initial conditions was then combined with the 3D water phase and 3D oil phase images to create a complete structure at each time interval.
The iodododecane and dodecane mixtures (oil phase) and pure water (water phase) were carefully selected with two aims: to limit the buoyancy effect between the oil and water phases and to achieve an oil phase brightness that left the glass bead brightness between the oil and water brightnesses. A major consideration was the X-ray broadening effect. The brightness should change step-wise at the interface between two substances with different X-ray absorption coefficients. However, in images, the interface is broadened, creating a slope-like shape, decreasing the accuracy with which the boundary can be located, especially when phenomena in a single pore space are being observed. If the phase brightnesses are in the order water, oil, then glass beads, from low to high, the broadening of the interface between the water and glass beads creates the illusion of an oil film on the surface of the glass beads. To eliminate this, each image set should have a reference image subtracted, in order to digitally separate the oil and water phases. However, this takes time and leads to another error that is caused by the improper subtraction process, because of irregularities in the image sets.
3. Results and Discussion
Two types of displacement processes commonly occur when one fluid is displaced by another immiscible fluid in a porous medium. The first most common process is piston-like displacement, where the displacing fluid invades the pore space filled with the displaced fluid with a movement that is similar to that of a piston. During drainage, the nonwetting fluid enters pores filled with the wetting phase only if the capillary pressure is equal to or greater than the threshold capillary pressure. The second process is snap-off, which only occurs when the wetting phase in a pore throat occupied by the nonwetting phase collapses and cuts off the continuity of the nonwetting phase.
Figure 3 shows the water flooding process in oil-wet glass beads. The real-time observations of the pore-scale phenomena were clearly observed in this system. Because the porous medium was oil-wetted, the nonwetting water phase drained the wetting oil phase. The water tended to invade the larger pores because of the lower
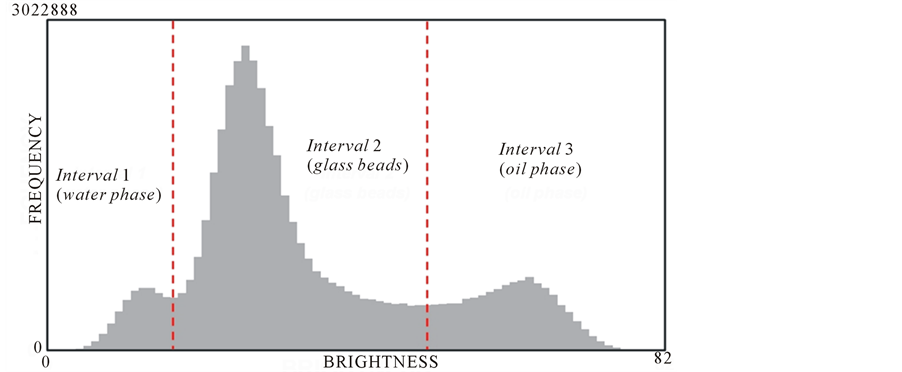
Figure 2. Brightness intervals in the gray-scale images.
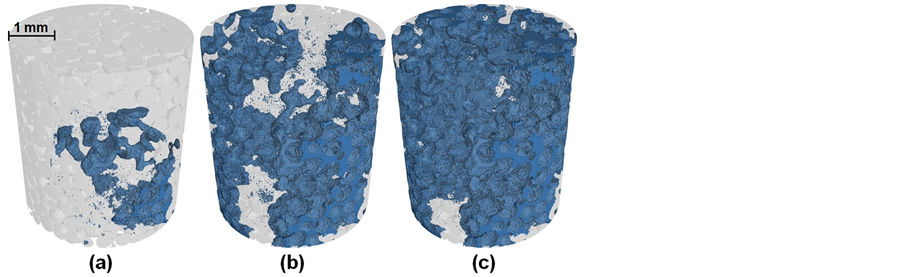
Figure 3. Water flooding process in oil-wet glass beads. (a) 1 minute, (b) 5 minutes, and (c) 2 hours after water injection was started. Blue regions indicate water.
capillary pressure threshold. Therefore, at the early stage of drainage shown in Figure 3(a), the water had invaded the pores close to the wall, which are more porous because of the sorting effect. Different invasion speeds in each channel caused oil entrapment, as shown in Figure 3(c). In the water-wet porous medium, the water tended to spontaneously invade channels with a high capillary force.
The water invasion pattern can also be observed by magnifying the packed glass beads, as shown in Figure 4. In the oil-wet porous medium, the water tended to invade pores with larger channel diameters, as shown in Figure 4(a). The displacement front was not homogeneous because of channel diameter variability. The yellow lines in Figure 4(b) show instability of the displacement front. Some of channels containing oil were more preverable to be invaded by water than others. In Figure 4(c), the yellow line shows how the invasion of water from another side of observed pore happened, creating overtaking-like manuever and cutting continuity of the oil. This process is a major mechanism in oil trapping process [10] . Because of the overtaking-like maneuver, oil blobs are discontinued and trapped as shown in Figure 4(e) and capillary pressure holds them in the pore spaces.
The yellow arrows in Figure 4(b) and Figure 4(e) show how the oil in the pore space was displaced in a piston-like movement. The threshold pressure for piston-like displacement ( ) can be expressed as
 (2)
(2)
where ![]() is the interfacial tension between the oil and water,
is the interfacial tension between the oil and water, ![]() is the contact angle, and
is the contact angle, and  is the pore or throat radius [11] . By using volume rendering software VG Studio Max 2.1, 3D images can be rotated freely and appropriate cross section of the selected pore throats can be found. Throat radius and contact angle can be measured directly. Yellow cirlce in Figure 4(d) shows the shape of the interface between water and oil in a pore throat. From that figure, the throat radius was found to be 0.093 mm, and the contact angle was 69.4˚. The threshold pressure for piston-like displacement was approximately 170.21 Pa.
The pore-scale phenomena within a pore space are illustrated in Figure 5. In Figure 5(a), the yellow circle shows the snap-off displacement process, which occurs when the wetting phase invades the wall because the wettable pore is occupied by a nonwetting phase, breaking the continuity of the nonwetting phase at the throat. Figure 5(a) shows the exact moment when the snap-off occurs. Instability occurs when the nonwetting oil phase is no longer in contact with the throat wall. The water film gets thicker and the continuity of oil is broken suddenly. Blunt and Scher [11] also observed that the threshold pressure for snap-off ( ) can be expressed as
 (3)
(3)
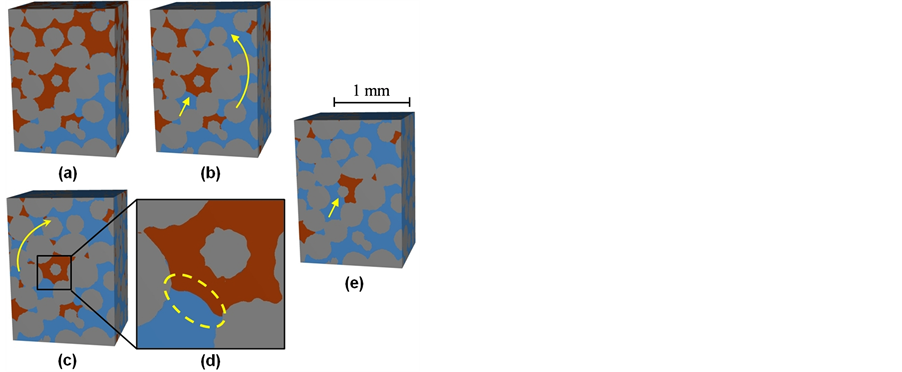
Figure 4. Observed pores in an oil-wet porous medium. (a) Water injection for 1 minute; (b) Water injection for 2 minutes; (c) Water injection for 3 minutes; (d) Shape of the interface; (e) Water injection for 2 hours. Orange, blue, and gray regions indicate oil, water, and glass beads, respectively.

Figure 5. Pore-scale phenomena. (a) Snap-off in a waterwet porous medium; (b) Trapped oil in a water-wet porous medium; (c) Trapped oil in an oil-wet porous medium. Orange, blue, and gray regions indicate oil, water, and glass beads, respectively.
The throat radius and contact angle could be measured directly from Figure 5(a), the throat radius being 0.025 mm and the contact angle 39.6˚. Therefore, snap-off occurred at a capillary pressure of approximately 120.04 Pa. Because the threshold pressure for piston-like displacement is always higher than that for snap-off, snap-off occurs only when piston-like displacement is not possible for topological reasons [12] . Deriving this parameter from direct observations will allow us to develop water flooding schemes that avoid snap-off as much as possible, resulting in higher oil recovery factors.
Trapped oil in water-wet and oil-wet porous media are shown in Figure 5(b) and Figure 5(c). The shape of trapped oil was visualized in a single pore space. In the water-wet porous medium shown in Figure 5(b), the trapped oil was convex as shown by the yellow circle, meaning that the water, as the wetting phase, was actually assisted by the capillary pressure to displace the oil from the pore space. However, because the oil had already become discontinuous, the water from any pore throat connected to that pore space acted in the same way, so the water from all of the throats pushed the oil toward the center of the pore space, implying that the oil could not go anywhere else. In the oil-wet porous medium shown in Figure 5(c), the trapped oil was concave as shown by the yellow circle. The capillary force in each pore throat would resist water entering the pore space, so the oil would be unable to be displaced simply because water was unable to invade the pore space. The curvature can be seen very clearly, so further improvements in our experimental scheme will allow the capillary pressure holding the trapped oil in place to be calculated from the curvature radius measurement. We could also use the same method in the actual reservoir rock to analyze the wettability of the sample by measuring the contact angle, allowing the prediction of the capillary pressure acting on it during water flooding.
4. Conclusions
This study is one of the first attempts to visualize, in 3D, real-time pore-level phenomena during the water invasion process in water-wet and oil-wet porous media. To eliminate graphical errors, such as illusory oil/water films, that can be caused by X-ray broadening effects, the oil and water phases were carefully selected so that images produced using the X-ray CT scanner gave separate brightness distributions for each phase. In other words, the brightness of the fluids used bracketed the porous medium brightness. The boundary of each phase could then be determined with high precision, even in a single pore. The shape of the trapped oil and the interface between the water and oil were visualized clearly. Various phenomena that occur during water flooding in oil-wet and water-wet porous media were captured:
1) The “overtaking-like” water invasion caused by different water invasion speeds in different channels, breaking the continuity of the oil phase, which is the most common oil trapping process in 3D porous media.
2) An actual water film on the surface of the water-wet glass beads accumulated in the pore throat and snapped-off the continuity of the oil phase.
3) The piston-like displacement process, which is the most common oil displacement process in porous media.
4) The contact angle and pore throat radius were measured from direct observations, and used to calculate the capillary pressure during the snap-off and piston-like displacement processes, showing that piston-like displacement is more favorable, because, for a given pore throat radius, the threshold pressure is always higher for piston-like displacement than for snap-off.
Acknowledgements
This study was carried out in the JST Tokushima Plaza in The University of Tokushima.
References
- Cinar, Y.Y., Riaz, A. and Tchelepi, H.A. (2009) Experimental Study of CO2 Injection into Saline Formations. SPE Journal, 14, 588-593.
- Chang, L.C., Tsai, J.P., Shan, H.Y. and Chen, H.H. (2009) Experimental Study on Imbibition Displacement Mechanisms of Two-Phase Fluid Using Micro Model. Journal of Environmental and Earth Science, 59, 901-911. http://dx.doi.org/10.1007/s12665-009-0085-6
- Jamaloei, B.Y., Asghari, K., Kharrat, R. and Ahmadloo, F. (2010) Pore-Scale Two-Phase Filtration in Imbibition Process through Porous Medium at Highand Low-Interfacial Tension Flow Condition. Journal of Petroleum Science and Engineering, 72, 251-269. http://dx.doi.org/10.1016/j.petrol.2010.03.026
- Blunt, M.J., King, M.J. and Harvey, S. (1992) Simulation and Theory of Two-Phase Flow in Porous Medium. Physical Review A, 46, 7680-7699. http://dx.doi.org/10.1103/PhysRevA.46.7680
- Al-Raoush, R.I. and Willson, C.S. (2005) A Pore-Scale Investigation of a Multiphase Porous Medium System. Journal of Contaminant Hydrology, 77, 67-89. http://dx.doi.org/10.1016/j.jconhyd.2004.12.001
- Kumar, M., Senden, T.J., Sheppard, A.P., Middleton, J.P. and Knackstedt, M.A. (2010) Visualizing and Quantifying the Residual Phase Distribution in Core Material. Petrophysics, 51, 323-332.
- Morrow, N.R. and Songkran, B. (1981) Effect of Viscous and Buoyancy Forces on Nonwetting Phase Trapping in Porous Medium. In: Shah, D.O, Ed., Surface Phenomena in Enhanced Oil Recovery, Plenum Press, Berlin, 387-411.
- Abramoff, M.D., Magelhaes, P.J. and Ram, S.J. (2004) Image Processing with ImageJ. Biophotonics International, 11, 36-44.
- Kestin, J., Sokolov, M. and Wakeham, W.A. (1978) Viscosity of Liquid Water in the Range −8˚C to 150˚C. Journal of Physical Chemistry, 7, 941-948.
- Setiawan, A., Nomura, H. and Suekane, T. (2012) Microtomography of Imbibition Phenomena and Trapping Phenomena. Transport in Porous Media, 92, 243-257. http://dx.doi.org/10.1007/s11242-011-9899-2
- Blunt, M.J. and Scher, H. (1995) Pore-Level Modeling of Wetting. Physical Review E, 52, 6387-6403.
- Fenwick, D.H. and Blunt, M.J. (1998) Three-Dimensional Modeling of Three Phase Imbibition and Drainage. Advances in Water Resources, 21, 121-143. http://dx.doi.org/10.1016/S0309-1708(96)00037-1