Journal of Agricultural Chemistry and Environment
Vol.06 No.01(2017), Article ID:72576,29 pages
10.4236/jacen.2017.61001
Hydrochemistry for the Assessment of Groundwater Quality in Korea
Jong Yeon Hwang*, Sunhwa Park, Hyun-Koo Kim, Moon-Su Kim, Hun-Je Jo, Ji-In Kim, Gyeong-Mi Lee, In-Kyu Shin, Tae-Seung Kim
Soil and Groundwater Research Division, NIER, Incheon, Korea

Copyright © 2017 by authors and Scientific Research Publishing Inc.
This work is licensed under the Creative Commons Attribution International License (CC BY 4.0).
http://creativecommons.org/licenses/by/4.0/


Received: November 14, 2016; Accepted: December 3, 2016; Published: December 6, 2016
ABSTRACT
Understanding of the aquifer hydraulic properties and hydrochemical characteristics of water is crucial for management plan and study skims in the target area, and flow motions and chemical species of groundwater are regarded as precious information on the geological history of the aquifers and the suitability of various usages. Cations and anions of groundwater are used to estimate the characteristics and origin of groundwater. In this study, we try to evaluate the quality of groundwater based on the comparison of the physiochemical characteristics and distribution of cations and anions in groundwater from rural areas. Therefore we focused on the evaluation of groundwater as some specific purposes such as agricultural and industrial use, general types of groundwater, lithological origin of chemical component in groundwater. In this point of view, major objectives of this study were grouped as following three categories: 1) quality assessment of groundwater as a special usage (agricultural, industrial); 2) determination of groundwater types; 3) tracing of ion sources of groundwater. The quality of agricultural water was evaluated using SAR, sodium (%), RSC, PI, SSP, MH, PS, and Kelly’s ratio, and was classified as SAR (Excellent (100%)), Sodium ((Excellent (34%), Good (55%), Permissible (9%), Doubtful (1.6%), Unsuitable (0.4%)), RSC (Good (95.7%), Medium (3.5%), Bad (0.8%)), PI((Excellent (40.6%), Good (59%), Unsuitable (0.4%)), SSP ((Excellent (26.3%), Good (59.8%), Fair (13.1%), Poor (0.8%)), MH ((Acceptable (94.4%), Non-Acceptable (5.6%)), Kelly’s Ratio ((Permissible (93%), Non- Permissible (7%)), PS ((Excellent to Good (98%), Good to Injurious (1.2%), and Injurious to Unsatisfactory (0.2%)). Evaluation based on the Wilcox diagram was classified as “excellent to good” or “good to permissible”, and the water quality evaluated using the U.S. salinity Laboratory’s Diagram was classified as C1S1 (Excellent/Excellent) and C2S1 (Good/Excellent). And, in the applications of two factors of Langelier Saturation Index (LSI) and Corrosive ratio (CR), we could get similar results for defining the suitabilities of groundwater for the industrial purpose. And the groundwater samples were also classified groundwater using the Piper diagram and estimated the origin of ions using the Gibbs and Chadah diagram, and the classifications based on the Piper diagram showed that the types of the groundwater are  type and
  type. And, estimation of dominance type (evaporation, rock, precipitation) based on the Gibbs diagram showed that the origin of anion and cation in groundwater are from the rock-do- minance, and the estimation of origin of anions using the Chadha diagram showed that the most of the ionic species was originated from the interactions between alkaline earths and alkali metals contained in the soil. And through the source-rock deduction followed by the comparison of Gibbs and Chadah diagram, it was shown that the chemical components in the groundwater were mostly induced from the water-rock deduction and major types of groundwater samples following the Chadah diagram were categorized such as following group types: dolomite type, gypsum type, alkaline and alkaline earth type.
Keywords:
Geochemical Characteristics, Piper Diagram, Gibbs Diagram, Wilcox Diagram, US Salinity Laboratory’s Diagram, Chadah Diagram, Rock-Water Deduction

1. Introduction
Water is not only the essence of life but also one of the most crucial factors determining the quality of life of the people. The climate change and increasing disruptions in the rainfall patterns, temperature and soil moisture directly impacted the water availability and its quality for drinking, livestock use, agriculture and various other purposes, and in this respect, the latest patterns of climate changes and water deficit reflected the depletion of water sources and deterioration of water quality in many parts of the world [1] [2] [3] . In addition to groundwater decline, pollutions of water resources further enhance the multiple problems and put up more pressure on the difficulty of finding out available fresh water resources [4] . So, the development of other water sources including groundwater has begun from the beginning of 1970’s in sub-Sahara country and middle-eastern countries. Recognizing of the importance for developing of new sources and assessment of groundwater quality has become a major goal for the government workers and scientists who have the responsibilities of management and research of the surface water and groundwater in every country of the world. As we know, groundwater quality is determined by the solutes, flow paths and soil gases dissolved in the water, as well as the matter suspended in and floating on the water. So, the water quality is a consequence of the natural physical and chemical state of the water as well as any alterations factors that may have occurred as a consequence of human activity and microbial activities in soils. Because the paths of groundwater in soil cannot be recognized, ground- water chemistry is also largely a function of the mineral composition of the aquifer through which it flows. As groundwater moves along its path from one aquifer to another areas, a variety of hydrogeochemical processes alter its chemical composition. So, the hydrogeochemical processes of the groundwater vary spatially and temporally, depending on the geological and chemical characteristics of the aquifer. In various parts of the world, numerous studies have been carried out to assess the geochemical characteristics of groundwater affected by contamination from human activities such as sewage effluents, agricultural fertilizers and ion-exchange, evapotranspiration and water-rock interactions which result in an increase of the ion concentration making water unfit for drinking and agricultural purpose [5] - [12] . Determination of groundwater composition and its interpretation is very important for the evaluation of its suitability for domestic, irrigation and industrial uses. Thus, knowledge on hydrogeochemical processes that control ground-water chemical evolutions could lead to improved understanding of characteristics of an aquifer, and these would become a very important contribution for the effective management and development of new aspects of groundwater resources.
In this study, many assessing methods of groundwater using specific purposes were carried out for agricultural purposes, industrial usages and deduction of water-rock interactions. The assessment of groundwater for agricultural purpose was done by using SAR (Sodium Adsorption Ratio), Na(%), RSC (Residual Sodium Carbonate), PI (Permeability Index), SSP (Soluble Sodium Percent), MH (Magnesium Hazard), KR (Kelly’s Ratio) and PS (Potential soil Salinity). The Wilcox diagram based on Na (%) and electrical conductivity, as well as the U.S. salinity Laboratory’s Diagram based on SAR and electrical conductivity, is also used to evaluate water quality for agricultural usage [13] - [25] . And, secondly the water samples were assessed for the suitability of the industrial usage by applying the factors such as: LSI (Langelier Saturation Index), CR (Corrosivity Ratio) [26] . And, the understanding of the water-rock interaction of groundwater in flow paths of groundwater weathering processes have studied by using of the chemical processes and adaptation of the chemical reaction equations for the relative correlations between ion groups such as: calcium and magnesium, sodium and potassium, chloride and sulfate. And finally, Gibbs diagram and Chadah diagram were applied to assume the geochemical evolution of groundwater by plotting the concentration of major cations and anions, and the relationship of water quality composition and aquifer lithological characteristics.
2. Material and Experimental Methods
2.1. Sampling Preparation and Measurement of On-Site Items
The overall objective of most groundwater sampling is to collect samples that are representative, that is, samples that accurately reflect in situ groundwater conditions in the formation of interest at the site under investigation. A representative ground-water sample must reflect the physical and chemical properties of the groundwater in that portion of formation open to the well to be samples. Therefore, many investigators have acknowledge the difficulty of obtaining samples that are truly representative of subsurface conditions [27] [28] [29] [30] [31] . Because of the importance for ‘the least disturbance or change in the chemical and physical properties’ of water samples, we followed the guide line of groundwater sampling and in situ measurement for onsite items.
In this study, all samples were collected for two different seasons representing (Pre-monsoon/PRM (June) and Post-monsoon/POM (July-November) to broadly cover the seasonal variations. A total of 486 (Pre-monsoon; 206 samples, Post- monsoon; 280 samples) groundwater samples were collected in one liter acid washed, well rinsed low density polyethylene bottles with inside stopper from bore wells and analyzed for chemical parameters following the guidelines. The samples were collected after pumping the wells for enough time of 15 - 20 min, and by subsequent filtering through 0.45 um membranes. The analyzed parameters include the activity of hydrogen ion concentration (pH), electrical conductivity (EC), total hardness(TH), total dissolved solids (TDS) and cation groups like Calcium (Ca2+), magnesium (Mg2+), sodium (Na+), potassium(K+) and anion groups like bicarbonate ( ), Chloride (Cl−), Nitrate (
 ), Phosphate (
 ). The pH and electrical conductivity (EC) were measured using pH and EC meters. All anions and cations were analyzed by Ion chromatography (Dionex) and analytical conditions of anion and cation for groundwater were shown in Table 1. Following the guidelines, quality controls and quality assurances were undertaken by checking every step for the guarantee of miscellaneous factors such as followings; calibration curves, blanks, sample preservations, duplicate samples, standards, and charge balances of ionic substances.
2.2. Evaluations of Groundwater Quality as an Agricultural Usage
Many parameters are used to define irrigation water quality, to assess salinity hazards, and to determine appropriate management strategies. A complete water quality analysis will include the determination of such as following factors: 1) the total concentration of soluble salts; 2) the relative proportion of sodium to the other cations; 3) the bicarbonate concentration as related to the concentration of calcium and magnesium; 4) the concentration of specific elements and compounds. Therefore, the amounts and combinations of these substances define the suitability water for irrigation and the potential for plant toxicity. In most

Table 1. Analytical conditions of anion and cation for groundwater.
irrigation situations, the primary water quality concern is salinity levels, since salts can affect both the soil structure and crop yield. But, a number of trace elements are found in water which can limit its use for irrigations. In this point of view, in this study we focused on the property and suitability of groundwater for irrigation of farm fields and rice fields, so most of the sampling sites are located in the rural area of middle and southern province of Korea. As we mentioned, irrigation waters pumped from wells contain considerable chemical constituents derived from natural soil environment and man activities that may influence crop yield and soil fertilities [32] . The irrigation of groundwater to the rice field and farm field always introduces major nutrients and salts into the root zone. So, naturally plant roots take in water but absorb very little salt from the soil solution. Similarly, water evaporates from the soil surface but salts remain behind. The processes result in a gradual accumulation of salts in the root zone affecting the plants by creating salinity hazard, water deficiency and toxicity [33] . So for the solutions of compensating such problems, it is necessary to have a logical and scientific information concerning the quality of irrigation water and its effect on soils and crops. So, in this study major assessing methods for the groundwater quality assurance were applied for the key items such as followings; SAR, Na(%), RSC, PI, SSP, MH, Kelly’s Ratio, PS and all equation were shown in Table 2.
SAR (Sodium adsorption ratio)
Sodium adsorption ratio also expressed as sodium content or alkali hazard is very important for determining the quality of water used for irrigation purposes.
Table 2. Equations and classifications for evaluating of groundwater.
Higher salinity reduces the osmotic activity of plants and prevents water from reaching the branches and leaves of plants resulting in inferior production [34] . Moreover, irrigation water with high Na+ and low Ca2+ favors ion exchange by saturation of Na+, destroys the soil structure due to dispersion of clay particles [35] resulting in minor production due to difficulty in cultivation [36] .
Na (%)
Sodium is an important ion used for the classification of irrigation water due to its reaction with soil that reduces its permeability. Percentage of Na+ is widely used for assessing the suitability of water for irrigation purposes [24] . Na+ is expressed as percent sodium or soluble-sodium percentage (Na (%)).
RSC (Residual Sodium Carbonate)
The sum of carbonate and bicarbonate over the sum of calcium and magnesium in water influences the fit of ground-water for irrigation purposes. An excess sodium bicarbonate and carbonate influence the physical properties of soil by dissolution of organic matter in soil that leaves a black stain on its surface on drying [37] .
PI (Permeable Index)
The permeability of soil is influenced by sodium, calcium, magnesium and bicarbonate contents in soil which also influences the quality of irrigation water on long term use. Doneen [38] has evolved a criterion for assessing the suitability of water for irrigation based on PI.
SSP (Soluble sodium percentage)
Soluble Sodium Percentage (SSP) is also used for assessment of irrigation water quality, as an important factor to study the sodium hazard. SSP is defined as the ration of sodium the total cation multiplied by 100. High sodium (Na+) percentage can decrease soil permeability and inhibit plant growth.
MH (Magnesium Hazard)
The Ca2+ and Mg2+ ions maintain a state of equilibrium in most groundwater [39] . In equilibrium, Mg2+ in water affects the soil by making it alkaline and results in decrease of crop yield [40] . The measure of the effect of magnesium in irrigated water is expressed as the magnesium ratio and Paliwal developed an index for calculating the magnesium hazard.
Kelly’s Ratio (KR)
Kelly’s Ratio is used for the classification of water for irrigation purposes. A KI (>1) shows an excess of sodium and KI (<2) signifies its deficit in waters [41] . The waters with low KI (<1) are suitable for irrigation while those with greater ratio are unsuitable [42] .
PS (Potential Salinity)
Doneen [43] pointed out that the suitability of water for irrigation is not dependent on the concentrations of soluble salts. Doneen is of the opinion that the low soluble salts gets precipitated in the soil and accumulated with each successive irrigation, whereas the concentrations of highly soluble salts enhance the salinity of the soil. Potential salinity is defined as the chloride concentration plus half of the sulfate concentration.
2.3. Evaluations of Groundwater Quality as a Industrial Usage
Water is considered safe for industrial use if it is neither scale-forming nor scale-removing in nature. The water saturation index is used to assess whether water is precipitating out, dissolving or in equilibrium with calcium carbonate. Indices like LSI, and CR has been calculated to understand groundwater industrial suitability and each equation (all units are in mg/l) are such as followings [44] ;
 (1)
(1)
where pHw = measured pH, and 


 (2)
(2)
2.4. Classifications and Estimation of Origins for Groundwater
The characteristics of cations and anions in groundwater represent the unique physiochemical characteristics caused by the groundwater’s interaction with rock and soil while flowing in the aquifer. The aquifer represents the characteristics of water bodies with different chemical compositions. Therefore, such characteristics are called the hydrochemical facies of groundwater. The hydrochemical facies is known to be affected by the rocks of the aquifer and the flow of groundwater, and groundwater can be classified using the Piper diagram using the distribution of cations and anions. In this study, we used the Piper diagram which is a major method for classifying groundwater to classify the samples for each sampling period and purposes of groundwater. In addition, the distribution of anions ( ,
, ) and cations (Na+, Ca2+) as well as the TDS value were applied to plot the Gibbs diagram to guess the dominance types such as ; evaporation dominance, rock dominance, precipitation dominance. Besides the piper diagram [45] and Gibbs diagram [46] , the Chadah diagram was applied to compare the piper diagram to look at the possibility for replacing piper diagram and whether well matched or not with piper diagram.
2.4.1. Piper Diagram
Piper diagrams are a combination of anion and cation triangles that lie on a common baseline. Adjacent sides of two triangles are the 60˚ apart. A diamond shape between them is used to replot of the analyses as circles whose areas are proportional to their TDS. The position of an analysis that is plotted on a piper diagram can be used to make tentative conclusion as to the origin of the water represented by the analysis. The study of Piper’s 1944 paper is strongly recommended for anyone using plots extensively.
2.4.2. Gibbs Diagram
Gibbs diagram is used to interpret the effect of hydrogeochemical processes such as precipitation, rock-water interaction mechanism and evaporation on ground- water geochemistry. The reaction between groundwater and aquifer minerals has a significant role in groundwater quality which is useful to assume the genesis of water. Gibbs ratio is calculated using the following equation.
 (3)
(3)
 (4)
(4)
2.4.3. Chadah Diagram
Chadah diagram [46] is a somewhat modified version of the Piper diagram and the expanded Durov diagram. The difference in milliequivalent percentage between alkaline earths (calcium plus magnesium) and alkali metals (sodium plus potassium), expressed as percentage reacting values, is plotted on the X axis, and the difference in milliequivalent percentage between weak acidic anions (carbonate plus bicarbonate) and strong acidic anions (chloride plus sulphate) is plotted on the Y axis. The milliequivalent percentage differences between alkaline earths and alkali metals, and between weak acidic anions and strong acidic anions, would plot in one of the four possible sub-fields of the proposed diagram.
3. Result and Discussion
3.1. General Hydrogeochemistry
In this study, pH, electrical conductivity (EC), dissolved oxygen (DO), and oxidation-reduction potential (ORP) were measured on site. As we mentioned about of the objectives of this paper, Groundwater samples were classified based on their use as agricultural, residential, and drinking water, and was also classified as pre-monsoon and post-monsoon based on the time of sampling. The data of on-site measurements were shown that the ranges of electrical conductivities were 56 - 1885 μs/cm for agricultural water, 24 - 511 μs/cm residential water, 51 - 959 μs/cm drinking water, and 193 - 241 μs/cm for industrial water. These show that the electrical conductivity range of agricultural water is broader than that of groundwater for other purposes, and that the electrical conductivity ranges of industrial water are also slightly broader than that of groundwater for residential or drinking purposes. The dissolved oxygen was 0.6 - 10.0 mg/L for agricultural water, 0.3 - 11.0 mg/L for residential water, 0.5 - 10.9 mg/L for drinking water with an average of 5.5 mg/L, and 3.5 - 4.5 mg/L for industrial water. The monthly average dissolved oxygen was 7.2 mg/L for June, 5.6 mg/L for July, 3.8 mg/L for September, 4.9 mg/L for October, and 6.2 mg/L for November. This shows that the DO is low in September, which is immediately after summer, and the maximum DO in September was 6.1 mg/L, which is lower than that of June and November. The results also showed that the oxidation-reduction potential is −19 - 244 mV with a monthly average of 181.6 mV for June, 166.8 mV for July, 186.2 mV for September, 211.4 mV for October, and 210.7 mV for November. Little differences can be seen between each month, even though the ORP showed an increase after July. Table 3 shows the on-site measurements for each ground- water sample.
3.2. Distributions of Cations and Anions
In this study, we make an attempt to compare the distribution of four cations, Na+, Ca2+, K+, Mg2+ and focusing on the evaluation of groundwater quality
Table 3. pH, EC, DO, ORP values (Average, Minimum, Maximum) of samples.
described in sampling period and groundwater usages. The results showed to be 17.51 - 68.77 mg/L and 17.63 - 178.8 mg/L for Na+, 2.4 - 40.99 mg/L and 3.79 - 124.4 mg/L for K+, 8.08 - 60.34 mg/L and 6.48 - 62.03 mg/L for Mg2+, and 36.82 - 229.94 mg/L and 33.65 - 189.4 mg/L for Ca2+ in cation groups. The distribution characteristics for groundwater water usages showed that cation concentrations were high in agricultural water while other results were slightly high in October and November comparing the data of June, July, and September. All of the data of cation groups are shown in Table 4. And the distribution of five anions,  ,
,
Table 4. Na+, Ca2+, K+, Mg2+values (Average, Minimum, Maximum) of samples (mg/L, n = 483).
 ,
,  ,
,  , and
, and  were also compared focusing on the evaluation of groundwater quality. The results showed to be 28.0 - 512.0 mg/L and 27.00 - 271.00 mg/L for
 , 19.03 - 65.0 mg/L and 17.01 - 98.00 mg/L for
 , 45.42 - 431.27 mg/L and 49.27 - 867.59 mg/L for
 , and 92.24 - 875.81 mg/L and 100.06 - 1761.91 mg/L for
 , and 0.00 - 0.00 mg/L and 0.21 - 0.35 mg/L for
 . The distribution characteristics of all anion data showed even distribution for agricultural, living, drinking and industrial water, and all of the data for each sampling period and usage are shown in Table 5.
Table 5. ,
,  ,
,  ,
,  ,
,  values (Average, Minimum, Maximum) of samples (mg/L, n = 483).
3.3. Suitability for Agricultural Purpose
3.3.1. SAR, Na (%), RSC, PI, SSP, MH, Kelly’s Ratio, PS
The suitability of groundwater for irrigation is contingent on the effects of the mineral constituents in the water on both the plants and soil. Salts may harm plant’s growth physically by limiting the uptake of water through modification in the osmotic processes or chemically by metabolic reactions such as those caused by toxic constituents. Effects of salts on soils cause changes in soil structure, permeability, and aeration, which indirectly affect plant growth. An important factor allied to the relation of crop growth to water quality is drainage. If a soil is open and well drained, crops may be grown on it with the application of generous amounts of saline water; on the other hand, a poorly drained area combined with application of good quality water may fail to produce as satisfactory a crop. The important hydrochemical parameters of groundwater used to determine its suitability for irrigation are EC, Salinity, Percent sodium (Na (%)), Sodium Adsorption Ratio (SAR), RSC, Permeability Index (PI) and Magnesium Ratio. As a results of applying the equations and classifications for evaluating of groundwater (Table 2), we could get the following classifications; SAR (Excellent (100%)), Sodium ((Excellent (34%), Good (55%), Permissible (9%), Doubtful (1.6%), Unsuitable (0.4%)), RSC (Good (95.7%), Medium (3.5%), Bad (0.8%)), PI((Excellent (40.6%), Good (59%), Unsuitable (0.4%)), SSP ((Excellent (26.3%), Good (59.8%), Fair (13.1%), Poor (0.8%)), MH ((Acceptable (94.4%), Non-Acceptable (5.6%)), Kelly’s Ratio ((Permissible (93%), Non-Permissible (7%)), PS ((Excellent to Good (98%), Good to Injurious (1.2%), and Injurious to Unsatisfactory (0.2%)). All results are shown in Table 6 and Table 7.
3.3.2. Electrical Conductivity and Na (%)
EC and Na concentrations are important in classifying irrigation water. High salt
Table 6. Classifications of groundwater by SAR, Na (%), RSC, PI.
Table 7. Classifications of groundwater by SSP, MH, Kelly’s ratio, PS.
content (high EC) in irrigation water leads to formation of saline soil. Salinization, on the irrigated lands, is the major cause of loss of production, and it has adverse environmental impacts on irrigation. Saline conditions severely limit the choice of crops and adversely affect crop germination and yields. It is important that all evaluations regarding irrigation water quality are linked to the evaluation of the soils to be irrigated [48] . Sodium concentration is important in classifying irrigation water because sodium reacts with soil to reduce its permeability. In all natural waters, percent sodium is a parameter to evaluate its suitability for agricultural purposes [49] ; sodium combining with carbonate forms alkaline soils, while sodium combining with chloride forms saline soils. Either type of sodium-enriched soil will support little or no plant growth. The chemical quality of groundwater samples was studied by plotting analytical data relating EC and sodium percent (Figure 1) that show that most of the samples belonging to “Excellent to good”.
3.3.3. Salinity Hazard and Alkali Hazard
On the basis of EC values, Richards classified total concentration of soluble salts in irrigation water into four groups. High-salinity problems are encountered where irrigation activity is in poor drainage agricultural soils and also where water logging allows the water table to rise close to the root zone of plants, causing accumulation of sodium salts in the soil solution through capillary rise following surface evaporation. The sodium or alkali hazard in the use of water for irrigation is determined by the absolute and relative concentration of cations. The relative activity of sodium ion in the exchange reaction with soil is expressed in terms of SAR. If high sodium content and low calcium content are present in waters used for irrigation purpose, the base-exchange complex may become saturated with sodium. This can destroy the soil structure due to the de-flocculation (dispersion of clay particles) process. The U.S. salinity Laboratory’s Diagram uses electrical conductivity, and SAR classifies groundwater as CxSx which is a combination of electrical conductivity (C1 - C4) and SAR (S1 - S4) (Table 8). The plot of the analytical data on the US salinity diagram, in which the EC is taken as a salinity hazard and SAR as an alkalinity hazard (Figure 2), shows that most pre-monsoon and post-monsoon samples were classified as C1S1(Excel- lent/Excellent) and C2S1 (Good/Excellent).
3.3.4. Residual Sodium Carbonate
Residual sodium carbonate (RSC) also influences the suitability of water for irrigation uses. RSC can be estimated by subtracting the quantity of alkaline earths

Figure 1. Rating of groundwater samples on the basis of electrical conductivity and Na (%).

Figure 2. Rating of groundwater samples in relation to salinity hazard and sodium hazard (after U. S. salinity laboratory diagram, 1954).
Table 8. Classification of groundwater quality based on SAR and conductivity by USSL Classifications (after US Salinity Laboratory, 1954) [55] .
( ) from the carbonates (
 ). When the sum of carbonates is in excess of calcium and magnesium, there may be a possibility of complete precipitation of Ca2+ and Mg2+ [50] . If the carbonates are less than alkaline earths, it indicates that the residual sodium carbonate is zero. A high value of RSC in water leads to an increase in the adsorption of sodium in soil [51] . On the basis of RSC values, water can be classified as safe (<1.25), marginally suitable (1.25 - 2.5), and unsuitable (>2.5). In this paper, the results indicate that most of the water is suitable for irrigation uses in the study area.
3.3.5. Permeability Index
Soil permeability is affected by long-term use of irrigation water with high salt content. Permeability is influenced by sodium, calcium, magnesium, chloride, and bicarbonate contents of the soil. Doneen has classified irrigation waters based on the PI, which indicates the suitability of groundwater for irrigation use. The groundwater may be classified into classes 1 (Excellent), 2 (Good), and 3 (Unsuitable) based on the permeability indices. Classes 1 and 2 are suitable for irrigation, with 75% or more maximum permeability, and class 3 is unsuitable, with 25% maximum permeability. Based on the above classification, 40.6% of the samples fall in class 1 (Excellent), 59% of samples fall in class 2 (Good) and 0.8% samples fall in unsuitable for irrigation usage.
3.3.6. Magnesium Hazard
Szabolcs and Darab [52] had proposed a magnesium hazard for assessing the suitability of water quality for irrigation. Normally, a high level of Mg2+ is caused by exchangeable Na in irrigated soils. An increased proportion of Mg2+ relative to Ca2+ increases sodication in soils which causes the dispersion of clay particles thus damages soil structure and decreases the relative hydraulic conductivity of soils as Mg2+ behaves like Na+ [53] . A magnesium ratio of more than 50 is considered to be harmful and unsuitable for irrigation use. This would adversely affect the crop yield, as soils become more alkaline. Based on the above classification, 94.4% of the samples fall in “Acceptible”, 5.6% of samples fall in “Non-Acceptible” for irrigation usage.
3.3.7. Kelly’s Ratio
Sodium measured against Ca2+ and Mg2+ was considered by Kelly and Paliwal [54] to calculate this parameter. Kelly’s ratio (>1) indicates an excess level of sodium in water which is unsuitable and <1 is suitable for irrigation uses. Based on the Kelly’s ratio, majority of samples (93.2% in “permissible” and 6.8% in “Non-permissible”) are suitable for irrigation purpose.
3.3.8. Soluble Sodium Percentage (SSP)
This is an important factor for studying sodium hazards. Sodium has the potential of reacting with soil thereby reducing its permeability and supports little or no plant growth. Based on SSP values, 27.3% of samples belongs to “Excellent” class, 59.7% of samples belongs to “Good”, 13.0% samples belongs to “Fair”, 0.8% samples belongs to “Poor”.
3.3.9. Potential Salinity (PS)
Doneen explained that the suitability of water for irrigation is not dependent on soluble salts. Because, the low solubility salts precipitate in the soil and accumulate with each successive irrigation, the concentration of highly soluble salts increase of the soil salinity. The potential salinity of groundwater samples were classified such as following 3 classes; “Excellent to Good (<5)”, “Good to Injurious (5 - 10)”, “Injurious to Unsatisfactory (>10)”. Based on the above classification, 98.5% of the samples fall in “Excellent to Good”, 1.2% of samples fall in “Good to Injurious” and 0.3% samples fall in “Injurious to Unsatisfactory”.
3.4. Suitability for Industrial Purpose
3.4.1. Langelier Saturation Index (LSI)
The Langelier saturation index (LSI) is used to determine the need for calcium carbonate precipitation scale control in water sources containing a TDS concentration of less than 10,000 mg/l (ASTM 1998) [55] . It is the difference between the water’s measured pH (pHw) and the calculated pH when that water is in equilibrium with calcium carbonate (pHs). Scaling and corrosion are common process problems found in domestic and industrial applications where water or wastewaters are in contact with other materials. The scaling of metallic surfaces by calcium carbonate is related to the type of rocks in contact with groundwater. LSI is probably the most widely used indicator of cooling water scale potential. Positive LSI values suggest that water is supersaturated with respect to calcium carbonate and scale formation may occur; negative values suggest that water is unsaturated which has a tendency to remove existing calcium carbonate protective coatings in pipelines and equipment; neutral value indicate that solution is at equilibrium provides an indication of the degree of saturation of water with respect to calcium carbonate and it is neither scale forming nor scale removing [56] . One of the major problems of high calcium waters is the formation of scales in industrial boilers. The calculated results show all most all water samples have negative LSI values indicate that the solution is under-saturated with calcium carbonate (i.e. CaCO3 dissolves) during both the seasons, except one location where CaCO3 depositing in post- monsoon season (Table 9, Figure 3(a)). The positive LSI values indicate encrustation tendency due to CaCO3 precipitation and hence need for moderate treatment of the water to prevent scaling. The increased levels of scaling can be harmful and can cause corrosion of water pipes and release of toxic metals to the water system.
3.4.2. Corrosive Ratio (CR)
It defines the susceptibility of groundwater to corrosion and is expressed as ratio of alkaline earths to saline salts in groundwater. The effect of corrosion is loss in the hydraulic capacity of pipes (Table 9). Groundwater which has CR values greater than 1, noncorrosive pipes (polyvinylchloride) should be used for water supply instead of metal pipes (Figure 3(b)). In the applications of two factors of Langelier Saturation Index (LSI) and Corrosive ratio (CR), we could get similar results for defining the suitabilities of groundwater for the industrial purpose.
4. Classifications of Groundwater
4.1. Piper Diagrams
The Piper diagram is a representative method for classifying groundwater by producing a diagram of the distribution of cations and anions in groundwater.

 (a) (b)
Figure 3. Calcium carbonate precipitation potential for the groundwater (LSI, CR). (a) Langelier Saturation Index (LSI) diagram; (b) Corrosive ratio diagram.
Table 9. LSI, CR values of groundwater samples (n = 483).
The samples obtained for this study were classified for their usage (drinking, living, agricultural, industrial) and period of sampling (pre-monsoon (June), post-monsoon (July-November) to produce the Piper diagram. The  type and
  type were the dominant form for the groundwater classified for each usage type and period (Figure 4 and Figure 5).
4.2. Ion Chemistry and Chemical Process
As we know, major ions constitute a significant part of the total dissolved solids in groundwater and the concentrations of these ions in groundwater depend on the hydrogeochemical processes that take place in the aquifer system. These processes occur when the groundwater moves toward equilibrium in major ion concentration. Therefore, the studies of concentrations of various major ions present in groundwater have been used for the identification of geochemical processes. In this study, we focused on the comparative study to give weight on the two or three kinds of major ion groups such as followings; calcium and magnesium, sodium and potassium, Chloride and sulfate. Because the combination of two or three ions are very important for looking into weathering type of solutes (calcite, gypsum, dolomite), dominance type of ions in solution, influence type for mutual interaction between one ion and the other ion.
4.2.1. Weathering Processes
Calcium is the dominant ion found in the groundwater of all samples. Generally, the abundance of Ca2+, Na+, and Mg2+ is associated with minerals such as montmorillonite, illite, and chlorite [57] . Calcium ion present in the groundwater samples might have come from dissolution of precipitates of CaCO3 and CaMg(CO3)2 during recharge. Datta and Tyagi [58] explained that in the
( ) vs. (
 ) scatter diagram, the ionic concentrations


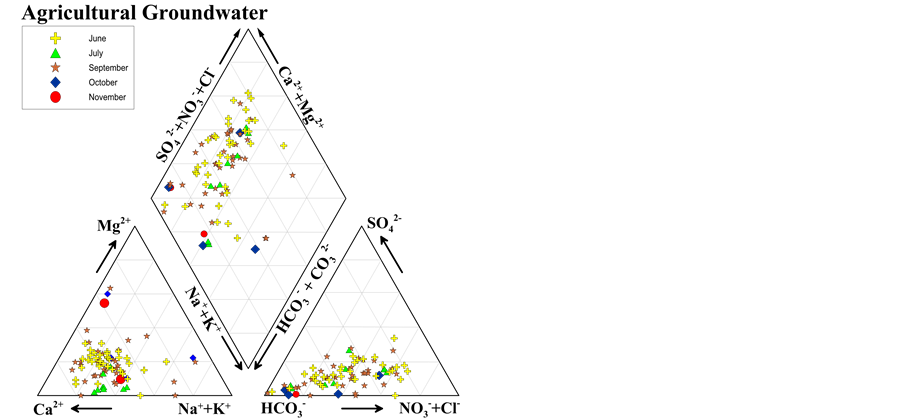

Figure 4. Piper diagram of groundwater for using purpose.


Figure 5. Piper diagram of groundwater for seasonal variation.
falling above the equiline result from carbonate weathering, whereas those falling along the equiline are caused by both carbonate weathering and silicate weathering (Equation (3)). Such a ( ) vs. (
 ) scatter diagram (Figure 6) of samples shows that one half of sample lies above the equiline and one half of lies down the equiline which indicate that carbonate weathering and silicate weathering are the main physical action for making the source for calcium ion in the groundwater. In this reactions, carbonic acid (from dissolution process of CO2 in soil and groundwater) and calcium carbonate in soil react to form bicarbonate and calcium ion as given below (Equations (5) through (9), after Elango Lakeshmana, 2016) [59] :
 (5)
(5)
 (6)
(6)
 (7)
(7)

Figure 6. ( ) vs. (
 ) scatter diagram showing carbonate dissolution and silicate weathering.
 (8)
(8)
 (9)
(9)
 (10)
(10)
Carbonate weathering by carbonic acid water saturated with CO2 is an intensive process. This water can easily dissolve the carbonate minerals available in its flow path. This process has increased the soluble ion content like chloride, sodium, potassium, magnesium, and bicarbonate ion in the groundwater. The Chloro Alkaline Indices (CAI) may be positive or negative depending upon the exchange of sodium and potassium from rock with magnesium and calcium in water and vice versa (Figure 7). All samples of this study showed that two mechanisms of ion exchange are coexisted in groundwater such as; direct exchange and reverse exchange.
4.2.2 Source-Rock Deduction
Source-Rock deduction is to gain insight into the possible origin of water analysis. It is useful both as an analytical check and as an investigative procedure if the origin of groundwater is not known. It is derived from a simplistic mass balance approach to water quality data [60] . During the rock weathering the composition of various cation and anion might be changed, and the amount of cations is dependent on the rock mineralogy. In many cases the source rock minerals may be deduced from the groundwater composition, so the source rock deduction is very important to explain the groundwater quality. The dissolution of Mg2+ and Ca2+ in groundwater is a major key for the understanding of source rock for the dolomite under moderate TDS conditions. If, however, the Mg2+ to Ca2+ ratio approaches one, it is very likely that Ca2+ has been removed from the solution and this process is commonly called dedolomitization. Hounslaw [61] suggest that if Mg2+is greater than (equal or less than) Ca2+, there are four possibilities such as: 1) Gypsum dissolution (=0.5); 2) Limestone-dolomite weathering

Figure 7. CAI scatter diagram showing that indicates two ion exchange mechanisms.
(<0.5); 3) Dolomite dissolution, calcite precipitation. In Figure 8, we can understand that there are all possibilities as mentioned above during the weathering and dissolution processes. And also, by application of Hounslaw equation we can deduct gypsum type source rock following the categories: 1) Gypsum dissolution (=0.5); 2) Pyrite oxidation (<0.5 and pH < 5.5); 3) Ion exchange (<0.5 and pH = neutral); 4) Calcium source other than gypsum-carbonates or silicates (Figure 9).
4.2.3. Gibbs Diagram and Chadha Diagram
While the Piper diagram is a method for classifying groundwater based on the distribution of both cations and anions, and the Gibbs diagram is a method for estimating the origin of ions in groundwater by focusing on the correlation between the concentration of cations (Na+, Ca2+) and anions (Cl−, ), and TDS (Total Dissolved Solid). Figure 10 shows the Gibbs diagram based on TDS and the concentration of cations and anions; it shows that most of the cations and anions in groundwater have a rock-dominance origin. This characteristic indicates the dissolution of ions in groundwater through the interaction between groundwater and rock or soil is more dominant than precipitation or any other sources. Unlike Gibbs, Chadha [45] proposed a modified diagram and classified the origin of ions into 8 groups. In Chadha diagram, the square or rectangular field describes the overall ion distribution and character of groundwater for demonstrating geochemical classification and hydrochemical processes of groundwater. In order to define the primary character of groundwater, the rectangular field is divided into eight sub-fields, each of which represents a water types in Figure 11. The tracing study of ion based on the Chadha diagram (Figure 12) indicated that there is an interaction between the alkaline earths and alkali metals that originate from soil or rock interactions with weak acidic anions and strong acidic anions in groundwater. In Gibbs and Chadah diagram, it is concluded that dominance types of groundwater in wide range could be concluded in Gibbs diagram (hydrochemical) and dominance types of component in the specific range would be defined in Chadah diagram (geochemical), so the

Figure 8.  diagram for dolomite weathering type.

Figure 9.  diagram for the gypsum weathering type.

 (a) (b)
Figure 10. Chadha diagram of groundwater by using anions and cations. (a) Gibbs diagram by anions; (b) Gibbs diagram by cations.
Figure 11. Geochemical classification and hydrochemical parameters of groundwater (after Chadha, 1999, Raju 2012).

 (a) (b)
Figure 12. Geochemical classification and hydrochemical parameters of groundwater. (a) Chadha diagram(pre-monsoon); (b) Chadha diagram(post-monsoon).
combination of two diagrams would be convenient to illustrate the general types of groundwater in laboratory scales.
5. Conclusion
This study compared the geochemical characteristics of groundwater from samples obtained in rural areas of Korea. The SAR (Sodium Adsorption Ratio), Sodium (%), RSC (Residual Sodium Carbonate), PI (Permeability Index), SSP (Residual sodium Percentage), MH (Magnesium Hazard), PS (Potential Salinity) and Kelly’s Ratio were evaluated using the concentration distribution of ions. According to the results, 100% was classified as excellent after applying SAR; approximately 98% was classified as excellent/good/permissible after applying Na (%); 95.0% was classified as good/safe after applying RSC; 99.6% was classified as excellent/good after applying PI; 99.2% was classified as excellent/good after applying SSP; 94.4% was classified as acceptable after applying MH; 98.5% was classified as excellent to good after applying PS; and 93.2% was classified as permissible after applying Kelly’s ratio. Most groundwater samples were classified as “excellent to good” or “good to permissible” using the Wilcox diagram. The evaluation using the U.S. salinity Laboratory’s Diagram also showed that most groundwater samples are C1S1 (Excellent/Excellent) or C2S1 (Good/Ex- cellent). And, in the applications of two factors of Langelier Saturation Index (LSI) and Corrosive ratio (CR) we could get similar results for defining the suitabilities of goroundwater for the industrial purpose. In the Piper diagrams, the  type and
  type were the dominant types for the groundwater classified for each usage type and period. And, in the Chloro Alkaline Indices (CAI) we can conclude that the exchange of sodium and potassium from rock with magnesium and calcium in water and vice versa would be one of the chemical processes during the flow path in the aquifers. And in source-rock deduction and the comparison of Gibbs and Chadah diagram, the chemical components in the groundwater are induced from the water-rock deduction such as followings: dolomite type weathering, gypsum type weathering, alkaline and alkaline type weathering.
Cite this paper
Hwang, J.Y., Park, S., Kim, H.-K., Kim, M.-S., Jo, H.-J., Kim, J.-I., Lee, G.-M., Shin, I.-K. and Kim, T.-S. (2017) Hydrochemistry for the Assessment of Groundwater Quality in Korea. Journal of Agricultural Chemistry and Environ- ment, 6, 1-29. https://doi.org/10.4236/jacen.2017.61001
References
- 1. Raju, N.J., Shukla, U.K. and Ram, P. (2011) Hydrogeochemistry for the Assessment of Groundwater Quality in Varanasi: A Fast-Urbanizing Center in Uttar Pradesh, India. Environmental Monitoring and Assessment, 173, 279-300.
https://doi.org/10.1007/s10661-010-1387-6 - 2. Raju, N.J., Ram, P. and Gossel, W. (2014) Evaluation of Groundwater Vulnerability in the Lower Varuna Catchment Area, Uttar Pradesh, India Using AVI Concept. Journal of the Geological Society of India, 83, 273-278.
https://doi.org/10.1007/s12594-014-0039-9 - 3. Toumi, N., Hussein, B.H., Rafrafi, S. and El Kassas, N. (2015) Groundwater Quality and Hydrochemical Properties of Al-Ula Region, Saudi Arabia. Environmental Monitoring and Assessment, 187, 84.
- 4. Reddy, M.R., Raju, N.J., Reddy, Y.V. and Reddy, T.V.K. (2000) Water Resource Development and Management in the Cuddapah District, Andhra Pradesh, India. Environmental Geology, 39, 342-352.
- 5. Jiang, Y., Wu, Y., Groves, C., Yuan, D. and Kambesis, P. (2009) Natural and Anthropogenic Factors Affecting the Groundwater Quality in the Nandong Karst Underground River System in Yunan, China. Journal of Contaminant Hydrology, 109, 49-61.
https://doi.org/10.1016/j.jconhyd.2009.08.001 - 6. Nandimandalam, J.R. (2012) Evaluation of Hydrogeochemical Processes in the Pleistocene Aquifers of Middle Ganga Plain, Uttar Pradesh, India. Environmental Earth Sciences, 65, 1291-1308.
https://doi.org/10.1007/s12665-011-1377-1 - 7. Raju, N.J., Dey, S., Gossel, W. and Wycisk, P. (2012) Fluoride Hazard and Assessment of Groundwater Quality in the Semi-Arid Upper Panda River Basin, Sonbhadra District, Uttar Pradesh, India. Hydrological Sciences Journal, 57, 1433-1452.
https://doi.org/10.1080/02626667.2012.715748 - 8. Abdesselam, S., Halitim, A., Jan, A., Trolard, F. and Bourrié, G. (2013) Anthropogenic Contamination of Groundwater with Nitrate in Arid Region: Case Study of Southern Hodna (Algeria). Environmental Earth Sciences, 70, 2129-2141.
https://doi.org/10.1007/s12665-012-1834-5 - 9. Khashogji, M.S. and El Maghraby, M.M.S. (2013) Evaluation of Groundwater Resources for Drinking and Agricultural Purposes, Abar Al Mashi Area, South Al Madinah Al Munawarah City, Saudi Arabia. Arabian Journal of Geosciences, 6, 3929- 3942.
https://doi.org/10.1007/s12517-012-0649-8 - 10. Alaya, M.B., Saidi, S., Zemni, T. and Zargouni, F. (2014) Suitability Assessment of Deep Groundwater for Drinking and Irrigation Use in the Djeffara Aquifers (Northern Gabes, South-Eastern Tunisia). Environmental Earth Sciences, 71, 3387- 3421.
https://doi.org/10.1007/s12665-013-2729-9 - 11. Iranmanesh, A., Locke, R.A. and Wimmer, B.T. (2014) Multivariate Statistical Evaluation of Groundwater Compliance Data from the Illinois Basin-Decatur Project. Energy Proceedia, 63, 3182-3194.
- 12. Singh, S., Raju, N.J., Gossel, W. and Wycisk, P. (2015) Assessment of Pollution Potential of Leachate from the Municipal Solid Waste Disposal Site and Its Impact on Groundwater Quality, Varanasi Environs, India. Arabian Journal of Geosciences, 9, 131.
- 13. Vasanthavigar, M., Srinivasamoorthy, K., Ganthi, R.R., Vijayaragavan, K. and Saram, V.S. (2012) Characterization and Quality Assessment of Groundwater with a Special Emphasis on Irrigation Utility: Thirumanimuttar Sub-Basin, Tamil Nadu, India. Arabian Journal of Geosciences, 5, 245-258.
https://doi.org/10.1007/s12517-010-0190-6 - 14. Jawad Alobaidy, A.H.M., Al-Sameraiy, M.A., Kadhem, A.J. and Mageed, A.A. (2010) Evaluation of Treated Municipal Wastewater Quality for Irrigation. Journal of Environmental Protection, 1, 216-225.
https://doi.org/10.4236/jep.2010.13026 - 15. Barick, S.R. and Ratha, B.K. (2014) Hydro-Chemical Analysis and Evaluation of Groundwater Quality of Hial Area, Bolangir District, Odisha, India. Journal of Geosciences and Geomatics, 2, 22-28.
- 16. Singh, S., Ruju, N.J. and Ramakrishna, C. (2015) Evaluation of Groundwater Quality and Its Suitability for Domestic and Irrigation Use in Parts of the Chandauli-Varnashi Region, Uttar Pradesh, India. Journal of Water Resource and Protection, 7, 572-587.
- 17. Kaka, E.A., Akiti, T.T., Nartey, V.K., Bam, E.K.P. and Adomako, D. (2011) Hydrochemistry and Evaluation of Groundwater Stability for Irrigation and Drinking Purpose in the Southeastern Volta River Basin: Manya Korobo Area, Ghana. Elixir Agriculture, 39, 4973-4807.
- 18. Chakraborty, B., Adhikari, K., Sadhu, K. and Gangopadhyay, A. (2012) Hydrochemistry of Aquifers as a Function of Underground Mining of Gondwana Coal: Eastern Fringe of Raniganj Coalfield, India. International Journal of Research in Chemistry and Environment, 2, 310-322.
- 19. Asiwaju-Bello, Y.A., Olabode, F.O., Duvbiama, O.A., Iyamu, J.O., Adeyemo, A.A. and Onigbinde, M.T. (2013) Hydrochemical Evaluation of Groundwater in Akura Area, Southwestern Nigeria, for Irrigation Purpose. European International Journal of Science and Technology, 2, 235-249.
- 20. Badmus, B.S., Ozebo, V.C., Idowu, O.A., Ganiyu, S.A. and Olurin, O.T. (2014) Groundwater Assessment of Hand Dug Wells around Open Landfill in Ibadan Metropolis for domestic and Irrigation Purpose. Journal of Water Resource and Protection, 6, 1412-1424.
https://doi.org/10.4236/jwarp.2014.615130 - 21. Shyam, R. and Kalwania, G.S. (2011) Ground Water Chemistry: A Case Study of Eastern Part of Sikar City (Rajastan), India. International Journal of Applied Engineering Research, Dindigul, 2, 378-389.
- 22. Obienfuna, G.I. and Orazulike, D.M. (2011) The Hydrochemical Characteristics and Evolution of Groundwater in Semiarid Yola Area, Northeast, Nigeria. Research Journal of Environmental and Earth Sciences, 3, 400-416.
- 23. Ishaku, J.M., Ahmed, A.S. and Abubakar, M.A. (2011) Assessment of Groundwater Quality Using Chemical Indicies and GIS Mapping in Jada Area, Northeastern Nigeria. Journal of Earth Sciences and Geochemical Engineering, 1, 35-60.
- 24. Wilcox, L.V. (1955) Classification and Use of Irrigation Water. USDA, Washington DC. (Circular 969)
- 25. US Salinity Laboratory (1954) Diagnosis and Improvement of Saline and Alkaline Soils. Handbook No. 60, US Department of Agriculture, 160.
- 26. Rao, N.S., Vidyasagar, G., Rao, P.S. and Bhanumurthy, P. (2014) Chemistry and Quality of Groundwater in a Coastal Region of Andhra Pradesh, India. Applied Water Science, 1-10.
- 27. Grisak, G.E., Jackson, R.E. and Pickens, J.F. (1978) Monitoring Ground Water Quality: The Technical Difficulties. In: Everett, L.G. and Schmidt, K.D., Eds., Establishment of Water Quality Monitoring Program, American Water Resources Association.
- 28. Gibb, J.P., Sculler, R.M. and Griffin, R.A. (1981) Procedures for the Collection of Representative Water Quality Data from Monitoring Wells. Cooperative Groundwater Report 7, Illinois State Water and Geological Surveys, Champaign, IL, 61.
- 29. Schuller, R.M., Gibb, J.P. and Griffin, R.A. (1995) Recommended Sampling Procedures for Monitoring Wells. Ground-Water Monitoring Review, 192, 42-46.
- 30. Claassen, H.C. (1982) Guidelines and Techniques for Obtaining Water Samples That Accurately Represent the Water Chemistry of an Aquifer. Open-File Report 82-1024, US Geological Survey, Lakewood, CO, 49 p.
- 31. USEPA, Handbook, Groundwater, Volume II: Methodology, EPA/625/6-900/016b, US Environmental Protection Agency, Office of Research and Development, Center for Environmental Research Information, Washington DC, 141 p.
- 32. Jalali, M. (2009) Phosphorous Concentration, Solubility and Species in the Groundwater in a Semi-Arid Basin, Southern Malayer, Western Iran. Environmental Geology, 57, 1011-1020.
https://doi.org/10.1007/s00254-008-1387-9 - 33. Jalali, M. (2011) Nitrate Pollution of Groundwater in Toyserkan, Western Iran. Environmental Earth Sciences, 62, 907-913.
https://doi.org/10.1007/s12665-010-0576-5 - 34. Marghade, D., Malpe, D.B. and Zade, A.B. (2011) Geochemical Characterization of Groundwater from Northeastern Part of Nagpur Urban, Central India. Environmental Earth Sciences, 62, 1419-1430.
https://doi.org/10.1007/s12665-010-0627-y - 35. Todd, D.K. (1980) Groundwater Hydrology. 2nd Edition, John Wiley & Sons, New York.
- 36. Rao, N.S. (2006) Seasonal Variation of Groundwater Quality in a Part of Guntur District, Andhra Pradesh, India. Environmental Geology, 49, 413-429.
https://doi.org/10.1007/s00254-005-0089-9 - 37. Kumar, M., Kumari, K., Ramanathan, A.L. and Saxena, R. (2007) A Comparative Evaluation of Groundwater Suitability for Irrigation and Drinking Purposes in Two Intensively Cultivated Districts of Punjab, India. Environmental Geology, 53, 553-574.
https://doi.org/10.1007/s00254-007-0672-3 - 38. Doneen, L.D. (1964) Notes on Water Quality in Agriculture. Published as a Water Science and Engineering, Paper 4001, Department of Water Sciences and Engineering, University of California, Davis.
- 39. Hem, J.D. (1985) Study and Interpretation of the Chemical Characteristics of Natural Waters. United States Geological Survey, Water Supply Paper 1473, USGS, Washington DC.
- 40. Paliwal, K.V. (1972) Irrigation with Saline Water, Monogram No. 2 (New Series). IARI, New Delhi, 198.
- 41. Kelly, W.P. (1940) Permissible Composition and Concentration of Irrigated Waters. Proceedings of the American Society of Civil Engineers, 66, 607-613.
- 42. Sundaray, S.K., Nayak, B.B. and Bhatta, D. (2009) Environmental Studies on River Water Quality with Reference to Suitability for Agricultural Purposes: Mahanadi River Estuarine System, India—A Case Study. Environmental Monitoring and Assessment, 155, 227-243.
https://doi.org/10.1007/s10661-008-0431-2 - 43. Doneen, L.D. (1954) Salination of Soil by Salts in the Irrigation Water. American Geophysical Union Transactions, 35, 943-950.
https://doi.org/10.1029/TR035i006p00943 - 44. Patel, P., Raju, N.J., Raja Reddy, B.C.S., Suresh, U., Gossel, W. and Wycisk, P. (2016) Geochemical Process and Multivariate Statistical Analysis for the Assessment of Groundwater Quality in the Swarnamukhi River Basin, Andra Pradesh, India. Environmental Earth Sciences, 75, 611.
https://doi.org/10.1007/s12665-015-5108-x - 45. Piper, A.M. (1944) A Graphical Interpretation of Water Analysis. Eos Transactions American Geophysical Union, 25, 914-928.
https://doi.org/10.1029/TR025i006p00914 - 46. Gibbs, R.J. (1970) Mechanisms Controlling World Water Chemistry. Science, 170, 1088-1090.
https://doi.org/10.1126/science.170.3962.1088 - 47. Chadha, D.K. (1999) A Proposed New Diagram for Geochemical Classification of Natural Waters and Interpretation of Chemical Data. Hydrogeology Journal, 7, 431-439.
https://doi.org/10.1007/s100400050216 - 48. Ayers, R.S. and Westcot, D.W. (1985) Water Quality for Agriculture. FAO Irrigation And Drainage Paper No. 29 Rev. 1, 1-109.
- 49. Wilcox, L.V. (1948) Classification and Use of Irrigation Waters. US Department of Agriculture, Washington. (Circular 962)
- 50. Raghunath, H.M. (1987) Groundwater. Wiley Eastern Ltd., Delhi.
- 51. Eaton, F.M. (1950) Significance of Carbonates in Irrigation Waters. Soil Science, 69, 123-133.
https://doi.org/10.1097/00010694-195002000-00004 - 52. Szabolcs, I. and Darab, C. (1964) The Influence of Irrigation Water of High Sodium Carbonate Content of Soils. Proceedings of 8th International Congress of ISSS, Trans II, 803-812.
- 53. Rasouli, F., Pouya, A.K. and Cheraghi, S.A.M. (2012) Hydrogeochemistry and Water Quality Assessment of the Kor-Sivand Basin, Fars Province, Iran. Environmental Monitoring and Assessment, 184, 4861-4877.
- 54. Paliwal, K.V. (1967) Effect of Gypsum Application on the Quality of Irrigation Waters. The Madras Agricultural Journal, 59, 646-647.
- 55. ASTM (1998) Standard Practice for Calculation and Adjustment of the Langelier Saturation Index for Reverse Osmosis. D3739-D3794.
- 56. Tchobanoglous, G., Burton, F.L. and Stensel, H.D. (2003) Wastewater Engineering: Treatment and Reuse. 4th Edition, McGraw-Hill, New York.
- 57. Garrels, R.M. (1976) A Survey of Low Temperature Water Mineral Relations, in Interpretation of Environmental Isotope and Hydrogeochemical Data in Groundwater Hydrology. International Atomic Energy Agency, Vienna, 65-84.
- 58. Datta, P.S. and Tyagi, S.K. (1996) Major Ion Chemistry of Groundwater in Delhi Area: Chemical Weathering Processes and Groundwater Flow Regime. Journal of Geological Society of India, 47, 179-188.
- 59. Lakshmanan, E., Kannan, R. and Kumar, M.S. (2003) Major Ion Chemistry and Identification of Hydrochemical Processes of Groundwater in a Part of Kancheepuram District, Tamil Nadu, India. Environmental Geoscience, 10, 156-166.
https://doi.org/10.1306/eg100403011 - 60. Garrrels, R.M. and Mackenzie, F.T (1967) Origin of the Chemical Composition of Some Springs and Lakes. In: Stumm, W., Ed., Equlibrium Concepts in Natural Water Systems, American Chemical Society, Washington DC, 222-242.
- 61. Hounslaw. W. (1995) Water Quality Data: Analysis and Interpretation. CRC Press, Boca Raton.