Journal of Agricultural Chemistry and Environment
Vol.2 No.3(2013), Article ID:35633,7 pages DOI:10.4236/jacen.2013.23006
Dietary exposure estimates of trace elements in selected agricultural products grown in greenhouse and associated health risks in Korean population
2Division of Monitoring and Analysis, Saemangeum Regional Environmental Office, Jeonju, Republic of Korea; *Corresponding Author: jhlee76@korea.kr
Received 11 March 2013; revised 10 May 2013; accepted 24 May 2013
Copyright © 2013 Won-II Kim et al. This is an open access article distributed under the Creative Commons Attribution License, which permits unrestricted use, distribution, and reproduction in any medium, provided the original work is properly cited.
ABSTRACT
This study focuses on the dietary exposure of trace elements (TEs) through the intake of various agricultural products grown in greenhouse, and its corresponding health risks at different age categories in Korean population. It was observed that the mean contents of TEs found in selected agricultural products were well below their guidelines. Mean and 95th percentile intake estimates of TEs were ranged from 0.02 to <1.00 μg/kg/day in Korean population of all age categories, which were well below their reference dose and provisional tolerable daily intake values. Although the mean intakes of Cd at ages 1 - 2 were the highest with 0.72, it was still below the guideline value of 1.0 μg/kg b.w./day. The target hazard quotient values for respective TEs were less than 1.0 in all age categories, indicating that health risks of TEs through intake of single agricultural product were absent. However, the hazard index value of Cd for ages 1 - 2, based on 95th percentile estimates through intake of agricultural products was 1.88, which may cause some adverse health effects. Although, the health risks of TEs through the intake of selected agricultural products were not significant in Korean population of all age categories, this study cautions that considerable attention should be paid to the potential health risks of TEs through intake of various foodstuffs and other exposure pathways.
Keywords: Agricultural Products; Dietary Exposure; Greenhouse; Health Risks; Trace Elements
1. INTRODUCTION
Trace elements (TEs) such as cadmium (Cd), chromium (Cr), copper (Cu), nickel (Ni), lead (Pb), zinc (Zn), and arsenic (As) are distributed in the environments naturally or anthropogenically, released from industrial as well as agricultural use. Most of the TEs, with long half lives can be translocated and accumulated into agricultural products through absorption from contaminated soil [1,2]. Particularly, Cd and Pb are easily absorbed from the soil to roots of agricultural plants [2,3]. High contents of TEs in soil have become one of the most important sources to contaminate the agricultural products, and thus can be easily exposed to human beings through various pathways, such as ingestion of food, dermal contact, and inadvertent ingestion of soil [4]. The food consumption has been suggested to be a major exposure of TEs to humans [5]. Hence, the excessive TEs exposure through intake of agricultural products may be of great concern in causing health risks to consumers [6-8].
The health risks of consumers exposed to TEs through intake of agricultural products were assessed by probabilistic risk assessment to reduce the uncertainty and variability of input parameters [9]. The health risk assessment via TEs exposure routes is required to provide useful data for setting safety guidelines of TEs in agricultural products. The estimated intakes of TEs by food monitoring and its corresponding health risks have been extensively studied by many investigators [6,10-14]. However, only a few studies on the health risks of populations exposed to TEs through the consumption of agricultural products grown in greenhouse have been documented [15,16]. Therefore, the present study was to investigate the TEs contents in various agricultural products cultivated in greenhouse, and to determine the health risks for consumers in different age categories based on estimated daily intakes (EDIs).
2. MATERIALS AND METHODS
2.1. Sampling
A monitoring study was conducted during April and Fall 2010, to ensure the safety of agricultural products across all provinces in Korea. The geographical locations of sampling sites are shown in Figure 1. A total of 440 samples from 11 agricultural products grown in plastic film greenhouses were collected as follows; spinach (n = 17), lettuce (n = 25), tomato (n = 83), green pumpkin (n = 36), cucumber (n = 80), white radish (n = 20), Chinese cabbage (n = 33), oriental melon (n = 31), pepper (n = 37), watermelon (n = 35), and strawberry (n = 43). All samples were placed in labeled plastic bags, transported to laboratory immediately, and then stored at 4˚C prior to analysis.
2.2. Sample Preparation and Chemical Analysis
The TEs in 11 agricultural products were analyzed by homogenizing their edible parts as described in Food Code, Korea [17]. Briefly, 2 g samples transferred into high pressured-polytetrafluoroethylene vessel were digested with 7 mL conc. HNO3 and 1 mL H2O2 using microwave digestion system (ETHOS, Milestone Inc., Shelton, CT, Italy). After cooling to room temperature, the digestates were filtered with 0.45 μm membrane filter, and adjusted to a final volume of 20 mL. The contents of TEs were determined by inductively coupled plasma mass spectrophotometer (ICP-MS, Agilent technologies 7500a, Santa Clara, CA). Triplicates were performed for TEs analysis in all samples. The control samples spiked with 10 and 50 μg/L standard solutions were pretreated and analyzed in the same manner as the other samples. The average recovery (%) of TEs ranged from 97.40 ± 6.88 to 106.15 ± 1.88 for all agricultural products. The relative standard deviation (RSD) was less than 15%, with majority of samples showed RSD of less than 10%.

Figure 1. Geographical locations of the sampling sites of 11 agricultural products in Korea.
2.3. Health Risk Assessment
The health risk assessment was performed in the Korean population which was categorized as general population, children (ages 1 - 12), and adults (ages 13 - >65). Probabilistic risk assessment was conducted using MonteCarlo simulation in this study. This method assume the probability distributions of input parameters to produce various scenarios performing 100,000 iterations using commercially available software Crystal ball 11.1.0 ver. (Oracle Co., Redwood Shores, CA, USA). Estimated daily intakes were calculated mainly using the contents of TEs and consumption rate of selected agricultural products by following modified Eq.1 [3]. These EDIs values were indicated by both mean and 95th percentile values, assuming the average and largest consumption of agricultural products.
EDIs (mg/kg-days) = 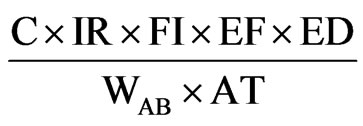 (1)
(1)
where, C is total TEs content in agricultural products (mg/kg); IR is ingestion rate of agricultural products (kg/person/day); FI is absorption factor for intake of agricultural products (unit less; 1); EF is exposure frequency (365 days/year); ED is the exposure duration (years); WAB is the average body weight of population in different age categories (kg); AT is the average time of the exposed person (years).
Non-detectable values of TEs were set to a half of the limit of detection (LOD), which is commonly recommended for EDIs calculation [3]. Exposure duration of 70 years (lifetime exposure) is recommended for determining EDIs [18]. Average body weight in different age categories, lifetime expectancy, and average daily consumption of 11 agricultural products for each age category were provided by the Korea National Health and Nutrition Examination Survey [19].
Health risks were assessed by target hazard quotient (THQ) and hazard index (HI), which are considered as non-carcinogenic toxic effects by previous investigators [20]. Toxic effects for non-carcinogens are indicated by THQ value, which was calculated by comparing EDI values and each reference dose (RfD) of TEs using Eq.2 [20].
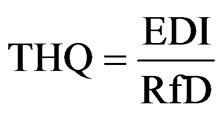 (2)
(2)
The RfD values for Cr, Cu, Ni, and Zn were 1500, 40, 20, and 300 μg/kg/day, respectively [21]. Moreover, the respective provisional tolerable daily intake (PTDI, μg/kg/day) values for Cd, Pb and As compounds were 1.0, 3.6 and 50 μg/kg/day. The PTDI values were calculated by dividing the provisional tolerable weekly intake (PTWI, μg/kg/day) by 7, set by the Joint FAO/WHO Expert Committee on Food Additives (JECFA) [22,23].
When the population is exposed to all agricultural products contaminated with TEs, the HI values were calculated by summing up the THQ values for TEs exposure through intakes of single agricultural product, to estimate the overall health risk using the following Eq. 3 [20].
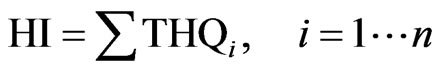 (3)
(3)
The equation assumes that the additive and interactive effects among TEs constituents in agricultural products were taken into account. If HI value is less than 1.0, the tested sample is believed to be safe. If it exceeds 1.0, the health risk due to human dietary exposure of TEs through consumption of agricultural products may be assumed to be significant, showing increased probability of health risks as the THQ value increased [24].
3. RESULTS AND DISCUSSION
3.1. Distribution of Trace Elements
The contents of TEs in 11 agricultural products are listed in Table 1. The results indicated that the contents of Zn and Cd were the highest and lowest, respectively among selected agricultural products, and decreased in the order of Zn > Cu > Ni > Cr > Pb > As > Cd (Table 1). Particularly, the contents of Cd, Pb and As, also known as potential toxic elements (PTEs) were estimated to be relatively low in all agricultural products. The TEs contents in selected agricultural products ranged from 1.780 to 8.065 for Zn, 0.253 - 1.183 (Cu), 0.037 - 0.134 (Ni), 0.030 - 0.115 (Cr), 0.019 - 0.082 (Pb), 0.011 - 0.046 (As) and 0.002 - 0.021 mg/kg for Cd (Table 1). These results were similar with the results reported by RDA (2009) [25], which showed the TEs contents in a decreasing order of Cu > Pb > As > Cd in agricultural products studied from major crop producing areas in Korea. Moreover, the mean contents were ranged from 0.292 to 1.340 mg/kg for Cu, 0.014 - 0.056 mg/kg for Pb, 0.0001 - 0.009 mg/kg for As, and 0.001 - 0.012 mg/kg for Cd.
The agricultural products with the highest concentrations of TEs were present as follows: spinach with Cd, Cr, Cu, and Zn, pepper with Ni and As, and oriental melon with Pb (Figure 2). Spinach contained the highest mean contents of Cd, Cr, Cu, and Zn which were 0.021, 0.115, 1.183, and 8.065 mg/kg, respectively. The mean contents of Ni and As in pepper, and Pb in oriental melon were also high, showing contents of 0.134, 0.046, and 0.082 mg/kg, respectively. However, the contents of TEs among each agricultural product were not significantly different (p > 0.05). RDA (2009) [25] reported that the highest contents of Cd, As, and Cu were derived from pepper, and those of Pb were from oriental melon, with a range of 0.021 - 0.127 mg/kg. Pepper along with spinach,
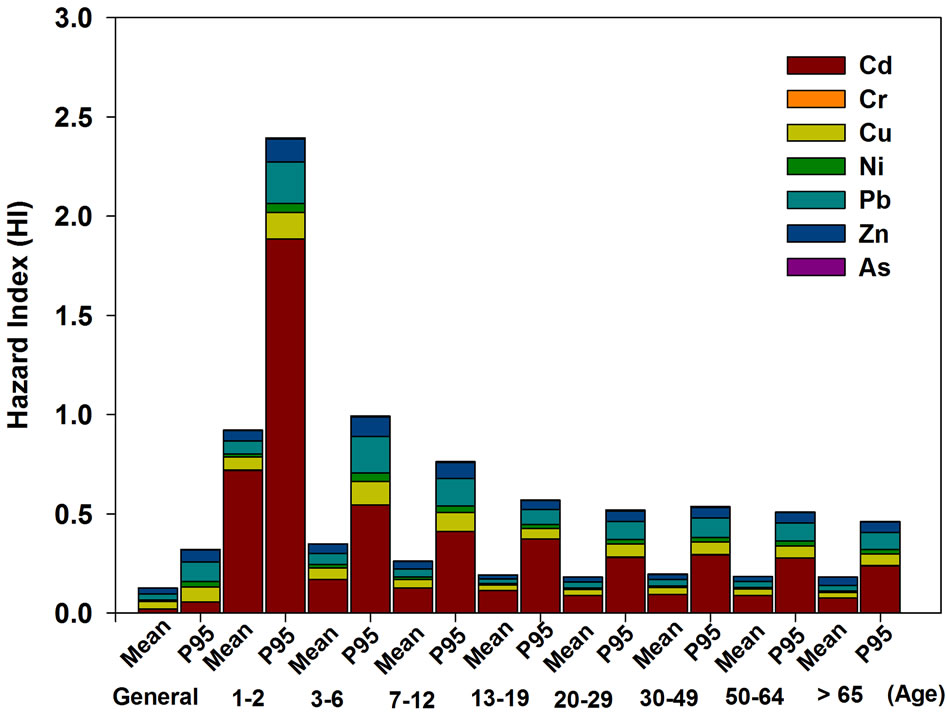
Figure 2. Hazard index (HI) at mean (a) and 95th percentile (b) for consumers in each age category.
also had relatively high contents of TEs, compared to other agricultural products (Table 1). The mean values, 0.015, 0.055, 0.046, and 1.073 mg/kg for Cd, Pb, As, and Cu respectively, obtained in this study, were slightly different from results reported by RDA (2009) [25]. Such variability may be due to differences in soil properties of sampling sites, and environmental conditions [13].
The results revealed that the mean contents of PTEs were well below the guidelines for agricultural products, set by EU (2004) [26] and FAO/WHO (2000) [27]. The guideline value of Cd is set at 0.2 mg/kg for leafy vegetables, 0.1 mg/kg for root vegetables, and 0.05 mg/kg for fruits and vegetables except for pepper and pumpkin (0.1 mg/kg). The guideline value of Pb is 0.3 mg/kg for leafy vegetables, 0.1 mg/kg for root vegetables, and fruits and vegetables, except for pepper, pumpkin berries and small fruits (0.2 mg/kg). The guideline value of As is 1.0 mg/kg for leafy vegetables and 0.05 mg/kg for fruits and vegetables, set by Japan and China on the basis of arsenic trioxide and inorganic As contents [17,28].
3.2. Dietary Intake Estimates of Trace Elements
The mean and 95th percentile intake estimates of TEs were calculated using contents and consumption rates of respective agricultural products. Calculated mean and 95th percentile intakes of populations in each age category, assuming mean and highly exposed consumers to agricultural products, are presented in Table 2. Mean intake estimates of Cu and Zn were the highest at all age categories, with < 3 and 10 μg/kg body weight (b.w.)/day, respectively. However, these values were well below the RfD of 40 and 300 μg/kg b.w./day, established by US EPA [21]. For other TEs (Cd, Cr, Ni, Pb, and As), the mean and 95th percentile EDIs showed a similar range of 0.02 - <1.00 μg/kg b.w./day, which were also well below the RfD values assigned by US EPA Integrated Risk Information System (IRIS). The daily intake of Cd was estimated to be lowest, even at 95th percentile intakes in the general population category. RDA (2009) [25] assessed the mean EDIs of Cd, Pb, and As to be 0.003, 0.02, and 0.004 μg/kg b.w./day, respectively, which demonstrated lower concentrations than the results in this study. This difference may be attributed to the lower concentrations of Cd, Pb, and As in agricultural products collected from major crop producing areas in Korea.
When comparing among age categories of populations, the mean EDIs of TEs were the highest for 1 - 2 age categories, with a range of 1.03 × 10⁻¹ - 7.20 × 10⁻¹ which were still below the guideline values. The Cd exposure for 1 - 2 ages through dietary intakes was estimated to be the highest at 7.20 × 10⁻¹, which was also below guideline value of 1.0 μg/kg b.w./day. Kim et al. (2011) [29] reported that EDIs of TEs for infants less than 2 years of age through consumption of pulses, lettuces, pumpkins, apples, pears, and tangerines were relatively higher than those for other age groups. In another similar study, Tsuji et al. (2004) [30] reported that the mean intake estimates of As were high at 0 - 6 age groups, which they attributed to high intake rates of As per body weight, via drinking water and food.
3.3. Health Risk Assessment
Health risks based on mean and 95th percentile EDIs of TEs were indicated as HI values (Figure 2). The HI values were determined by the sum of THQ values for individual TE exposure through consumption of selected agricultural products. The THQ values for respective TEs did not exceed 1.0 in any age category through the intake of a single agricultural product, suggesting that the Korean population will not face a significant potential health risk from the individual consumption of agricultural products. However, the HI value of Cd from mean intakes of all agricultural products was estimated to be highest for all age categories, and was in decreasing order of Cd  Pb ≈ Cu ≈ Zn > Ni > As ≈ Cr. Although Cd had much lesser concentrations and estimated intakes than Zn (Tables 1 and 2), the HI value was found to be the highest (Figure 2). Moreover, children aged 1 - 2 had the greatest potential health risks, with a HI value of 0.72, whereas other age categories showed HI values of 0.02 - 0.17 for Cd exposure through mean intakes of all agricultural products. This may be due to higher toxicity of Cd than Zn, which consequently increased the health risks. Assuming a fairly high consumption of agricultural products, the 95th percentile daily intakes of Cd were estimated to be 1.88, which was over 1.0. This implied that the ages 1 - 2 might have experienced the adverse toxic risks through its accumulation into kidney and liver
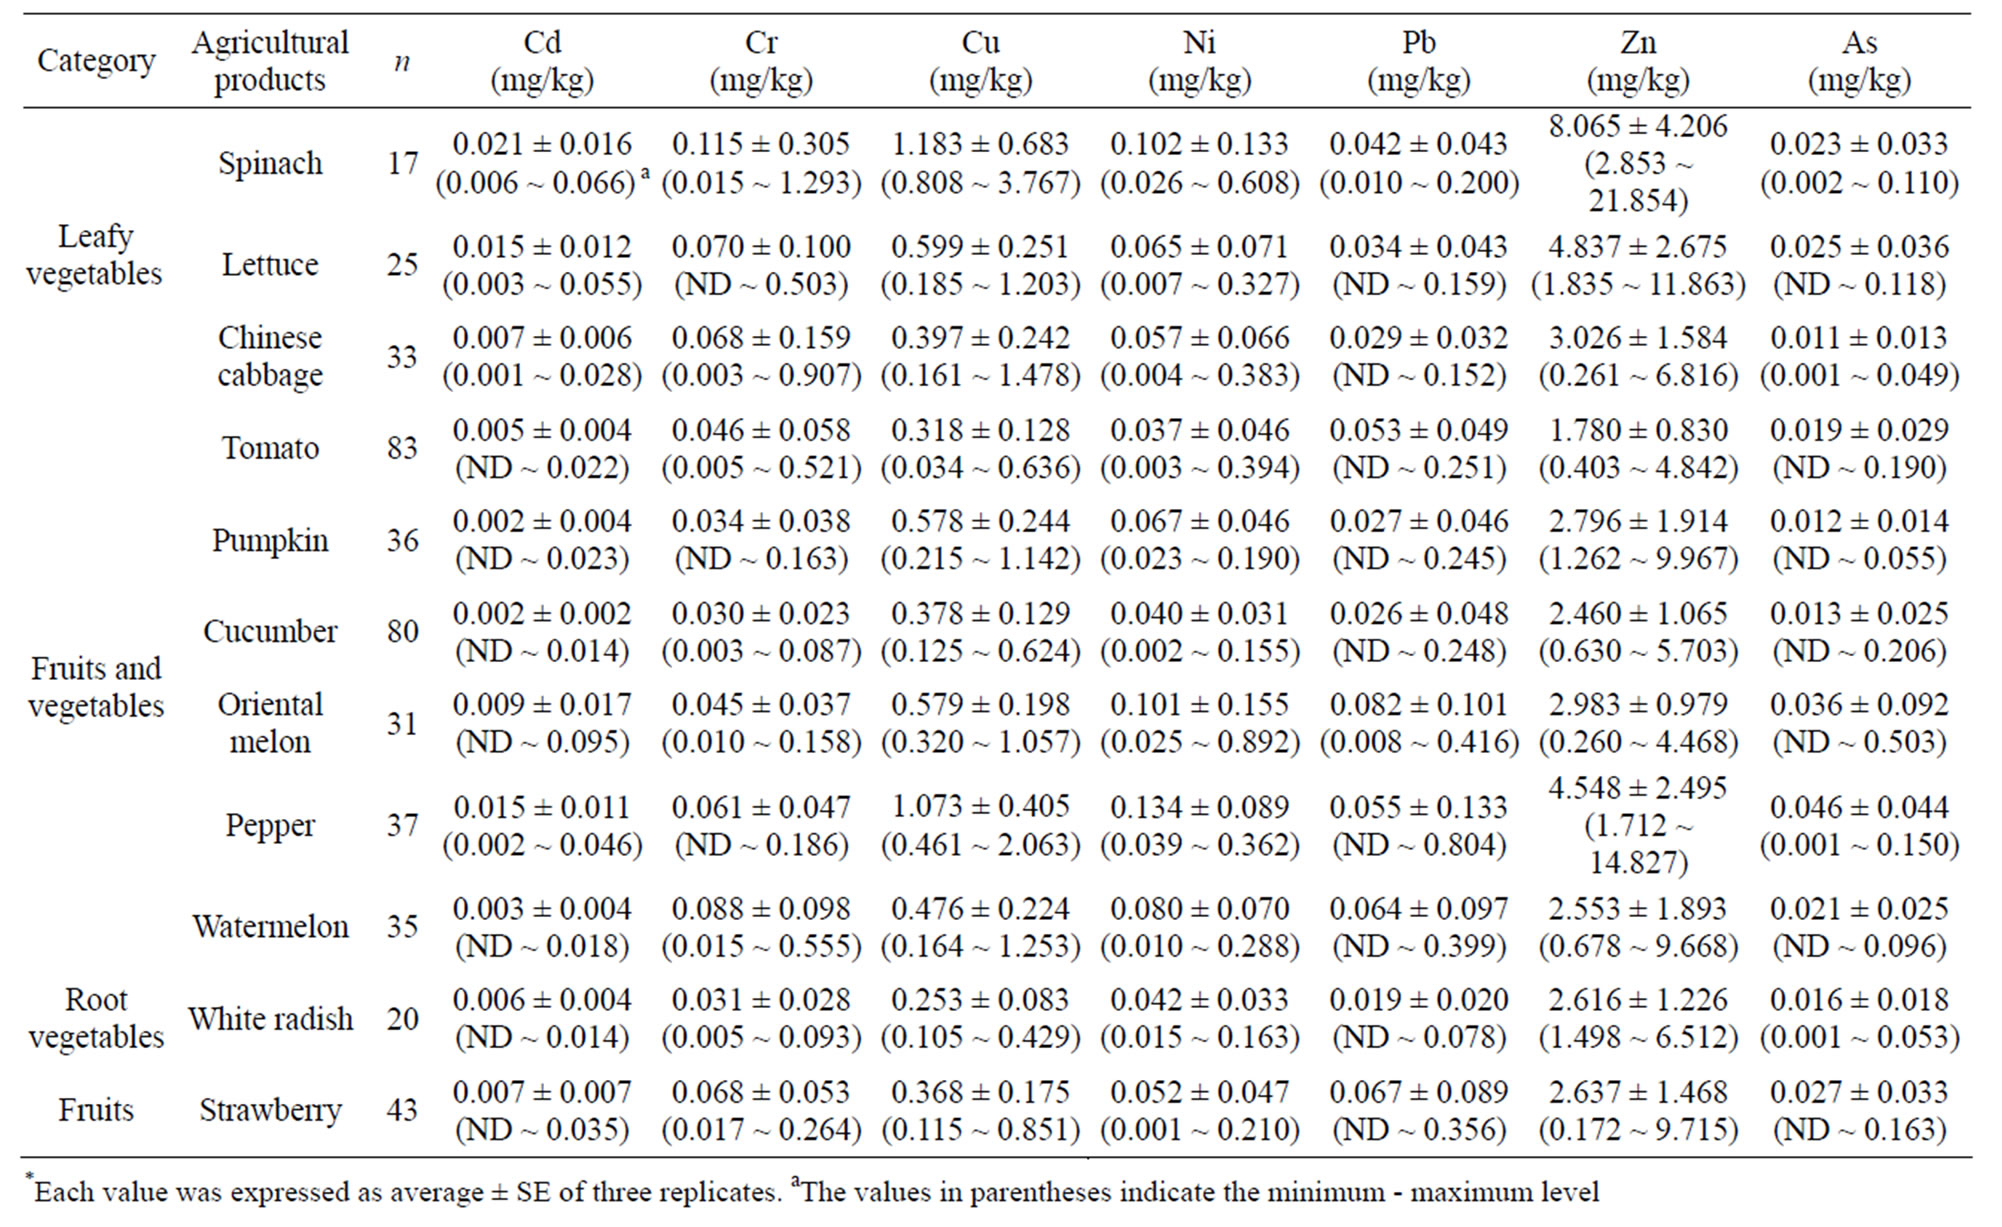
Table 1. Contents of trace elements (TEs) in 11 selected agricultural products, cultivated in greenhouse.
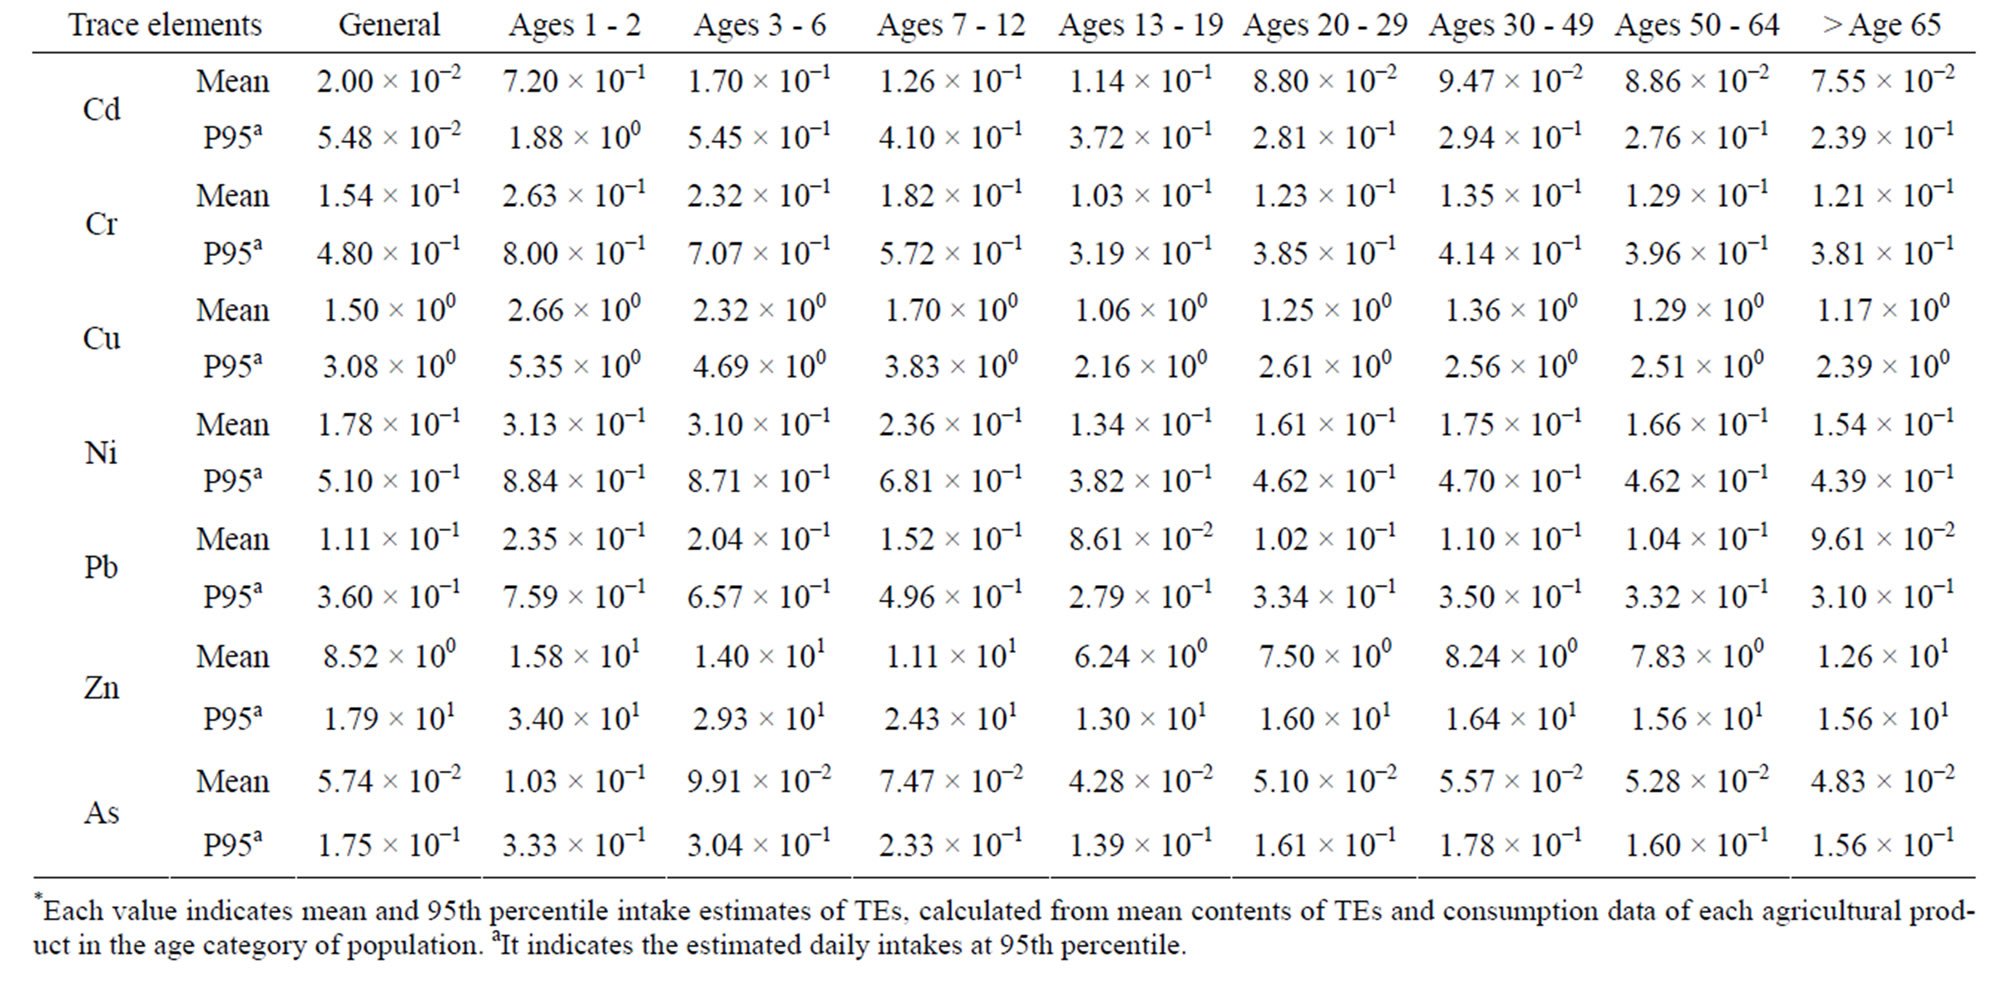
Table 2. Estimated daily intakes (EDIs) for population of each age category, through intakes of 11 selected agricultural products, contaminated with TEs.
for lifetime [6]. Children known as sensitive population, due to relative immaturity and greater susceptibility, were found to have a higher HI value than adults, indicating higher toxic risks [3]. The HI values of Pb, Cu, and Zn in all age categories were almost similar in the range of 0.02 - 0.21, which were well below 1.0. These values were slightly higher for the children’s group than adults. For Pb, the detrimental effects on central nervous system may occur in newborn children [23]. As age increased, the HI values showed a decreased pattern, but there were no large variations in health risks from ages 20 - 29 to >65 age groups. The lowest HI values were estimated to be 0.0001 - 0.007 for As and Cr which demonstrated that they were well below the PTDI and RfD values (Table 2). Inorganic As is more toxic and approximately three times more bioavailable than organic As species [31]. The EDIs for inorganic As and corresponding RfD values also should be considered in estimating the accurate health risks for all age categories. The oral RfD value of As in children, who are presumably more vulnerable to TEs is reported to be 0.1 μg/kg b.w./day [20]. It is necessary to minimize the uncertainty in estimating health risks for children by applying accurate RfD values for children exposed to TEs [32].
3. CONCLUSIONS
The results showed that the health risks caused by dietary exposure of TEs through different agricultural products were less significant in all age categories. The mean contents of TEs in selected agricultural products decreased in the order of Zn > Cu > Ni > Cr > Pb > As > Cd, which were well below the respective guidelines. Mean and 95th percentile intake estimates of Zn were the highest in Korean population of all age categories, and those of other TEs ranged from 0.02 to < 1.00 μg/kg/day, but they were all well below their RfD and PTDI values. Even though the Cd exposure at ages 1 - 2 through dietary intakes was found to be the highest, it was still below the guideline value. The contribution of respective agricultural products to the mean intake estimates of TEs, except for Cd was estimated to be approximately less than 20% in all age categories. None of the THQ values for respective TEs was greater than 1.0 in any age category through the intake of a single agricultural product. However, the HI value of Cd based on mean intakes was the highest for all age categories including ages 1 - 2 which showed a HI value of 1.88 at 95th percentile level implying a low possibility of detrimental health effects.
Although our study demonstrated that the potential health risks of TEs through agricultural products in Korean population were insignificant, humans are exposed to TEs through consumption of water and other foods such as rice, wheat, fish, meat, eggs, milk and also other exposure pathways. Total exposure of TEs from food may have been fairly underestimated and therefore further research must pay considerable attention to the potential health risks of TEs from various foodstuffs to accomplish a more realistic risk assessment.
REFERENCES
- Huang, R.Q., Gao, S.F., Wang, W.L., Staunton, S. and Wang, G. (2006) Soil arsenic availability and the transfer of soil arsenic to crops in suburban areas in Fujian Province, southeast China. Science of the Total Environment, 368, 531-541. doi:10.1016/j.scitotenv.2006.03.013
- Römkens, P.F.A.M., Guo, H.Y., Chu, C.L., Liu, T.S., Chiang, C.F. and Koopmans, G.F. (2009) Prediction of cadmium uptake by brown rice and derivation of soilplant transfer models to improve soil protection guidelines. Environmental Pollution, 157, 2435-2444. doi:10.1016/j.envpol.2009.03.009
- Qian, Y., Chen, C., Zhang, W., Chen, Z. and Li, M. (2010) Concentrations of cadmium, lead, mercury and arsenic in Chinese market milled rice and associated population health risk. Food Control, 21, 1757-1763. doi:10.1016/j.foodcont.2010.08.005
- Chatterjee, D., Halder, D., Santanu, M., Biswas, A., Nath, B., Bhattacharya, P., Bhowmick, S., Mukherjee-Goswami, A., Saha, D., Hazra, R., Maity, P.B., Chatterjee, D., Mukherjee, A. and Bundschuh, J. (2010) Assessment of arsenic exposure from groundwater and rice in Bengal Delta Region, West Bengal, India. Water Research, 44, 5803- 5812. doi:10.1016/j.watres.2010.04.007
- Meharg, A.A. and Rahman, M. (2003) Arsenic contamination of Bagladesh paddy field soils: Implications for rice contribution to arsenic consumption. Environmental Science & Technology, 37, 229-234. doi:10.1021/es0259842
- Larsen, E.H., Andersen, N.L., Møller, A., Petersen, A., Mortensen, G.K. and Petersen, J. (2002) Monitoring the content and intake of trace elements from food in Denmark. Food Additives and Contaminants, 19, 33-46. doi:10.1080/02652030110087447
- Liu, C.P., Luo, C.L., Gao, Y., Li, F.B., Lin, L.W., Wu, C.A. and Li, X.D. (2010) Arsenic contamination and potential health risk implications at an abandoned tungsten mine, Southern China. Environmental Pollution, 158, 820-826. doi:10.1016/j.envpol.2009.09.029
- Singh, A.S., Sharma, R.K., Agrawal, M. and Marshall, F.M. (2010) Health risk assessment if heavy metals via dietary intake of foodstuffs from the wastewater irrigated site of a dry tropical area of India. Food and Chemical Toxicology, 48, 611-619. doi:10.1016/j.fct.2009.11.041
- Mondal, D. and Polya, D. (2008) Rice in a major exposure route for arsenic in Chakdaha block, Nadia district, West Bengal, India: A probabilistic risk assessment. Applied Geochemistry, 23, 2987-2998. doi:10.1016/j.apgeochem.2008.06.025
- Chen, C., Qian, Y., Chen, Q. and Li, C. (2011) Asssessment of daily intake of toxic elements due to consumption of vegetables, fruits, meat, and seafood by inhibitants of Xiamen, China. Journal of Food Science, 76, 181-188. doi:10.1111/j.1750-3841.2011.02341.x
- Egan, S.K., Tao, S.S.H., Pennington, J.A.T. and Bolger, P.M. (2002) US food and drug administration’s total diet study: Intake of nutritional and toxic elements, 1991- 1996. Food Additives and Contaminants, 19, 103-125. doi:10.1080/02652030110071354
- Nasreddine, L. and Parent-Massin, D. (2002) Food contamination by metal and pesticides in the European Union. Should we worry? Toxicology Letters, 127, 29-41. doi:10.1016/S0378-4274(01)00480-5
- Santos, E.E., Lauria, D.C. and Porto da Silveirac, C.L. (2004) Assessment of daily intake of trace elements due to consumption of foodstuffs by adult inhabitants of Rio de Janeiro city. Science of the Total Environment, 327, 69-79. doi:10.1016/j.scitotenv.2004.01.016
- Urienta, I., Jaløn, M. and Eguileor, I. (1996) Food surveillance in the basque country (Spain) Ⅱ. Estimation of the dietary intake of organochlorine pesticides, heavy metals, arsenic, aflatoxin M1, iron and zinc through the total diet study. Food Additives and Contaminants, 13, 29-52.
- Aghili, F., Khoshgoftarmanesh, A.H., Afyuni, M. and Schulin, R. (2009) Health risks of heavy metals through consumption of greenhouse vegetables grown in Central Iran. Human and Ecological Risk Assessment, 15, 999- 1015. doi:10.1080/10807030903153337
- Khoshgoftarmanesh, A.H., Aghili, F. and Sanaeiostover, A. (2009) Daily intake of heavy metals and nitrate through greenhouse cucumber and bell pepper consumption and potential health risks for human. International Journal of Food Sciences and Nutrition, 60, 199-208. doi:10.1080/09637480902755087
- Korea Food and Drug Administration (2007) Chinese food standardⅡ.
- An, Y.J. and Lee, W.M. (2007) Comparative study on exposure factors for risk assessment in contaminated lands and proposed exposure factors in Korea. Journal of the Korean Society of Groundwater ENvironment, 12, 64-72.
- National Health and Nutrition Examination Survey (2007) The third Korea National Health and Nutritional Examination Survey-Nutrition survey (I), Korea Health Industry Development Institute, Ministry of Health and Welfare.
- United State Environmental Protection Agency (1999) Guidance for performing aggregate exposure and risk assessment. U.S. EPA, Office of Pesticide Programs, Washington DC.
- United State Environmental Protection Agency, Integrated risk information system (2008) Office of Research and Development, National Center for Environmental Assessment. http://cfpub.epa.gov/ncea/iris/index.cfm
- FAO/WHO (1993) Evaluation of certain food additives and contaminants. 41st Report of Joint FAO/WHO Expert Committee on Food Additives, Geneva.
- FAO/WHO (2003) Joint FAO/WHO Expert Committee on Food Additives, 61st Meeting, Rome, 10-19.
- Zheng, N., Wang, Q., Zhang, X., Zheng, D., Zhang, Z. and Zhang, S. (2007) Population health risk due to dietary intake of heavy metals in the industrial area of Huludao city, China. Science of the Total Environment, 387, 96- 104. doi:10.1016/j.scitotenv.2007.07.044
- RDA (2009) Monitoring of heavy metals in agricultural products. National Academy of Agricultural Science (NAAS), Rural Development Administration, Korea.
- European Commission (2004) Report from Task 3.2.11: Assessment of the dietary exposure to arsenic, cadmium, lead and mercury of the population of the EU member states. European Commission, Directorate-General Health and Consumer Protection. SCOOP Report.
- FAO/WHO (2000) Joint FAO/WHO food standards programme Codex Alimentarius Commission 13th session. Report of the Thirty Eight Session of the Codex Committee on Food Hygiene, Houston.
- JMHLW (2006) Specifications and standards for food and food additives. The Japan Food Chemical Research Foundation, Japan Ministry of Health, Labour and Welfare.
- Kim, J.Y., Choi, N.G., Yoo, J.H., Lee, J.H., Lee, Y.G., Jo, K.K., Lee, C.H., Hong, S.M., Im, G.J., Hong, M.K. and Kim, W.I. (2011) Monitoring and risk assessment of cadmium and lead in agricultural products. Korean Journal of Environmental Agriculture, 30, 330-338.
- Tsuji, J.S., Benson, R., Schoof, R.A. and Hook, G.C. (2004) Health effect levels for risk assessment of childhood exposure to arsenic. Regulatory Toxicology and Pharmacology, 39, 99-110. doi:10.1016/j.yrtph.2003.12.002
- Juhasz, A.L., Smith, E., Weber, J., Rees, M., Rofe, A., Kuchel, T. and Sansom, L. (2006) In vivo assessment of arsenic bioavailability in rice and its significance for human health risk assessment. Environmental Health Perspectives, 114, 1826-1831.
- Meharg, A.A., Sun, G., Williams, P.N., Adomako, E., Deacon, C., Zhu, Y.G., Feldmann, G. and Raab, A. (2008) Inorganic arsenic levels in baby rice are of concern. Environmental Pollution, 152, 746-749. doi:10.1016/j.envpol.2008.01.043
NOTES
*This research was supported by the 2013 Post Doctoral Fellowship Program (PJ008650) of the National Academy of Agricultural Science, Rural Development Administration, Republic of Korea.