Journal of Minerals and Materials Characterization and Engineering
Vol.1 No.4(2013), Article ID:33947,7 pages DOI:10.4236/jmmce.2013.14021
Studies in Effect of Low Concentration of Cenosphere on Mechanical, Thermal, Electrical, Crystallinity, Colorimetric and Morphological Properties of Epoxy Cured with Triethylenetetramine
Department of Polymer Engineering, Institute of Chemical Technology, Mumbai, India
Email: stmhaske@gmail.com
Copyright © 2013 Pravin Kadam et al. This is an open access article distributed under the Creative Commons Attribution License, which permits unrestricted use, distribution, and reproduction in any medium, provided the original work is properly cited.
Received February 16, 2013; revised April 21, 2013; accepted May 2, 2013
Keywords: Triethylenetetramine; Epoxy; Cenosphere; Crystallinity; Electrical; Thermal; Tensile Strength
ABSTRACT
Cenospheres are produced in very large amount in thermal power plants. They are always looked upon as fillers used to reduce the density and cost of the polymer. If cenosphere particles are allowed to remain properly dispersed by taking it in lower concentration, significant improvement in its mechanical, thermal, electrical, crystallinity, colorimetric and morphological properties are expected. To make it happen, epoxy/cenosphere composites were prepared, having lower concentration of cenosphere. Concentration of cenosphere in epoxy, cured with triethylenetetramine, was changed as 0, 3, 5, 7 and 10. Tensile Strength, Tensile Modulus, Percentage Elongation at Break and Crystallinity decreased, whereas, Flexural Strength and Flexural Modulus were found to have increased by 50% and above 100% respectively at 7 phr loading of cenosphere in epoxy. Thermal and electrical stability also increased with increase in concentration of cenosphere in the epoxy, however, the samples became blackish with increased addition of cenosphere. Using SEM analysis it was found that, cenospheres were properly and uniformly dispersed at 7 phr concentration and formed aggregates at 10 phr concentration.
1. Introduction
Cenospheres are produced large amount in thermal power plants. Being ceramic in nature and hollow micro-spheres, they are a very difficult to get rid of. There are only few ways of utilizing them in an environmentally friendly manner. The use of cenosphere as filler in polymers and ceramics is well known, primarily to decrease the density of the material due to its microspherical nature. Cenospheres being hydrophilic materials, for its use as filler in polymers like PP, HDPE, PS, they are required to be surface treated or modified so as to induce hydrophobicity onto its surface, bringing about better compatibility between it and the matrix polymer. However, for polymers like nylon 6, polyethylene terephthalate, epoxy, unsaturated polyester resin etc. there is no need to modify or surface treat cenosphere. Both being hydrophilic, possess better compatibility [1].
Abdullah et al. utilized amine containing silicone as toughening agent and hollow cenosphere as filler in epoxy resin. Their study was to understand the microstructure formed and its influence on mechanical properties and free volume measurements of the composite. Tensile strength increased whereas tensile modulus decreased with increase in cenosphere content up to 30%, due to low density of the filler [2]. Gu et al. prepared epoxy composite, filled with cenosphere surface treated with different chemicals. Surface modified cenosphere were observed to have distributed uniformly into the epoxy matrix. Surface modified cenosphere/epoxy composite had a wider glass transition temperature region and a higher loss factor, and had relatively higher impact toughness [3]. Deepthi et al. studied the mechanical and thermal properties of high density polyethylene filled with cenosphere. They used cenosphere as filler after silane treatment, and also with a compatibilizer. [4] Cardoso et al. studied the effect of particle size and surface treatment of cenosphere as filler on the properties of polyester resin. [5] Huo et al. studied the preparation of poly-o-phenylenediamine (POPD)/TiO2/fly-ash cenosphere composite and its photo-degradation properties. [6] Chalivendra et al. studied the processing and mechanical characterization of lightweight polyurethane composites using cenosphere. Polyurethane was loaded with cenosphere upto 40% and was tested for mechanical properties to estimate the fracture toughness of the material. Cenosphere decreased the density of the composite. The high strain rate constitutive behavior of 100% polyurethane showed monotonic stiffening whereas the composite at higher cenosphere volume fractions (40%) exhibited a stiffening-softening-stiffening behavior, due to easy flowability induced by cenosphere micro-spheres. [7] Altaweel et al. studied composites of diglycidyl ether of bisphenol A resin modified with amine containing silicone as matrix and fly ash and cenospheres as fillers. Amine containing silicones was found to act as a good coupling agent between the filler and the resin and also showed improved thermal stability. Composites were loaded with 40 phr of cenosphere. [8] Suresha et al. studied the dry three-body abrasive wear behavior of bi-directional glass fabric reinforced epoxy composites with and without cenosphere filler. Cenospheres filler inclusion in glass fiber reinforced epoxy composite showed poor abrasive wear performance. [9] There are many other research papers available using cenosphere mainly to reduce cost or density of the epoxy, but no work is yet reported of using cenosphere as reinforcing agent in epoxy resin cured with triethylenetetramine (TETA) [10].
2. Material and Methods
2.1. Materials
Epoxy resin (PER 257 grade, epoxy equivalent weight = 160) and Triethylenetetramine (TETA, PH-111, amine equivalent weight = 24) hardener were obtained from Pliogrip Resins and Chemical Pvt. Ltd., Mumbai, India. Cenosphere (particle size: 2 - 5 μm) was procured from Nasik Thermal Power Plant, Nashik, India; having chemical composition as shown in the Table 1. All materials were used as obtained without any purification or chemical modification or surface treatment.
2.2. Preparation of Composite
2.2.1. Hardener Quantity Calculation
Quantity of epoxy was maintained constant at 300 g.

This is the theoretical quantity of amine (TETA) required to cross-link Epoxy, reacting them in 1:1 ratio (considering their functionality). But in practice due to thermodynamic and kinetic issues, generally higher quantity of amine is taken. Thus, Epoxy: TETA concentration was maintained at 1:1.5 (considering their functionality). Thus for 300 g of Epoxy, 56.25 g of amine (TETA) was taken for cross-linking.
2.2.2. Casting
Casting method was used to prepare epoxy cenosphere composite. Inorder to have uniformity and comparability, thickness of the sheet to be casted was maintained constant at 2 mm. 300 g Epoxy was added with required quantity of TETA (56.25 g) and was stirred vigorously with high speed stirrer (1500 rpm) so as to obtain a uniform mix. Stirring was continued for 5 min. Calculated amount of cenosphere was then added to the mix and the mix was again stirred vigorously for 5 min. Concentration of cenosphere was varied as 0 phr, 3 phr, 5 phr, 7 phr and 10 phr (phr was calculated on the basis of epoxy resin weight) in the epoxy matrix. The mix was then immediately poured into a 20 cm × 20 cm polyethylene terephthalate (PET) mold (See Figure 1). Height of the mold was maintained at 1 cm, in such a way that the mixture attains the height of 2 mm. Casting was then allowed to cross-link at room temperature for 24 hrs.
Cross-linked sheet was then post-cured at 80˚C for another 4 - 6 hrs so as to get best possible cross-linked epoxy. Standard ASTM based samples for tensile (ASTM D638), flexural (ASTM D790) and impact (ASTM D256) testing were cut from the obtained sheet. Remaining portion of the sheet was used for characterising the thermal (TGA analysis), colorimetric (L*, a*, b* analysis), crystallinity (XRD analysis), morphological (SEM analysis) and electrical (Surface and Volume Resistivity) properties.
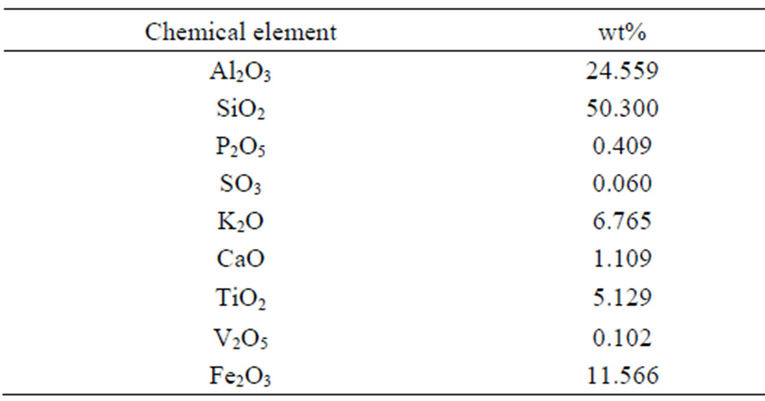
Table 1. Chemical composition of cenosphere obtained from nasik thermal power plant.
2.3. Formulations
The formulations prepared are as shown in the Table 2. Concentration of cenosphere was varied from 0 to 10 phr of Epoxy. Concentration of TETA was maintained constant in such a way that Epoxy and TETA have gram equivalent weights in the ratio of 1:1.5.
3. Characterization and Testing
3.1. Mechanical Properties
Tensile properties (tensile strength, tensile modulus and elongation at break) and flexural properties (flexural strength and flexural modulus) were measured at ambient condition using a Universal Testing Machine (LR-50K, Lloyds Instrument, UK), according to ASTM procedures D638 and D790; at a crosshead speed of 5 mm/min and 0.8 mm/min respectively. Charpy Impact Strength was determined at ambient condition according to ASTM D256, using Impact Tester (Avery Denison, UK) employing a 2.7 J striker having striking velocity of 3.46 m/s.
3.2. Thermal Properties
Thermogravimetric Analysis (Q 500 DSC, TA instruments Ltd., India) characterization was done to investigate the change in degradation temperature and enthalpy of degradation of the cenosphere/epoxy composites. 4 - 5 mg samples were heated from 40˚C to 600˚C at a scanning rate of 10˚C/min.
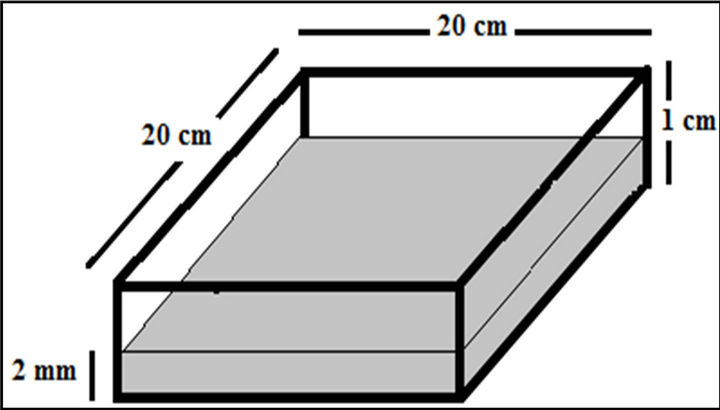
Figure 1. Diagrammatic representation of PET mold used for preparing the cast.
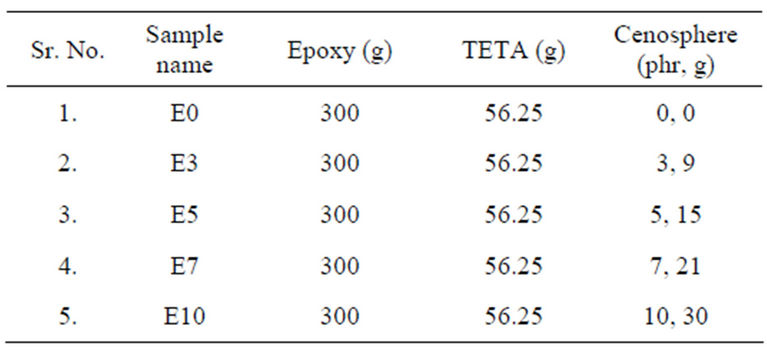
Table 2. Prepared epoxy/cenosphere compositions.
3.3. Electrical Properties
Electrical properties like Surface Resistivity and Volume Resistivity were measured using Million Meghometer (LS-3B, Siva Instruments, India), according to ASTM standard D257.
3.4. Morphological Properties
Scanning Electron Microscope (SEM) analysis was performed with JEOL 6380 LA (Japan). Samples were fractured under liquid nitrogen to avoid any disturbance to the molecular structure and then coated with gold before imaging.
3.5. X-Ray Diffraction Analysis
The XRD analysis was carried out to determine the percentage crystallinity of the prepared composite. A normal focus copper X-ray tube was operated at 30 kV and 15 mA. Sample scanning was done from 2˚ to 60˚ at the rate of 3˚/min. The data processing was done using Jade 6.0 software.
3.6. Colorimetric Properties
CIE L*, a*, b* values for the composites were determined using Colour Spectrophotometer (Color Eye 7000, Optiview Light Quality Control 1.9, Gretag Macbeth, Germany). Illuminant used was D65. Observer was placed at 10˚.
4. Results and Discussion
4.1. Mechanical Properties
Mechanical properties like tensile strength, tensile modulus, percentage elongation at break, flexural strength, flexural modulus and impact strength obtained for epoxy/cenosphere composites with varying concentrations of cenosphere are reported in Table 3.
Tensile strength, percentage elongation at break, impact strength and tensile modulus decreased with the increase in concentration of cenosphere in the epoxy; whereas, flexural strength and flexural modulus increased. Cenospheres being spherical particles, were not able to sustain the interaction, that happened between it and epoxy polymeric chains, when applied with elongational (tensile) force in tensile test. This brought early breakage of bonds between them, creating points of stress concentrate, ultimately decreasing the tensile test values. Similarly in the impact test, specimens were impacted at high velocity with the impact hammer. Due to the spherical nature of the cenosphere particles, were not able to transfer the impact load onto the next neighbouring molecules, decreasing the impact strength. However, when samples were subjected to flexural test, samples were flexed in
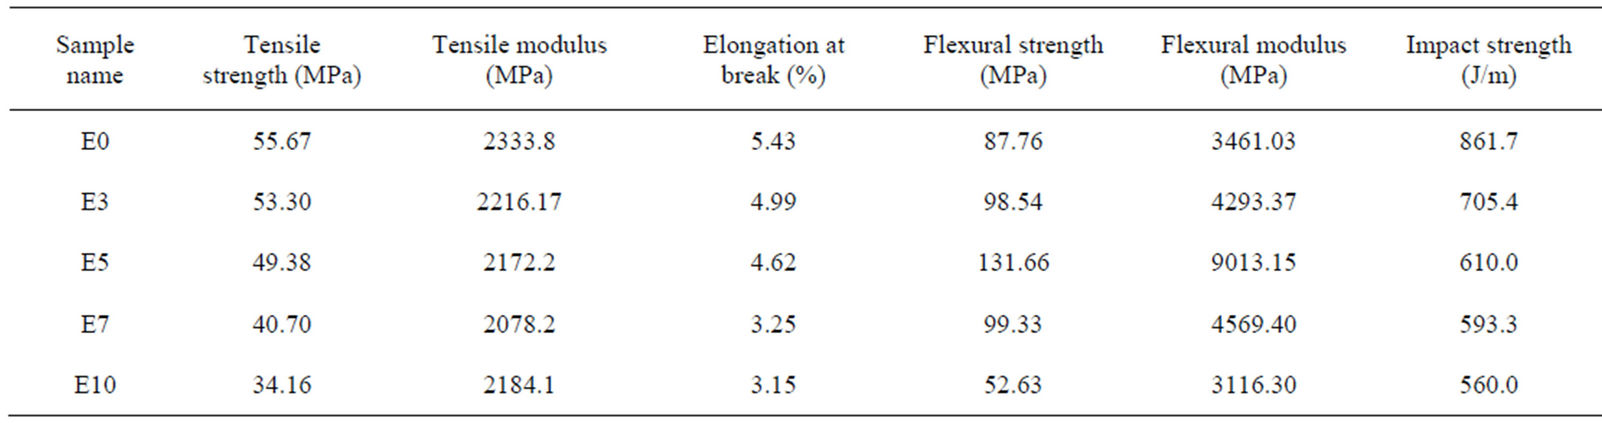
Table 3. Mechanical properties of epoxy/cenosphere composites.
the centre of the body, at a speed of about 0.8 mm/min, which is very slow. The spherical particles, were able to sustain the load. This load handling capacity increased with the increase in cenosphere concentration, but only upto 5 phr loading. Above which, aggregate formation (shown by SEM analysis) took place, again creating the points of stress concentrates, as the effective surface area for interacting with the epoxy polymer chains decreased. This led to decrease in flexural strength and flexural modulus above 5 phr loading.
Flexural strength and flexural modulus were found to have increased by 50.02 and more than 100% respectively for 5 phr loading of cenosphere in epoxy matrix.
4.2. Thermal Properties
Table 4 lists the onset degradation temperature and enthalpy of degradation (heat required to bring about 90% degradation of the composite) values whereas the TGA graphs for the composites are shown in Figures 2 and 3 respectively obtained for epoxy/cenosphere composites.
Being ceramic materials, cenospheres are thermally non-conducting. Addition of it to epoxy increased the onset degradation temperature and enthalpy of degradation as shown by TGA. Onset degradation temperature increased with increase in cenosphere concentration in the epoxy. Cenosphere are hollow microspheres. The void portion in cenospheres also appreciably reduced the thermal conductivity of the matrix.
In addition, the crystallinity induced by the uniform and individual distribution of cenosphere particles in epoxy matrix must have also helped in decreasing the thermal degradation of the composite. Increased crystallinity, increased the molecular packing of the composite, increasing the enthalpy and temperature of degradation.
It can be seen that the rate of increase of onset degradation temperature and enthalpy of degradation for E10 was the highest. E10 forms cenosphere aggregates leading to decrease in mechanical properties, but the same proved very helpful in reducing the thermal conductivity and thus decreasing the degradation parameters appreciably.
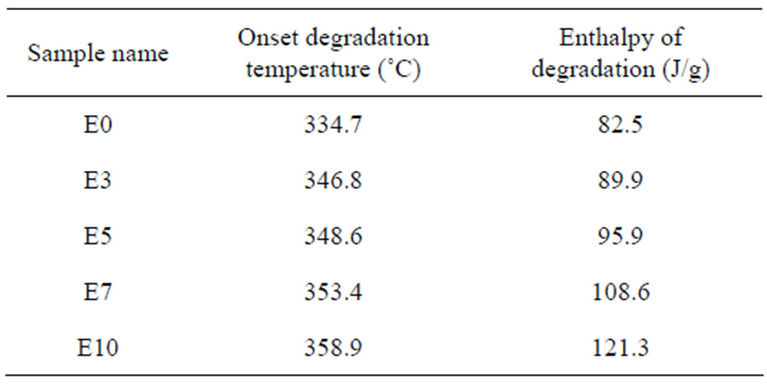
Table 4. Onset degradation temperature and enthalpy of degradation obtained for epoxy/cenosphere composites.
4.3. Electrical Properties
Table 5 lists the surface and volume resistivity values obtained for Epoxy/cenosphere composites. Surface and volume resistivity decreased with increase in cenosphere concentration in the epoxy matrix. It can be observed that the rate of decrease in surface resistivity is more appreciable than that of volume resistivity.
Cenospheres are electrical and thermal insulators. Also the crystallinity induced by the better interaction between cenosphere and epoxy, and eventual cross-linking by TETA locking up the cross-linked state, must have helped in increasing the insulating property of the composite. Also the hollow nature of cenosphere must had added to this increased insulation property.
4.4. XRD Analysis
Table 6 lists the % crystallinity values whereas Figure 4 shows the graph obtained from XRD for the epoxy/ cenosphere composites with varying concentration of cenosphere. Crystallinity increased with increase in cenosphere concentration in epoxy upto its 7 phr loading above which (i.e. at 10 phr) it decreased.
As discussed earlier, uniformly and individually distributed cenosphere particles increased the number of sites available for interaction between cenosphere and epoxy polymeric chains, thus, making them come closer together inducing crystallinity. Cross-linking of the epoxy with TETA locked the chains in the crystalline posi-

Figure 2. Onset degradation temperature values obtained for epoxy/cenosphere composites.
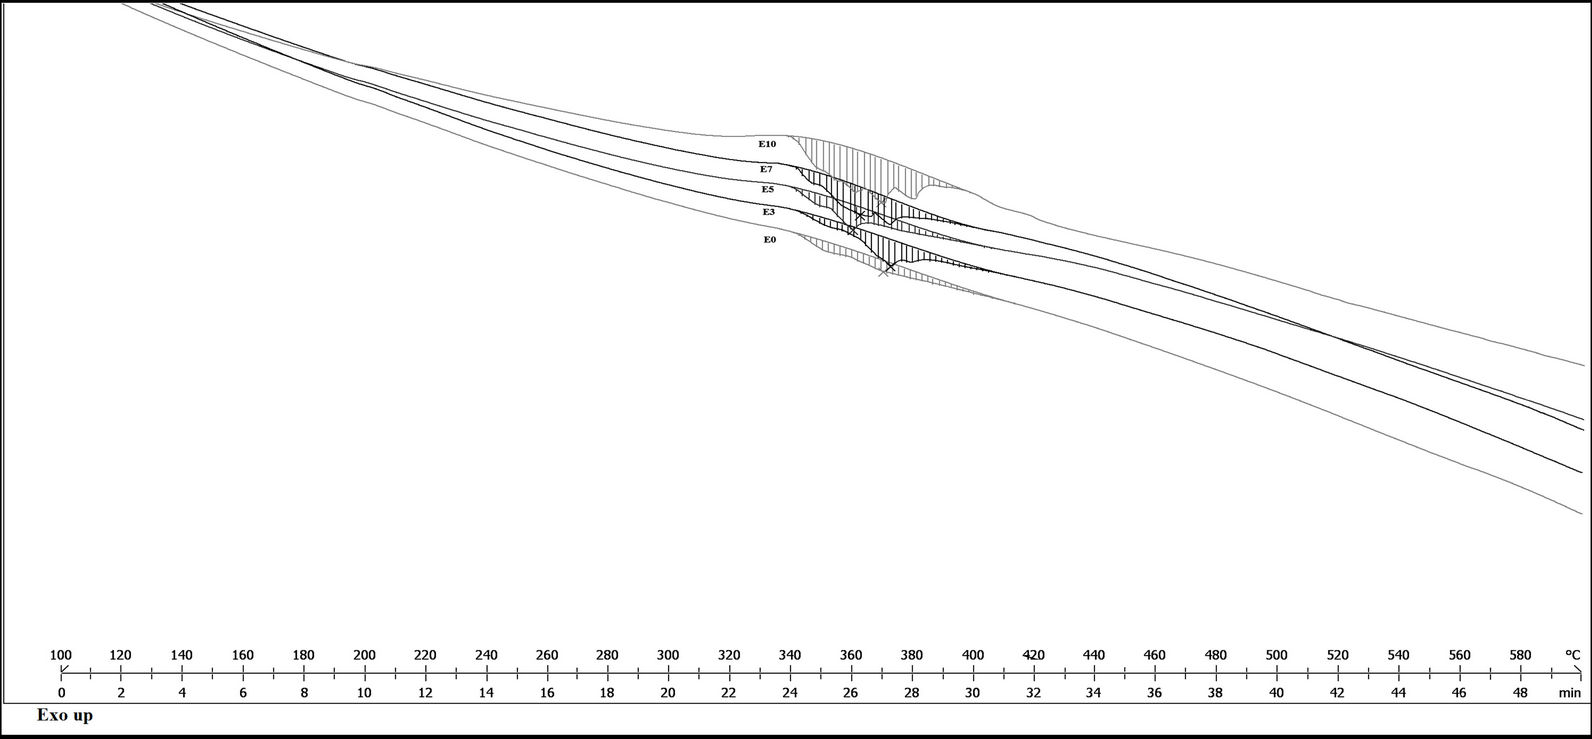
Figure 3. Enthalpy of degradation (heat required to bring about 90% degradation of the composite) obtained for epoxy/ cenosphere composites.
tions. This interactions increased upto 7 phr concentration of cenosphere in the epoxy matrix. At 10 phr loading due to the formation of aggregates (confirmed through SEM analysis) the expected number of interaction sites between epoxy and cenosphere decreased increasing amorphicity of the composite. This very well confirms the above-observed properties.
4.5. Colorimetric Properties
Table 7 reports the CIE L*, a*, b* values obtained for the epoxy/cenosphere composite systems. L*, a* and b* values decreased with increase in cenosphere in epoxy. Decrease was drastic even on small addition of cenosphere in epoxy.
Cenospheres are black coloured micro-spherical particles. Addition of it into epoxy matrix, induced this colour into the composite. Colouration became intense with increased addition of cenosphere in the epoxy matrix. This lead to decrease in L*, a* and b* values of the composite.
4.6. Morphological Properties
Figures 5 and 6 show the Scanning Electron Microscope (SEM) images obtained for 5 phr and 7 phr cenosphere loaded epoxy composites. Size of the particles ranged from 2 to 5 µm.
Particles were found to be uniformly distributed in 5 phr samples retaining their individuality; whereas, parti-
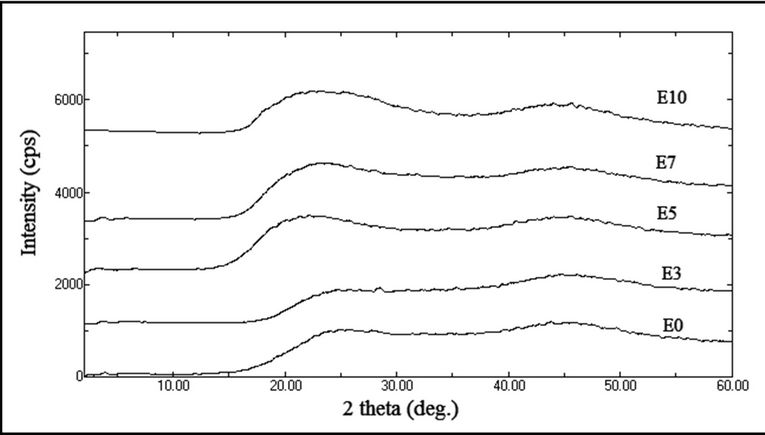
Figure 4. XRD graphs obtained for epoxy/cenosphere composites.

Figure 5. SEM image obtained for 5 phr cenosphere loaded epoxy.
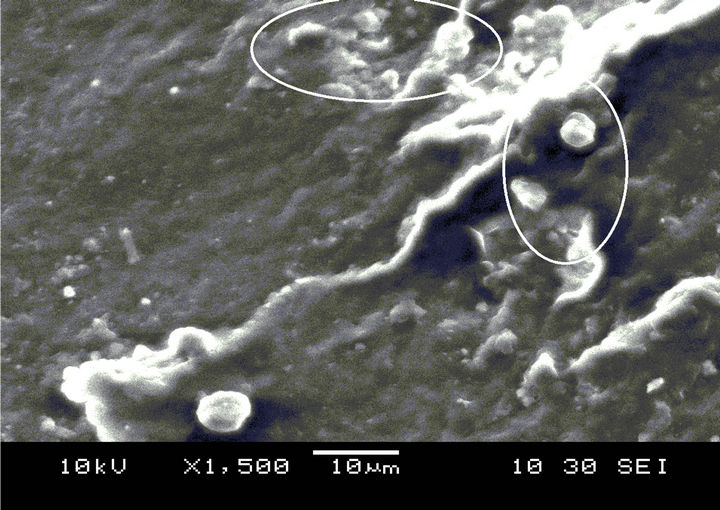
Figure 6. SEM image obtained for 7 phr cenosphere loaded epoxy.
cles in 7 phr samples were found to have formed aggregates decreasing the overall available surface area to interact with the epoxy matrix. This led to reduction in the crystallinity and thus the mechanical properties of the composite.
5. Conclusion
Cenosphers being hydrophilic materials had good compatibility with epoxy resin. Concentration of cenosphere
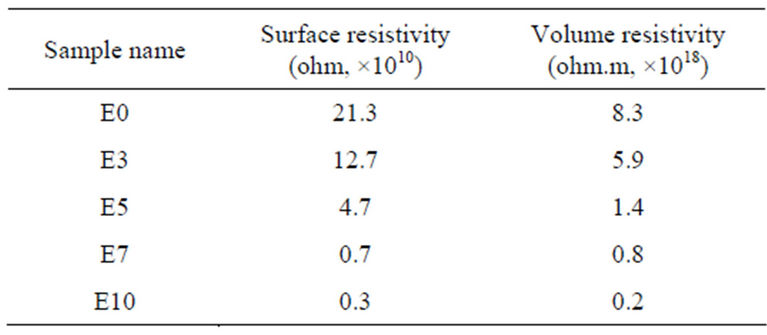
Table 5. Surface and volume resistivity values obtained for epoxy/cenosphere composites.
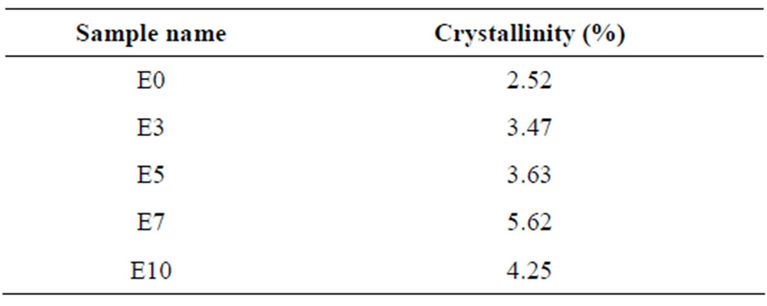
Table 6. Crystallinity values obtained for epoxy/cenosphere composites using XRD.
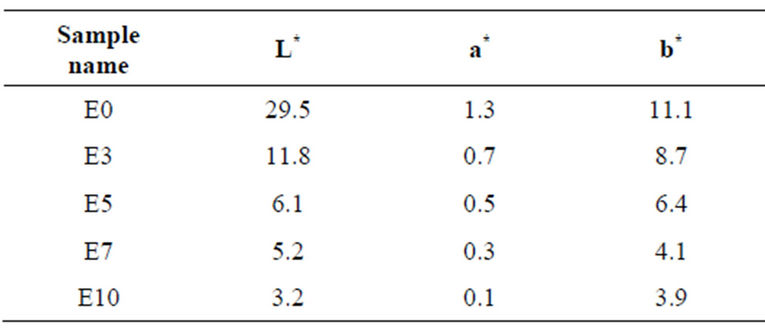
Table 7. CIE L*, a*, b* values obtained for epoxy/cenosphere composites.
was varied from 0 phr to 10 phr on the basis of epoxy resin. Prepared composites were tested for mechanical, electrical, thermal, electrical, crystallinity, colorimetric and morphological properties. Flexural strength, flexural modulus, surface resistivity, volume resistivity, onset degradation temperature and enthalpy of degradation increased, whereas, tensile strength, tensile modulus, percentage elongation at break and impact strength decreased with increase in cenosphere concentration in epoxy. Samples became more blackish with the addition of cenosphere in epoxy matrix. Thus, cenosphere is able to affect the base properties of the epoxy composite. It is thus more efficient as a reinforcing agent than filler for epoxy composites.
REFERENCES
- M. A. M. Abdullah, H. B. Ravikumar and C. Ranganathaiah, “Influence of Free Volume on the Mechanical Properties of Epoxy Based Composites: A Correlation Study,” Physica Status Solidi (c), Vol. 6, No. 11, 2009, pp. 2401- 2403. doi:10.1002/pssc.200982070
- J. Gu, G. Wu and X. Zhao, “Effect of Surface-Modification on the Dynamic Behaviors of Fly Ash Cenospheres Filled Epoxy Composites,” Polymer Composites, Vol. 30, No. 2, 2009, pp. 232-238. doi:10.1002/pc.20562
- M. V. Deepthi, M. Sharma, R. R. N. Sailaja, P. Anantha, P. Sampathkumaran and S. Seetharamu, “Mechanical and Thermal Characteristics of High Density PolyethyleneFly Ash Cenospheres Composites,” Materials & Design, Vol. 31, No. 4, 2010, pp. 2051-2060. doi:10.1016/j.matdes.2009.10.014
- R. J. Cardoso, A. Shukla and A. Bose, “Effect of Particle Size and Surface Treatment on Constitutive Properties of Polyester-Cenosphere Composites,” Journal of Materials Science, Vol. 37, No. 3, 2002, pp. 603-613. doi:10.1023/A:1013781927227
- P. Huo, Y. Yan, S. Li, H. Li and W. Huang, “Preparation and Characterization of Cobalt Sulfophthalocyanine/TiO2/ Fly-Ash Cenospheres Photocatalyst and Study on Degradation Activity under Visible Light,” Applied Surface Science, Vol. 255, No. 15, 2010, pp. 3380-3385. doi:10.1016/j.apsusc.2009.12.038
- V. B. Chalivendra, A. Shukla, A. Bose and V. Parameswaran, “Processing and Mechanical Characterization of Lightweight Polyurethane Composites,” Journal of Materials Science, Vol. 38, No. 8, 2003, pp. 1631-1643. doi:10.1023/A:1023203121299
- M. A. M. A. Abdullah, C. Ranganathaiah, B. Kothandaraman, J. M. Raj and M. N. Chandrashekara, “Characterization of ACS Modified Epoxy Resin Composites with Fly Ash and Cenospheres as Fillers: Mechanical and Microstructural Properties,” Polymer Composites, Vol. 32, No. 1, 2011, pp. 139-146. doi:10.1002/pc.21030
- B. Suresha, G. Chandramohan, Siddaramaiah and T. Jayaraju, “Influence of Cenosphere Filler Additions on the Three-Body Abrasive Wear Behavior of Glass Fiber-Reinforced Epoxy Composites,” Polymer Composites, Vol. 29, No. 3, 2008, pp. 307-312. doi:10.1002/pc.20380
- N. Gupta, E. Woldesenbet and P. Mensah, “Compression Properties of Syntactic Foams: Effect of Cenosphere Radius Ratio and Specimen Aspect Ratio,” Composites Part A: Applied Science and Manufacturing, Vol. 35, No. 1, 2004, pp. 103-111. doi:10.1016/j.compositesa.2003.08.001
- J. Gu, G. Wu and X. Zhao, “Effect of Surface-Modification on the Dynamic Behaviors of Fly Ash Cenospheres Filled Epoxy Composites,” Polymer Composites, Vol. 30, No. 2, 2009, pp. 232-238. doi:10.1002/pc.20562