Food and Nutrition Sciences
Vol.06 No.07(2015), Article ID:56083,9 pages
10.4236/fns.2015.67061
Chemical Composition, Phenolics, Anthocyanins Concentration and Antioxidant Activity of Ten Wild Edible Plants
Khalil I. Ereifej1*, Hao Feng1, Taha Rababah2, Ali Almajwal3, Muhammad Alu’datt2, Sana I. Gammoh2, Layal I. Oweis2
1Department of Food Science and Human Nutrition, University of Illinois, Urbana-Champaign, Urbana, USA
2Department of Food Science and Human Nutrition, Jordan University of Science and Technology, Irbid, Jordan
3Department of Community Health Sciences, College of Applied Medical Sciences, King Saud University, Riyadh, Saudi Arabia
Email: *ereifej@just.edu.jo, *kereifej@illinois.edu
Copyright © 2015 by authors and Scientific Research Publishing Inc.
This work is licensed under the Creative Commons Attribution International License (CC BY).
http://creativecommons.org/licenses/by/4.0/


Received 28 August 2014; accepted 30 April 2015; published 4 May 2015
ABSTRACT
Plants were collected and prepared for chemical analysis, total phenolics, anthocyanins concentrations, and free radical scavenging activity. Results showed that, protein concentration of Malva parviflora (22.9%) was the highest among the plants. Ruta chalepensis had high levels of fat and carbohydrates (4.2% and 51.7%, respectively), but had the lowest level of ash (8.7%). Mineral concentrations varied and found to have appreciable amounts of Ca, Na, K, Cu, Fe, Mg, Mn, Zn and P. Total phenolic ranged from 163.1 (Tetragonolobus palaestinus) to 1328.8 mg GAE/100g (Ruta chalepensis). Anthocyanins ranged between 18.1 (Gundelia tournefortii) and 100.1 mg/100g (Rumex acetosella). These plants differed in free radical scavenging activity. It was concluded that these plants could be considered as natural sources for antioxidants and valuable natural resources as a new addition to the diet of inhabitants.
Keywords:
Wild Edible Plants, Total Phenolics, Anthocyanins, Antioxidant Activity, DPPH

1. Introduction
Autoxidation of polyunsaturated lipids in foods involves a free radical chain reaction that is initiated by the exposure of lipids to light, heat, ionizing radiation, metal ions, or metalloprotein catalysts. The process of autoxidation involves initiation (production of lipid free radicals), propagation and termination (production of non- radical products) reactions [1] . Oxidative deterioration of lipids may cause the loss of fat soluble vitamins (A, D, E and K) and pigments (chlorophyll and carotenoids) [2] . It may also lead to the development of other changes that negatively affect nutritional quality, wholesomeness, safety, color, flavor, and texture of foodstuff [3] . The use of antioxidants in lipid-containing foods is one method used to minimize rancidity, retard the formation of toxic oxidation products, maintain nutritional quality and increase the shelf life of food products [4] . Synthetic antioxidants such as tert-butylhydroxytoluene, tert-butylhydroxyanisole and tert-butylhydroquinone (TBHQ) have been used to retard lipid oxidation in foods. However, such synthetic antioxidants are not preferred due to the interest in developing natural antioxidants from plants [5] . Phenolic antioxidants are natural antioxidants widely distributed in the plant kingdom [6] . For example, the phenolic compound p-cymene-2,3 diol (2,3-dihy- droxy-4-isopropyl-1-methyl-benzene) isolated from hexane extract of thyme, showed a strong antioxidant activity greater than those of α-tocophenol and butylatedhydroxyanisole [7] . Wild plants play an important role in the diet of inhabitants in different parts of the world. These plants tend to be drought-resistant, gathered both in times of abundance and times of need, used in every day cooking and may be an important source of nutrients [8] . The soft pods and seeds of Tetragonolobus palaestinus Boiss. (Jalaton is the local name) which is a wild dry legume species found in the highlands of Jordan, are consumed by Jordanian people before it reaches the dry stage [9] .
The objectives of this work was to evaluate the nutritional values of ten edible wild plants collected from Ajloun mountains in Jordan by determining their chemical compositions, levels of minerals, concentration of total phenolic compounds, anthocyanins, and their antioxidant activity. These wild edible plants were chosen because they could be cultivated to produce more vegetables and a natural source of bioactive compounds.
2. Materials and Methods
2.1. Plant Material
Plant samples (Table 1) were either purchased from local outlets or from people who collected them from various regions in Ajloun (North Jordan). All plants were obtained at the time of their most frequent consumptions, during the months of March and April at full growth and before drying stage. Plants were identified by professors of horticulture at Jordan University of Science and Technology (JUST). Scientific and local names were obtained from different references [9] [10] . Plants were collected twice with a 30-day interval. Edible plant samples were washed with tap water for complete removal of soil residues, followed by rinsing with deionized

Table 1. Ten wild edible plants from Jordan.
water. Washed plants were then air dried at room temperature, ground to an average diameter of 0.4 mm. Samples were packed in ziploc bags and preserved in a freezer at −18˚C in the Food Research Laboratory at the Faculty of Agriculture at JUST, until the time of analysis.
2.2. Gross Chemical Analysis
Moisture, protein, crude fiber, fat and ash were determined according to standard procedures [11] . Total carbohydrates were calculated by difference.
2.3. Mineral Analyses
Concentrations of Ca, Na, K, Cu, Fe, Mg, Mn and Zn were determined using atomic absorption spectrophotometer according to the method outlined in the AOAC (1984). Phosphorous was determined following the procedure reported previously [12] .
2.4. Phenolic and Anthocyanins Compounds Extraction
The extraction procedure for phenolic compounds was based on procedure reported by Perva-Uzunalic [13] . About 5 g (two replicates) of each plant (whole plant) were extracted with 50 ml of methanol. Extraction was carried out at 60˚C under stirring for 60 minutes at medium stirring speed. Each extract was filtered into a 50 ml volumetric flask using Whatman No. 3 filter paper. The volume was completed to mark, and allowed to set in the dark at room temperature until analysis.
2.5. Determination of Total Phenolics
Total phenolic contents in the extracts were determined according to the Folin-Ciocalteu procedure adapted from Singleton and Rossi [14] . Fifty micro liters of the plant extract (two replicates) were transferred into a test tube, and then mixed with 0.4 ml of 10% Folin-Ciocalteu reagent. After three minutes of reaction, 0.8 ml of a 10% sodium carbonate (Na2CO3) was added. The tubes were allowed to stand for 1 hour at ambient temperature, and the absorption was measured at 725 nm using spectrophotometer (CELL, model CE 1020, England) against a blank, which contained 50 μl of methanol in place of plant extract. Gallic acid was used as calibration standard, and results were calculated as gallic acid equivalent (GAE) (mg/100g dry weight basis).
2.6. Determination of Total Anthocyanin
Anthocyanins contents in the extracts were determined according to the procedure described by Rabino and Mancinelli [15] . After extraction of anthocyanin with acidified methanol, the absorbance of the extracts was measured using a spectrophotometer (CELL, model CE 1020, England) at 530 and 657 nm. The formula A = (A530 − 0.25 A657) was employed to compensate for the contribution of chlorophyll and its degraded products to the absorption at 530 nm. The anthocyanin content was expressed in milligrams of Cyanidin-3-glucoside equivalent per 100 g of dry sample weight. The anthocyanidin content was calculated according to Rabino and Mancinelli [15] :

were 29,600 = molar extinction coefficient. 449.2 = molecular weight of Cyanidin-3-glucoside. Dilution Factor = final volume/initial volume.
2.7. Radical DPPH Scavenging Activity
DPPH radical scavenging effect was determined according to the method of Mättaus [16] . The scavenging effect of DPPH was followed by monitoring the decrease in absorbance at 515 nm that occurs due to the reduction by the antioxidants or reaction with a radical species. Approximately, 2 g (two replicates) of each plant sample were extracted under stirring with 50 ml methanol for 60 minutes, at 60˚C. Different levels of methanol extracts (10, 25, 50, 100, and 200 µg/ml) of each plant were reacted with 0.2 ml of DPPH (50 mg of DPPH in 100 ml methanol). The mixture was brought to a total volume of 4.0 ml with the extracting solvent. The mixture was mixed thoroughly and allowed to stand in the dark for 30 minutes. Absorbance (A) then was read at 515 nm, against the blank. The radical scavenging activity was expressed as % of inhibition according to the following formula [17] .

where A = absorbance.
2.8. Statistical Analysis
Data are presented as means of two determinations and analyzed using the general linear model procedure with SAS Version 8.2 software package [18] . LSD analysis was used to compare the means. Significant differences were defined at P ≤ 0.05.
3. Results and Discussion
3.1. Gross Chemical Analysis
Data on levels of dry matter, protein, fat, fiber, ash and carbohydrates constituents of the wild edible plants are shown in Table 2. Due to limited information that have been found on the chemical composition of the investigated plants, in most cases our results were compared to the data reported in the literature, referred to other plants. Dry matter varied significantly among the ten plants ranging from 93.8% (Malva parviflora) to 97.3% (Centaurea iberica). Similarly the protein concentrations (Table 2) varied significantly among the plants ranging from 8.6 (Coriandrum sativum L.) to 22.9% (Malva parviflora). The protein concentration of Gundelia tournefortii (14.6%) was comparable with the value reported for the plant before flowering [19] . Other researchers reported lower value for this plant, when harvested at the beginning of flowering [20] . The differences could be due to the degree of maturity and environmental factors. The less in Gundelia tournefortii L. samples prior to maturity occurs because of the decrease in protein contents in the leaves and stems that are making up a larger portion of the plant in more mature stages [21] . Levels of fat contents varied significantly among plants as shown in Table 2. Ruta chalepensis (4.2%) had the highest value, while Centaurea iberica, Gundelia tournefortii and Rumex acetosella had values among the lowest (1.6%, 1.6% and 1.5%, respectively). Fat contents of Alfalfa (Medicago sativa) (2.6%) and Wheat straw (Triticum estivum) (2.3%) (Karabulut et al., 2006) were lower than those of Arum palaestinum (3.1%) and Ruta chalepensis (4.2%), but comparable to those of Coriandrum sativum (2.8%) and Malva parviflora (2.5%). Gundelia tournefortii (1.6%) contained lower fat level when
Table 2. Chemical composition of wild edible plants from Jordana.
aMeans are average of two replicates and expressed on dry weight basis. *Means with different letters in the same column are significantly different at P ≤ 0.05. DM = dry matter.
compared with values previously reported on the plant harvested in June and July (2.8% and 3.9%, respectively) [19] . Fiber contents varied significantly among plants ranging from 11.7% (Arum palaestinum) to 49.4% (Tetragonolobus palaestinus). The fiber contents of the investigated plants were higher than those of amaranth (Amaranthus gangeticus), chakotha (Chenopodium album), fenugreek (Trigonella foenum graecum), kilkeerai (Amaranthus tricolor) and shepu (Peucedanum graveolens) (8.4%, 4.8%, 10.7%, 5.9% and 5.6% fresh weight, respectively) [22] . Ash contents varied significantly among plants and ranged from 8.7% to 21.4% as shown in Table 2. The ash level obtained in our work for Gundelia tournefortii (18.7%) was higher than that reported previously [19] [20] . Carbohydrate values varied significantly in the investigated plants and ranged from 22.8% to 52.1%.
3.2. Minerals Analysis
Table 3 shows data on mineral concentrations for the investigated plants. Ca contents varied significantly among all plants. Ruta chalepensis had significantly the highest value (122.9 mg/g). The Ca contents of all plants found to be higher than those of commonly used edible plants such as basil (Ocimum basilicum L.), fennel (Foeniculum vulgare L.), parsley (Petroselinum crispum Mill.), sage (Salvia fruticosa L.) and thyme (Thymus vulgaris L.) which were reported to have 12.3, 10.3, 11.1, 11.1 and 12.4 mg/g Ca content, respectively [23] . Na contents varied significantly among the investigated plants and ranged between 4.6 (Arum palaestinum) and 29.6 mg/g (Tetragonolobus palaestinus) as shown in Table 3. K contents found to be high and varied significantly among plants. Ruta chalepensis and Tetragonolobus palaestinus had significantly the highest K contents (52.0 and 51.6 mg/g, respectively). Arum palaestinum (22.0 mg/g) and Malva parviflora (21.5 mg/g) contained more K than those of cumin (Cuminum cyminum L.) (17.1 mg/g), Lavender (Lavandula officinalis L.) (17.6 mg/g) and fennel (Foeniculum vulgare L.) (20.1 mg/g) [23] . Coriandrum sativum and Ruta chalepensis potassium contents found to be greater than those of dill (Anethum graveolens L.) and basil (Ocimum basilicum L.), which reported to have 35.7 and 24.8 mg/g, respectively [23] . Cu content was found to be high, ranging from 0.05 (Arum palaestinum) to 0.18 mg/g (Tetragonolobus palaestinus). All other plants showed intermediate values. No significant differences were observed in Fe content among the investigated plants as shown in Table 3. The Fe contents were found in large amounts in all the investigated plants, ranging from 1.4 (Coriandrum sativum) to 3.4 mg/g (Tetragonolobus palaestinus). Fe contents of all plants were found to be higher than those of amaranth (Amaranthus gangeticus), chakotha (Chenopodium album), kilkeerai (Amaranthus tricolor) and shepu (Peucedanum graveolens) [22] . The Mg contents were high and varied significantly among plants. The Mg contents of all plants (12.1 to 44.6 mg/g) were higher than the values reported for cumin (Cuminum cyminum L.)
Table 3. Minerals content of wild edible plants from Jordana.
aMeans are average of two replicates and expressed in mg/g (dry weight basis). *Means with different letters in the same column are significantly different at P ≤ 0.05.
(4.6 mg/g), sumac (Rhus coriaria L.) (2.3 mg/g) and thyme (Thymus vulgaris L.) (4.3 mg/g). The Mn contents of plant species varied significantly, ranging from 0.12 (Gundelia tournefortii) to 0.41 mg/g (Tetragonolobus palaestinus) [23] . Zn content was found to show high levels. Coriandrum sativum had significantly the highest value (0.9 mg/g) of Zn. P content showed significant variation among plants. Cichorium intybus and Rumex acetosella had the highest P contents (5.3 and 5.5 mg/g, respectively). Centaurea iberica, Gundelia tournefortii and Ruta chalepensis showed lower levels of P as compared with all other plants.
3.3. Total Phenolic Contents
Table 4 tabulates total phenolic contents extracted using methanol at 60˚C. The results depict that all plants contain appreciable amounts of phenolic compounds. The total phenolics ranged between 163.1 (Tetragonolobus palaestinus) and 1328.8 mg GAE/100g (Ruta chalepensis). These values were all lower than values reported for mint (Mentha spicata L.) (2562 mg catechin equivalent/100g) [24] , basil (Ocimum basilicum L.) (2630 mg GAE/100g) and turmeric (Curcuma langa L.) (2130 mg GAE/100g) [25] . As shown in Table 4, Arum palaestinum (1010.6 mg GAE/100g), Coriandrum sativum (936.0 mg GAE/100g) and Salvia hierosolymitana (911.1 mg GAE/100g) contained higher concentrations of phenolic compounds as compared to those extracted from cumin (Cuminum cyminum L.) (780.0 mg GAE/100g) and ginger (Zingiber officinale Rosc.) (780.0 mg GAE/100g) (Surveswaran et al., 2007). The extracted amounts of phenolic compounds from Cichorium intybus (598.6 mg GAE/100g) and Rumex acetosella (543.2 mg GAE/100g) found to be comparable to that in oregano (Origanum vulgare) (548.0 mg GAE/100g) [26] . Malva parviflora (204.4 mg GAE/100g) total phenolics found to be comparable to that of green pepper (206.0 mg GAE/100g) [27] . Centaurea iberica (379.8 mg GAE/100g) and Gundelia tournefortii (375.5 mg GAE/100g) have higher levels of phenolics than those reported for strawberry (363.7 mg GAE/100g), beetroots (257.0 mg GAE/100g) and nutmeg (Myristica frarans) (268.0 mg GAE/100g). Variations in total amount of phenolics among plants was expected, and could be attributed to the presence of wide range of phenolic compounds and their various derivatives in different plant species [28] .
3.4. Total Anthocyanins
The anthocyanins concentrations extracted using acidified methanol at 60˚C are listed in Table 4. (Gundelia tournefortii) recorded the highest anthocyanin concentration (100.1 mg/100g) while (Rumex acetosella) had the lowest (18.1 mg/100g). All other plants gave intermediate values. These values were higher than that reported for Pistacia lentiscus (5.4 mg/100g), but lower than the amounts reported for Phillyrea latifolia (949.0 mg/100g)
Table 4. Total phenolic contents, anthocyanin concentrations and DPPH IC50 values from ten wild Edible plants in Jordana.
aMeans are average of two replicates. *Means with different letters in the same column are significantly different at P ≤ 0.05.
and Rubia peregrine (723.8 mg/100g) [29] . The anthocyanins concentration of 100.1 mg/100g of Rumex acetosella was high, and comparable with 125.0 mg/100g of black carrots [30] . Results indicate significant variations in total anthocyanins among all plants. This variation is due to genetic and environmental factors [28] .
3.5. Radical DPPH Scavenging Activity
Table 4 also lists the DPPH radical scavenging activity of the investigated plants. Data show that all plant extracts were able to scavenge DPPH radical in a concentration-dependent fashion. A higher DPPH radical-sca- venging activity is associated with a lower IC50 (the efficient concentration of plant extract in mg/ml required to decrease initial DPPH concentration by 50%) value. As shown in Table 4, plants were found to differ significantly in their antioxidant activity. The lowest IC50 values of 0.28 and 0.29 mg/ml were detected in the extracts of Salvia hierosolymitana and Coriandrum sativum, respectively. The extract of Tetragonolobus palaestinus had significantly the greatest IC50 value of 4.59 mg/ml. These data are in agreement with that reported on Asteracantha longifolia Nees., Bauhinia racemosa Lam., Chenopodium album Linn., Moringa oleifera Lam., Nyctanthes arbortristis Linn., Paederia foetida Linn., and Trigonella foenum-graecum Linn. having IC50 values of 0.38, 0.22, 0.46, 0.36, 1.95, 0.44 and 0.85 mg/ml, respectively [31] . The correlation between the antiradical activity and total phenolics of the investigated plants was established (Figure 1). The antiradical activity is 1/IC50 and directly proportional to the antioxidant activity. A relatively good correlation (r = 0.72) was observed between the antiradical activity and total phenolic concentrations. For example, total phenolic concentration was less in Centaurea iberica, Gundelia tournefortii, Malva parviflora and Tetragonolobus palaestinus compared with Arum palaestinum, Cichorium intybus, Coriandrum sativum, Rumex acetosella, Ruta chalepensis and Salvia hierosolymitana, with the former showing lower DPPH radical-scavenging activity than the latter. These findings are in agreement with previous studies reported that phenolic compounds are major antioxidant constituents in selected herbs, vegetables and fruits, and there are direct relationships between their antioxidant activity and total phenolic. The correlation obtained in this study support the hypothesis that phenolic compounds contribute significantly to the total antioxidant capacity of plants. The DPPH scavenging activity could be predicted on the basis of the Folin-Ciocalteu assay for total phenolic content. High correlation coefficients between the phenolic content and antioxidant activities have been reported for various food commodities such as eggplant [32] , blueberry [33] and tomato [34] . Notably Ruta chalepensis showed significantly higher concentrations of total phenolics (1328.8 mg GAE/100g) compared with Coriandrum sativum (936 mg GAE/100g) and Salvia hierosolymitana (911.1 mg GAE/100g), but found to have weaker antioxidant activity. Arum palaestinum
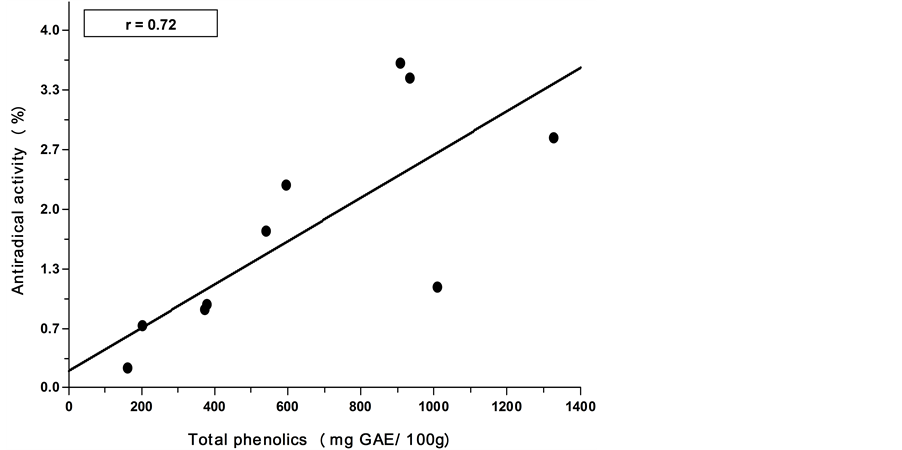
Figure 1. Relationship between antiradical activity (IC50 mg/ml) using DPPH assay and total phenolic content (mg GAE/100g DW) of methanolic extract from ten wild edible plants in Jordan.
contained higher amounts of total phenolics as compared with Cichorium intybus, Coriandrum sativum, Rumex acetosella and Salvia hierosolymitana, but found to be less potent as antioxidant (Table 4).
This indicates that, the kind of phenolic compound present may also affect the antioxidative activity of plants. Low antioxidant activity is probably because not all the phenolic compounds possess synthetic radical DPPH quenching activities [35] . It was reported that the structure of the phenolic compounds is a key determinant of their radical scavenging activity [36] .
4. Conclusion
Results of this research showed that ten plants contained appreciable amounts of fat, fibers and carbohydrates. They can be considered as a good vegan source of proteins. The investigated plants found to have high nutritional values because of their appreciable amounts of Ca, Na, K, Cu, Fe, Mg, Mn, Zn and P. This study confirmed that the investigated plants contained significant amounts of phenolic compounds and anthocyanins. These plants can serve as a source of natural antioxidants. Among the ten plants studied, Salvia hierosolymitana had the highest antioxidant activity. More work should be done to evaluate total phenolic compounds and anthocyanin concentrations for a greater number of plants grown in the wilderness of Jordan. All of these data provide the base for further applications with regard to phenolic antioxidants, which is needed both in food preservation and in preventing human disease.
Acknowledgements
The authors would like to acknowledge the financial support of the Scientific Research Deanship at Jordan University of Science and Technology. Grant # 100-2005. Also the authors would like to extend their sincere appreciation to the Deanship of Scientific Research at King Saud University for funding of this research through the Research Group Project no RGP-VPP 193.
References
- Shahidi, F. and Naczk, M. (2004) Phenolics in Food and Nutrraceuticals. CRC Press LLC, New York.
- Gordon, M. (2001) The Development of Oxidative Rancidity in Foods. In: Pokorny, J., Yanishlieva, N. and Gordon, M., Eds., Antioxidants in Food, CRC Press LLC, Boston, 17 p. http://dx.doi.org/10.1533/9781855736160.1.5
- Bandoniene, D., Venskutonis, P., Gruzdiene, D. and Murkovic, M. (2002) Antioxidative Activity of Sage (Salvia officinalis L.), Savory (Satureja hortensis L.) and Borage (Borago officinalis L.) Extracts in Rapeseed Oil. European Journal of Lipid Science and Technology, 104, 286-292. http://dx.doi.org/10.1002/1438-9312(200205)104:5<286::AID-EJLT286>3.0.CO;2-O
- Maisuthisakul, P., Suttajit, M. and Pongsawatmanit, R. (2007) Assessment of Phenolic Content and Free Radical-Sca- venging Capacity of Some Thai Indigenous Plants. Food Chemistry, 100, 1409-1418. http://dx.doi.org/10.1016/j.foodchem.2005.11.032
- Rababah, T., Hettiarachchy, N. and Horax, R. (2004) Total Phenolics and Antioxidant Activities of Fenugreek, Green Tea, Black Tea, Grape Seed, Ginger, Rosemary, Gotu Kola, and Ginkgo Extracts, Vitamin E, and Tert-Butelhydro- quinone. Journal of Agricultural and Food Chemistry, 52, 5183-5186. http://dx.doi.org/10.1021/jf049645z
- Wettasinghe, M. and Shahidi, F. (1999) Antioxidant and Free Radical-Scavenging Properties of Ethanolic Extracts of Defatted Borage (Borago officinalis L.) Seeds. Food Chemistry, 67, 399-414. http://dx.doi.org/10.1016/S0308-8146(99)00137-5
- Lee, S., Umano, K., Shibamoto, T. and Lee, K. (2005) Identification of Volatile Components in Basil (Ocimum basilicum L.) and Thyme Leaves (Thymus vulgaris L.) and Their Antioxidant Properties. Food Chemistry, 91, 131-137. http://dx.doi.org/10.1016/j.foodchem.2004.05.056
- Turan, M., Kordali, S., Zengin, H., Dursun, A. and Sezen, Y. (2003) Macro and Micro Mineral Content of Some Wild Edible Leaves Consumed in Eastern Anatolia. Acta Agriculturae Scandinavica, 53, 129-137. http://dx.doi.org/10.1080/090647103100095
- Ereifej, K. (2004) Seed Characteristics of Wild Legume (Tetragonolobus palaestinus) as Compared with Lens culinaris and Pisum sativum. International Journal of Food Properties, 7, 639-646. http://dx.doi.org/10.1081/JFP-200033068
- Al-Eisawi, D.M. (1998) Field Guide to Wild Flowers of Jordan and Neighboring Countries. The National Library. Amman, Jordan.
- AOAC (1984) Official Methods of Analysis. 14th Edition, Association of Official Analytical Chemists, Washington DC.
- Fiske, C.H. and Subbarow, Y. (1925) The Colorimetric Determination of Phosphorus. The Journal of Biological Chemistry, 66, 375-400.
- Perva-Uzunalić, A., Škerget, M., Knez, Z., Weinreich, B., Otto, F. and Grüner, S. (2007) Extraction of Active Ingredients from Green Tea (Camellia sinensis): Extraction Efficiency of Major Catechins and Caffeine. Food Chemistry, 96, 597-605. http://dx.doi.org/10.1016/j.foodchem.2005.03.015
- Singleton, V.L. and Rossi, J.A. (1965) Colorimetry of Total Phenolics with Phosphomolybdic-Phosphotungstic Acid Reagents. American Journal Ecology Viticulture, 16, 144-158.
- Rabino, I. and Mancinelli, A. (1986) Light, Temperature, and Anthocyanin Production. Plant Physiology, 81, 922-924. http://dx.doi.org/10.1104/pp.81.3.922
- Mättaus, B. (2002) Antioxidant Activity of Extracts Obtained from Residues of Different Oilseeds. Journal of Agriculture and Food Chemistry, 50, 3444-3452. http://dx.doi.org/10.1021/jf011440s
- Brand-Williams, W., Cuvelier, M. and Berset, C. (1996) Use of Free Radical Method to Evaluate Antioxidant Activity. Lebensmittel-Wissenschaft und Technologie, 28, 25-30. http://dx.doi.org/10.1016/S0023-6438(95)80008-5
- SAS (2002) User’s Guide. Release 8.2 Edition, SAS Institute Inc., Cary.
- Kamalak, A., Canbolat, O., Gurbuz, Y., Erol, A. and Ozay, O. (2005) Effect of Maturity Stage on Chemical Composition, in Vitro and in Situ Dry Matter Degradation of Tumbleweed Hay (Gundelia tournefortii L.). Small Ruminant Research, 58, 149-156. http://dx.doi.org/10.1016/j.smallrumres.2004.09.011
- Karabulut, A., Ozkan, C., Kamalak, A. and Canbolat, O. (2006) Comparison of the Nutritive Value of a Native Turkish Forages, Tumbleweed Hay (Gundelia tournefortii L.), Wheat Straw and Alfalfa Hay Using in Situ and in Vitro Measurements with Sheep. Archivos Latinoamericanos de Producci? Animal, 14, 78-83.
- Buxton, D.R. (1996) Quality Related Characteristics of Forages as Influenced by Plant Environment and Agronomics Factors. Animal Feed Science and Technology, 59, 37-49. http://dx.doi.org/10.1016/0377-8401(95)00885-3
- Kumari, M., Gupta, S., Lakshmi, A. and Prakash, J. (2004) Iron Bioavailability in Green Leafy Vegetables Cooked in Different Utensils. Food Chemistry, 86, 217-222. http://dx.doi.org/10.1016/j.foodchem.2003.08.017
- Özcan, M. (2004) Mineral Contents of Some Plants Used as Condiments in Turkey. Food Chemistry, 84, 437-440. http://dx.doi.org/10.1016/S0308-8146(03)00263-2
- Kanatt, S., Chander, R. and Sharma, A. (2007) Antioxidant Potential of Mint (Mentha spicata L.) in Radiation- Processed Lamb Meat. Food Chemistry, 100, 451-458. http://dx.doi.org/10.1016/j.foodchem.2005.09.066
- Surveswaran, S., Cai, Y., Corke, H. and Sun, M. (2007) Systematic Evaluation of Natural Phenolic Antioxidants from 133 Indian Medicinal Plants. Food Chemistry, 102, 938-953. http://dx.doi.org/10.1016/j.foodchem.2006.06.033
- Su, L., Yin, J., Charles, D., Zhou, K., Moore, J. and Yu, L. (2007) Total Phenolic Contents, Chelating Capacities, and Radical-Scavenging Properties of Black Peppercorn, Nutmeg, Rosehip, Cinnamon and Oregano Leaf. Food Chemistry, 100, 990-997. http://dx.doi.org/10.1016/j.foodchem.2005.10.058
- Lin, J. and Tang, C. (2007) Determination of Total Phenolic and Flavonoid Contents in Selected Fruits and Vegetables, as Well as Their Stimulatory Effects on Mouse Splenocyte Proliferation. Food Chemistry, 101, 140-147. http://dx.doi.org/10.1016/j.foodchem.2006.01.014
- Rababah, T., Ereifej, K. and Howard, L. (2005) Effect of Ascorbic Acid and Dehydration on Concentrations of Total Phenolics, Antioxidant Capacity, Anthocyanins, and Color in Fruits. Journal of Agricultural and Food Chemistry, 53, 4444-4447. http://dx.doi.org/10.1021/jf0502810
- Longo, L., Scardino, A. and Vasapollo, G. (2007) Identification and Quantification of Anthocyanins in the Berries of Pistacia lentiscus L., Phillyrea latifolia L. and Rubia peregrina L. Innovative Food Science and Emerging Technologies, 8, 360-364. http://dx.doi.org/10.1016/j.ifset.2007.03.010
- Ersus, S. and Yurdagel, U. (2007) Microencapsulation of Anthocyanin Pigments of Black Carrot (Daucus carota L.) by Spray Drier. Journal of Food Engineering, 80, 805-812. http://dx.doi.org/10.1016/j.jfoodeng.2006.07.009
- Dasgupta, N. and De, B. (2007) Antioxidant Activity of Some Leafy Vegetables of India: A Comparative Study. Food Chemistry, 101, 471-474. http://dx.doi.org/10.1016/j.foodchem.2006.02.003
- Noda, Y., Kaneyuki, T., Igarashi, K., Mori, A. and Packer, L. (2000) Antioxidant Activity of Nasunin, an Anthocyanin in Eggplant Peels. Toxicology, 148, 119-123. http://dx.doi.org/10.1016/S0300-483X(00)00202-X
- Connor, A.M., Luby, J.J., Tong, C.B.S., Finn, C.E. and Hancock, J.F. (2002) Genotypic and Environmental Variation in Antioxidant Activity, Total Phenolics Content, and Anthocyanin Content among Blueberry Cultivars. Journal of the American Society for Horticultural Science, 127, 89-97.
- Hanson, P.M., Yang, R.Y., Wu, J., Chen, J.T., Ledesma, D., Tsou, S.C.S. and Lee, T.C. (2004) Variation for Antioxidant Activity and Antioxidants in Tomato. Journal of the American Society for Horticultural Science, 129, 704-711.
- Ivanova, D., Gerova, D., Chervenkov, T. and Yankova, T. (2005) Polyphenols and Antioxidant Capacity of Bulgarian Medicinal Plants. Journal of Ethnopharmacology, 96, 145-150. http://dx.doi.org/10.1016/j.jep.2004.08.033
- Balasundram, N., Sundram, K. and Samman, S. (2006) Phenolic Compounds in Plants and Agri-Industrial By-Products: Antioxidant Activity, Occurrence, and Potential Uses. Food Chemistry, 99, 191-203. http://dx.doi.org/10.1016/j.foodchem.2005.07.042
NOTES

*Corresponding author.