Food and Nutrition Sciences
Vol.5 No.8(2014), Article ID:44208,12 pages DOI:10.4236/fns.2014.58078
Microencapsulation of Banana Passion Fruit (Passiflora tripartita Var. Mollissima): A New Alternative as a Natural Additive as Antioxidant
Maritza Gil1*, Ana Restrepo1, Leonidas Millán1, Luz Alzate1, Benjamín Rojano2
1Engineering Faculty, Lasalian University Corporation, Caldas, Colombia 2Chemestry Ecole, National University of Colombia, Medellin, Colombia
Email: *magil@lasallista.edu.co
Copyright © 2014 by authors and Scientific Research Publishing Inc.
This work is licensed under the Creative Commons Attribution International License (CC BY).
http://creativecommons.org/licenses/by/4.0/


Received 20 October 2013; revised 20 November 2013; accepted 27 November 2013
ABSTRACT
Banana passion fruit (P. tripartita var. Mollissima) is one of the most promising tropical fruits giving its antioxidant activity (AOA) to replace synthetic additives. Despite this property, there are no studies about the metabolites responsible for its biological function or proposals for the application of technologies, such as microencapsulation by spray drying, to improve its properties and ease its incorporation in several food matrices. The aim of this study is to microencapsulate the pulp of banana passion fruit with several mixtures of encapsulants and identify which one of these mixtures is better to preserve its AOA. The antioxidant activity values for the banana passion fruit pulp were as follows: DPPH: 6630.2 ± 91 μMtrolox/100g; ABTS: 18764.3 ± 270.4 μMtrolox/100g; FRAP: 1703.6± 938.2 mgAA/100g, ORAC: 8105.4 ± 424.2 µmol TEAC/100g of sample; Total phenols: 8862.2 ± 451.4 gallic ac. mg/100g. The concentrations of the bioactive compounds expressed in mg of gallic acid per 100 g of the pulp on a dry base were 13.9 ± 0.004; 5.9 ± 0.001 and 126.3 ± 0.004 for caffeic, p-coumaric and ferulic acids, respectively. The best shelf-life followed by ABTS in eight assays was between 28.8 and 31.5 weeks using maltodextrin and modified starch, MD:MS (1/4:3/4) and MD:MS (0:1), respectively. In conclusion, ABTS is the best method to measure the AOA in banana passion fruit because it correlated with the phenolic compounds better than DPPH and FRAP methods. Additionally, two options were found to protect the AOA and to extent the shelf-life of the passion fruit by spray-drying, with mixtures of encapsulants widely used in the food industry.
Keywords:Passiflora tripartite; ABTS; Maltodextrin; Microencapsulation; Phenolic Compound

1. Introduction
The biodiversity that exists in America represents one of the best sources to fulfill the current necessity of obtaining novel therapeutic or nutritional ingredients. Exotic fruits have become a major research focus due to their high content of bioactive compounds, which are presumed to have important benefits related to their actions on oxidation processes, thus helping to treat cardiovascular diseases, cancer and coronary diseases such as atherosclerosis [1] [2] .
Among tropical fruits, it is important to highlight the American Passifloraceae, which is considered very important because they include a wide variety of species from the North of the Andes. Colombia has 136 species of Passiflora, making this the country with the highest diversity of such species [3] . Among them, the Castilla banana passion fruit, which belongs to the P. tripartita sub-gender Mollissima variety, has been recognized because of its high content of phenolic compounds [4] [5] ; therefore, it is one of the best natural sources of antioxidants and a potential alternative the synthetic antioxidants commonly used by food and pharmaceutical industries as sulfites, which can cause collateral damage [6] .
In 2007, Botero and others discovered that the reduction effect of P. tripartite Mollissima var. can be compared to that of ascorbic acid, the most commonly used natural antioxidant in food industries [7] . In 2008, Vasco, Ruales and Kamal-Eldin reported the antioxidant capacity of banana passion fruit with the method of the free radical (1,1-diphenyl-2-picrilhidrazyl) scavenging capacity (DPPH) and the ferric reducing ability of plasma capacity (FRAP), which showed positive results above those found in other fruits and cereals from Ecuador [4] . Finally, the group of Contreras-Calderón (2011) performed a study investigating the antioxidant profile of the pulp of the banana passion fruit cultivated in Colombia. This study correlated the phenolic content to the results obtained with the FRAP and the absorbance of the radical cation of 2,2’-azinobis(3-ethylbenzothiazoline-6-sulfonate) (ABTS), which provides a better idea of the possible behavior of this natural antioxidant source in different products and can be used as an additive in several matrices [5] .
The proposal of extracts from fruits as new therapeutics or as additives requires the application of technologies that guarantee the stability of the main compounds responsible for bioactive functions. Extracts of banana passion fruit or other exotic fruits that exhibit a high antioxidant capacity due to their phenols and ascorbic acid contents [4] can be sensitive to external factors such as high temperatures, humidity, pH changes and exposure to light and oxygen among others. These external factors can affect the quality and functional properties of fruit extracts during production or when they are added to foods with complex compositions [8] .
Microencapsulation by spray-drying is one of the most important and growing technologies of the last decade in the food industry, and it addresses the need to guarantee the stability of antioxidant compounds. This procedure also assures the bioavailability of the functional ingredients at a metabolic level [9] . Spray-drying can be scaled up to an industrial level at lower costs in comparison to other drying methods that are usually used, such as freeze drying [10] .
In the search for stable natural antioxidants that can be applied to food matrices, the microencapsulation of the bioactive compounds in the pulp of banana passion fruit is a feasible and practical option for the global and highly competitive additives’ industry. Therefore, the objective of this research work was to microencapsulate the pulp of banana passion fruit (Passiflora tripartita Mollissima var.) with several mixtures of encapsulants and identify which one of these mixtures is better to preserve its AOA as an alternative for a natural additive.
2. Materials and Methods
2.1. Materials
The banana passion fruit (Passiflora tripartita var. Mollissima) was purchased in a local market in Antioquia, Colombia. Maltodextrin (MD) with dextrose equivalent, ED 10 and modified starch (MS) HiCap 100 were provided by Duas Rodas Company, Sabaneta-Antioquia. The chemical reagents used were DPPH free radical (1,1-diphenyl-2-picrilhidrazyl), MeOH, acetic acid, iron trichloride, gallic acid, 2,4,6-tri (2-pyridyl) and triazine (TPTZ) were purchased from the Aldrich Chem. Co, (Milwaukee, WI); the chemical 2,2-azinobis-(3-ethylbenzthiazoline-6-sulfonic acid) (ABTS), (2,2’-azobis (2-amindinopropane) dihydrochloride acid (AAPH) and fluorescein were obtained from the Sigma Chemical Co. (St. Louis, MO). Folin’s reagent, hydrochloric acid, sodium acid phosphate and sodium carbonate were purchase from Merck (Germany).
2.2. Preparation of the Banana Passion Fruit Pulp
9 kg of pulp was thermally treated at 90˚C for five minutes to sanitize. The seeds were separated from the pulp in a 94 model Metallic Villacol industrial pulper, until 5.5 kg was obtained. The pulp was then packed in polypropylene bags and frozen at −20˚C.
2.3. Preparation of the Microcapsules
Approximately 30% solution of the different blends of MD and MS were dispersed in distilled water and the final volume was made up to 100 ml for each mixture Table 1. It was rehydrated for 12 h, at refrigerated temperature (10˚C - 12˚C). About 10g of the banana passion fruit pulp was added to the mixture in a rate of 1:3, pulp:encapsulant, respectively. Each preparation was homogenized with an IKA T50 Ultra-Turrax at 400 rpm for five minutes. The solutions were fed into Mini Buchi B-290 spray drying equipment. The injection temperature was 180˚C ± 5˚C, the air flow, feeding speed and atomization pressure were 600 L/h, 12 mL/min and 137895.2 Pa, respectively, for all encapsulant mixtures.
2.4. Physical-Chemical and Microbiological Characterization of the Banana Passion Fruit Pulp
The testing for acidity, pH, humidity content, soluble solids (Brix), density, viscosity, color parameters and microbiological evaluation for fecal coliforms, Clostridium, S. aureus, Salmonella, mesophilic, fungi and yeasts were performed according to the AOAC’s official methods [11] .
2.5. Treatment of Samples for the TPC and AOA Analysis
Approximately 0.5 g of the microcapsules or 5 g of the pulp were weighed, for each of the analyses. Then, 25 mL of ethanol was added and homogenized by an Ultra-turrax (IKA-Werk, Germany) for 30 seconds, followed by vacuum filtering. The extracted solutions were stored at −20˚C until analysis.
2.6. Total Phenolic Content, TPC
The concentration of total phenols in the extracts was determined using the Folin-Ciocalteu reagent and external calibration with gallic acid (Singleton & Rossi, 1965). Briefly, 50 µL of extract solution, 425 µL distilled water and 125 µL of Folin-Ciocalteu reagent was added and mixed thoroughly. After 6 minutes, 400 µL of 7% NaCO2 was added and then the mixture was allowed to stand for 1 hour at room temperature. The absorbance was measured at 760 nm using a Thermo Scientific, Multiskan Spectrum spectrophotometer. The TPC was determined as mg of gallic acid equivalent (GAE) using an equation obtained from the external galic acid calibration curve. The estimation of phenolic compounds in the fractions was carried out in triplicate and the results were averaged.
2.7. Evaluation of the AOA with the DPPH Method
A method improved by Rojano et al. (2008) was used. This procedure was performed using 10 μL of the extrct and 90 μL of the methanolic DPPH• solution (20 mg/L). After 30 minutes of reaction at room temperature in the dark, the absorbance was read at 517 nm. For each studied sample, the percentage inhibition of the radical was calculated and the results were expressed as TEAC values (Trolox Equivalent Antioxidant Capacity) by the construction of a standard curve, using several concentrations of the TROLOX® antioxidant [12] .
2.8. Evaluation of the AOA by the Use of the Radical Cation Method ABTS●+
Determination of the antioxidant capacity using the ABTS method was performed according to the spectropho

Table 1. Mix design according to the encapsulants proportion.
aMaltodextrin (MD) with dextrose equivalent, ED 10; bModified starch (MS) HiCap 100.
tometric method described by Re et al. (1999). The free radical ABTS●+ was generated by the oxidation reaction of the ABTS (3.5 mM) (2.2’-azino-bis-(3-ethylbenzothiazoline-6-sulfonate ammonium) with potassium persulfate (1.25 mM). After 24 hours, the absorbance was adjusted with PBS pH 7.4 up to 0.70 units, at 732 nm. For the evaluation, 10 μL of the extract and 990 μL of the ABTS●+ radical solution were used.
After 30 min of reaction at room temperature and in the dark, the change in the absorbance was read. The standard reference was obtained by the mixture of 10 μL of the solvent used to prepare the sample and 990 μL of the solution of the ABTS●+ radical. The results were expressed as TEAC values by means of the construction of a standard curve using different concentrations of TROLOX®.
2.9. Evaluation of the Reduction Capacity FRAP
Benzi and Strain´s method was used for evaluating the reducing capacity. The reagent was prepared by dissolving TPTZ (10 μM in HCl 40 μM) and FeCl3 (0.3 μM) in buffer acetic acid-sodium acetate (pH 3.4). The mixture of the reaction consisted of 900 μL of this solution, 50 μL of a solution of the extract in MeOH and 50 μL of distilled water. After 7 minutes of reaction, the absorbance at 593 nm was read. The FRAP values were expressed, taking into account a standard curve of ascorbic acid. The activity of each sample was expressed as a FRAP value (mg of ascorbic acid per 100 g of antioxidant) [13] .
2.10. Evaluation of the AOA by ORAC (Oxygen Radical Absorbance Capacity)
The experimental procedure was based on previous reports of Ou and others, in which TROLOX was used as a standard, under controlled conditions of temperature at 37˚C and pH 7.4. The excitation intensity (I) was read at 493 nm and the slit of excitation was 5; the emission intensity (I) at 515 nm and the slit of emission was 13, with an attenuator of 1% and with no attenuator plate. To develop the technique, solutions of 1 × 10⁻² M fluorescein in PBS (75 mM) and 0.6 M AAPH in PBS (75 mM) were used. The sample contained 21 mL of fluorescein, 2.899 mL of the extract tested and 50 mL of AAPH. The protective effect of the antioxidant was calculated by the differences in areas under the decay curve of fluorescein between the blank and the sample. It was then compared to the curve of Trolox and was expressed in micromoles of Trolox per gram of sample (mmol Tx/g sample), according to equation (1):
 (1)
(1)
in which AUC is the area under the curve of the sample, AUC˚ is the area under the curve for the control, AUCTrolox denotes the area under the curve for the Trolox, and f is the dilution factor of the extracts [14] .
2.11. Quantification of Bioactive Compounds
The bioactive compounds were quantified by HPLC with a UFLC model Shimatzu (LC-20AD) chromatograph, equipped with an auto-injector SIL-20A/HT, a communication module CBM-20A and a diode array detector (PDA) SPD-M20A; the reading was made at 280 nm. To separate the bioactive compounds, a Restek® Ultra aqueous C18 column (4.6 × 250 mm ID, 5 μm) was used. The mobile phase was acidified methanol (A) with 0.1% formic acid (B), with a gradient elution of 0.01 min 60% A, 5 - 12 min 80% A, and 13 - 14 min 60% A. The flow rate of the mobile phase was 1.0 mL/min. Quantification of various phenolic acids was performed using standard curves [15] .
2.12. Stability Test for the Microencapsulated Banana Passion Fruit
The microcapsules obtained were stored at 25˚C, in the dark, for 6 weeks. The stability was monitored by correlating the total phenolic content with the antioxidant capacity determined by the methods of DPPH, ABTS and the FRAP. The determination was performed by triplicate.
The half-life of the microcapsules was calculated with the expression 0.693/k, in which (k) is the velocity constant, according to Cai and Corke (2000). The value of this constant was determined from the slope of the semi-log graph of the percentage of the antioxidant capacity retention evaluated through the method that best correlated the total phenols content vs. the time of storage [16] .
The retention percentage of the antioxidant capacity was calculated with the equation:
 (2)
(2)
2.13. Scanning Electron Microscopy (SEM)
The external structure of the microcapsules obtained was analyzed by means of the scanning electron microscopy (SEM). The samples were previously covered with gold by the use of a Varian Vacuum Evaporator PS 10E (USA) vacuuming equipment and, then, analyzed in a JSM-5950 LV (USA) scanning electron microscope operated at 15 KW with a vacuum of 25 Pa. The images were obtained with a Kodak 120 T-Max ISO 100 film camera coupled to the microscope [17] .
2.14. Statistical Design
Correlations between the AOA method and TPC in the pulp of microencapsulated banana passion fruit were tested. The main components were used for multivariate analysis, in order to determine the antioxidant capacity analysis that best correlates with total phenolic content. The first two main components are sufficient to describe 78.68% of the variability in this study.
Determination of optimal encapsulants mixture. The statistical analysis was performed with a mixture design constituted by eight experiments. The independent variables were the drying temperature and the ratio of the pulp with encapsulant materials, (1:1.23), for both encapsulates (MD and MS). The experimental variable studied was the composition of MD and MS in the encapsulants mixtures (0:1; 1:0; 1/2:1/2; 1:4:3/4; 3/4:1/4, respectively).
The quantity of both components was established in 1 or 100% (X1 + X2 = 1 or 100%, Σx = 1 or 100%). The mixture design took individual and by-pair effects, with two components (X1, X2), in which the optimal mixture was determined according to the response variables considered. The quadratic array of the mixture design was expressed using the following equation [18] [19] :
 (3)
(3)
The response variable regarded in the mixture design was the optimization of the “desirability” function, aiming to find the combination of encapsulants that retarded the loss of the antioxidant effect, by means of the maximization of the highest antioxidant capacity in weeks 0 and 6 and the lowest reduction in the change, understood as the difference between the values of the antioxidant capacity method that best correlated the content of phenols, between weeks 6 and 0.
In both cases, Statgraphics version 16 was used. The license is protected by Lasallian University Corporation.
3. Results and Discussion
3.1. Physico-Chemical and Microbiological Characterization of the Banana Passion Fruit Pulp
The results of antioxidant capacity and microbiological characterization for the banana passion fruit pulp are presented in Table 2
Table 2 . Physical-chemical and microbiological characterization and AOA of the banana passion fruit pulp.
aPhysical chemical characterization of the banana passion fruit pulp. bMicrobiological characterization of the banana passion fruit pulp. cAOA: Contains of phenols and Antioxidant Activity of the banana passion fruit pulp.
The microbiological results showed that the microbial load in terms of fungi and yeasts are between the levels permitted by the law [20] . Additionally, the effectiveness of the thermal treatment was analyzed under safety terms, in order to propose the banana passion fruit pulp as a possible food or pharmaceutical additive.
The assays of the banana passion fruit were made from the pulp instead of its extract because preliminary studies performed by Saénz et al. showed a reduction in the antioxidant capacity when the pear’s ethanolic extracts were microencapsulated in comparison to the antioxidant capacity obtained from the microencapsulated pear pulp directly [21] .
The profile of the antioxidant activity of the banana passion fruit pulp is shown in Table 2; it can be observed that the TPC in the pulp of banana passion fruit were superior to those reported by Contreras et al. in 2011 with a value of 635 ± 2.7 reported for the Passiflora mollisima. Meanwhile, the value was 1018 ± 14.5 mg of GAE/100 g of fresh weight for Passiflora tarminiana; both of these species are grown in Colombia [5] . Lower values were reported by Beserra-Almeida et al. (2011), when they evaluated the TPC in 11 fruits from the North East of Brazil. Their study showed variations from 13.5 ± 1.1 to 159.9 ± 5.6 mg of GAE/100g of fresh weight [22] . Likewise, Kukoski et al., in 2005, reported the TPC for the most consumed pulps in the South of Brazil (blackberry, grape, guava, strawberry, acerola berry, pineapple, mango, graviola fruit and passion fruit), to be between 20.0 ± 2.6 and 580.1 ± 4.6 mg/100g [23] . The result obtained for banana passion fruit was also higher than those obtained by Marquina et al. (2008) for the pulp of guava (6730 mg GAE/100g of fruit) [24] .
The results of antioxidant capacity for the banana passion fruit (8105 ± 424.2 µmol TEAC/100 g of sample), evaluated by ORAC are shown in Table 2, were higher than those reported in blueberries (4669 ± 194 µmol TEAC/100g of sample), strawberries (4302 ± 398 µmol TEAC/100g of sample), grapes (1746 ± 55 µmol TEAC/100g of sample), guavas (1422 ± 55 µmol TEAC/100g) and pineapples (943 ± 53 µmol TEAC/100g of sample). The ORAC value was similar to that for dehydrated pear, up to 40% of humidity (9496 ± 420 µmol TEAC/100g of sample) [25] .
The variations in the TPC results could be due to factors such as the variety, the cultivar, the season, the vegetative conditions (specially the content of nutrients and the intensity of sunlight), the health of the fruit, the post-harvest storing methods and the maturity [26] . Besides, the extraction processes used by Contreras et al. and other authors mentioned before could influence the concentrations of the compounds responsible for the antioxidant activity of the banana passion fruit. Thermal treatment of the banana passion fruit pulp in this research may have increased the concentration of the TPC and the antioxidant capacity, allowing the hydroxyl groups to become more exposed at elevated temperatures, thus facilitating the donation of protons of the phenolic compounds, which were initially condensated [21] .
Some authors found a high correlation between the total phenolic content with the antioxidant activity in several fruits [23] [27] , similar to the correlation obtained between the content of phenolic compound in the pulp and the antioxidant capacity obtained by DPPH (y = 10.131x + 2042.5; R2 = 0.9598), ABTS (y = 246.1x + 74082; R2 = 0.5738) and FRAP (y = 2.901x + 1063; R2 = 0.878), and superior to that found by Vasco, Rualesand and Kamal-Eldin in 2008 [4] .
Some phenolic acids contained in banana passion fruit, never reported before, were determined by HPLC, finding the presence of 13.9 ± 0.004 mg of caffeic acid, 5.9 ± 0.001 mg of p-coumaric acid and 126.3 ± 0.004 mg of ferulic acid, expressed in 100 g of pulp on a dry base.
The presence of these compounds is important because previous studies have reported them to be responsible for the antioxidant capacity of coffee and its relationship with the protective effect against cardiovascular diseases due to the protection of lipoproteins of the oxidation in this order: caffeic > sinapic > ferulic [28] . Other in vivo studies about the phenolic acids mentioned confirm that the antioxidant effect on lipoproteins is mainly due to their synergic relationship [29] .
3.2. Correlations between the AOA Method and TPC in the Pulp of Microencapsulated Banana Passion Fruit.
Table 3 shows the results of TPC and AOA by ABTS, DPPH and FRAP of the banana passion fruit pulp when this pulp was microencapsulated with MD and MS in different proportions, according to the mixture design shown in Table 1.
Figure 1 shows the correlation between the TPC with each of the methods used to evaluate the antioxidant capacity (FRAP, DPPH and ABTS) in the weeks 0, 2, 4 and 6, which were evaluated in each microcapsule obtained with the different mixtures of maltodextrin encapsulants (MD) and modified starch (MS). The correlation was made by multivariate analysis of the main components. This figure shows that ABTS had the best correlation for most of the mixtures of encapsulants, except for the MD:MS ratio of 0.75:0.25 in the weeks 0, 2 and 4, and unlike the DPPH and FRAP methods, which presented inverse correlations. Therefore, ABTS was chosen as the most reliable method to monitor the half-life of the microcapsules and the best proportion of encapsulants.
These results could be due to the fact that generation of the ABTS●+ cationic radical is the basis for one of the most widely used spectrophotometric methods to determine the total antioxidant activity of extracts, pure compounds, aqueous mixtures and beverages, because of the ease of extracting the compounds responsible for the antioxidant activity with the conditions under which the method was performed [30] .
3.3. Determination of the Best Encapsulant Mixture
The linear model showed significant differences (p < 0.05) in comparison to the average, quadratic and special cubic model. The latter is regarded as a first order one for every component.
The linear polynomials that represent every behavior of the experiment to maximize or minimize the response variables are shown in Table 4.
When the ABTS value is maximized in weeks 0 and 6, looking to obtain a representative value of AOA, and when the difference in ABTS values found between weeks 0 and 6 are minimized, in order to prove a minimal reduction of the antioxidant capacity, it can be seen from the previous polynomials that the relation MD:MS (0:1) offered the desired characteristics. Figure 2 represents the polynomial equations exposed in Table 4.
Figure 2 represents the behavior of the response surface generated when a first degree polynomial is adjusted to the experimental data. In (a) and (b), it can be seen that the maximum value of ABTS in weeks 0 and 6 is ob
Table 3. Levels of phenols and antioxidant activity of the pulp of microencapsulated banana passion fruit with different mixtures of encapsulants (MD and MS).
Table 4 . Linear polynomials for (ABTS 0, ABTS 6, ABTS difference).
aAntioxidant activity method selected during the observed weeks; bMD: Maltodextrin and MS: Modified Starch.
tained when MS and MD are used in the superior level, but the lowest reduction of antioxidant capacity among the weeks evaluated was for the sample with 100% MS.
3.4. Stability of the Microencapsulated Banana Passion Fruit Pulp
A semi-log plot of the percentage of antioxidant capacity by ABTS vs. storage time showed a sharp linear de-
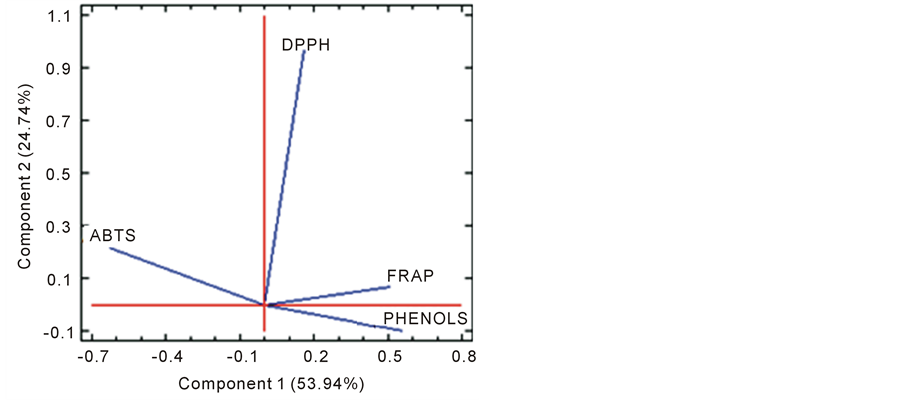
Figure 1. Plot of component weights.

Figure 2. Response surface: linear polynomials for (ABTS 0, ABTS 6, ABTS difference). MS: Modified Starch; MD: Maltodextrin.
crease in all cases, indicating that the decrease in these constituents followed first-order kinetics. The t1/2 for the antioxidant capacity by ABTS in microencapsulated banana passion fruit pulp with different mixes of encapsulates was between 5.8 and 31.5 weeks, thus showing that the microcapsules prepared only using MS exhibited the highest stability because a half-life time of 31.5 weeks was found, as observed in Table 5, followed by a mixture of MD:MS in a 1/4:3/4 ratio. It could be seen that, as the concentration of MS increased, the half-life of the constituents increased as well. A similar half-life time (between 9 and 28 weeks) appeared in a study performed on microencapsulated black carrot with MD and different degrees of dextrose equivalents [31] .
Other studies were performed in which two encapsulant systems were used, the first with AGMD-1 (arabic gum/maltodextrin 1:5 w/w) and the second with AG/MD-2 (arabic gum/maltodextrin 1:10 w/w) to protect the organoleptic properties of one of the fruits with a remarkable antioxidant capacity, such as guava. These studies obtained better results with the first system, in which there was a lower maltodextrin content, but the presence of arabic gum reduced its acceptable sensory profile for consumers, thus preventing it from being feasible as a food and pharmaceutical additive [32] .
The preparation of the mixture of encapsulants with MD had demonstrated advantages in other research works. These studies show that the polyphenols contained in the microencapsulated blackcurrant with MD with different dextrose equivalents were better due to increased performance during spray drying and the increased protection of the biological activity of the compounds responsible for its antioxidant activity as determined by the DDPH and ABTS methods [33] .
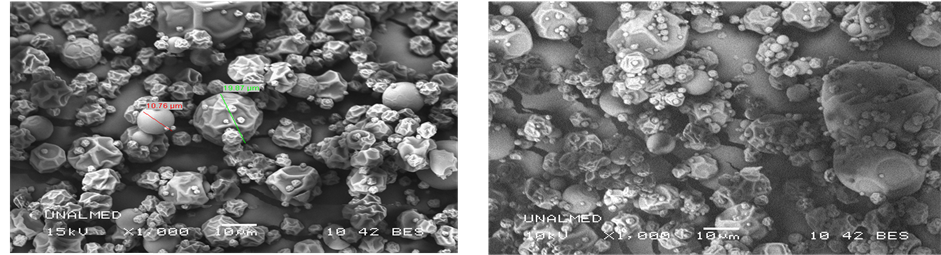
3.5. Morphology of the Microcapsules by SEM
Figures 3(a)-(e) show scanning microscopic photographs of microcapsules for the five mixes of encapsulants.
Table 5. The half-life of antioxidant capacity by ABTS in the different blends of encapsulate for microencapsulated banana passion fruit.
aS: Mixture System.
 (a)
(a)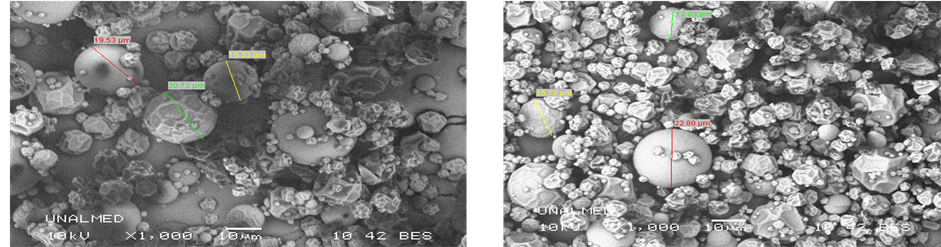 (b)
(b)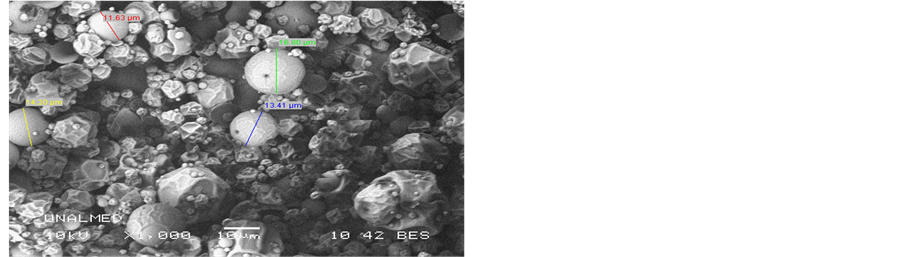 (c)
(c)
Figure 3. Scanning electron microscopic photographs of microcapsules for the five samples (a) (MS), (b) (MD), (c) (MS: MD, 50:50), (d) (MS: MD, 0.75:0.25), (e) (MS: MD, 0.25:0.75).
The morphology with both encapsulating agents and its respective mixes was irregularly spherical in shape because of the drying process. A similar morphology was observed in microcapsules of cactus pear [21] with maltodextrin and paprika oleoresin with modified starch [34] . The particle sizes were between 10 and 23 µm. This range could allow better solubility properties to be obtained in the final product.
4. Conclusions
This study identifies banana passion fruit as one of the most promising exotic fruit sources for naturally derived additives in order to be used by the food industry, due to the banana passion fruit showing an antioxidant activity higher than other recognized fruits as berries, advantage demonstrated by different methods, even though ABTS is the best method to measure the AOA in banana passion fruit because it correlated with the phenolic compounds better than DPPH and FRAP methods. Some of the most important phenolic compounds present in the Passiflora tripartita var. Mollisima in cursive were 13.9 ± 0.004 mg of caffeic acid, 5.9 ± 0.001 mg of p-coumaric acid and 126.3 ± 0.004 mg of ferulic acid, expressed in 100 g of pulp on a dry base.
The microencapsulation by spray-drying was found as an optimal alternative to protect the AOA of banana passion fruit because the half-life time followed by ABTS results was more extensive when MS was used at 100% and a mixture of MD and MS in a 1/4:3/4 ratio, which leads to a half-life time of 31.5 and 28 weeks, respectively.
The particle sizes between 10 - 23 µm of microcapsulated banana passion fruit with all mixtures could facility the solubility and its incorporation as antioxidant in complex food matrices.
Acknowledgements
To Lasallian University Corporation and National University from Colombia, for supporting this research under the project “Microencapsulation of bioactive compounds from banana passion fruit (Passiflora mollisima) cultivated in Colombia”, and also to collaborators Diego Sánchez, Angélica Soto, Maria Álvarez and Felipe Álzate.
References
- Robards, K., Prenzler, P., Tucker, G. and Swatsitang, P. (1999) Phenolic Compounds and Their Role in Oxidative Processes in Fruits. Food Chemistry, 66, 401-436. http://dx.doi.org/10.1016/S0308-8146(99)00093-X
- Bisht, V., Negi, J., Bhandari, A. and Sundriyal, R. (2011) Anti-Cancerous Plants of Uttarakhand Himalaya. International Journal of Cancer, 7, 192-208.
- Hernández, A. and Bernal, R. (2000) Lista de Especies de Passifloraceae de Colombia. Biota Colombiana, 1, 320-335.
- Vasco, C., Ruales, J. and Kamal-Eldin, A. (2008) Total Phenolic Compounds and Antioxidant Capacities of Major Fruits from Ecuador. Food Chemistry, 111, 816-823. http://dx.doi.org/10.1016/j.foodchem.2008.04.054
- Contreras-Calderon, J., Calderón-Jaimes, L., Guerra-Hernández, E. and García-Villanova, B. (2011) Antioxidant Capacity, Phenolic Content and Vitamin C in Pulp, Peel and Seed from 24 Exotic Fruits from Colombia. Food Research International, 44, 2047-2053. http://dx.doi.org/10.1016/j.foodres.2010.11.003
- Bush, R., Taylor, S. and Busse, W. (1986) A Critical Evaluation of Clinical Trials in Reactions to Sulfites. Journal of Allergy and Clinical Immunology, 78, 191-202. http://dx.doi.org/10.1016/0091-6749(86)90012-6
- Botero, M., Ricaurte, S., Monsalve, C. and Rojano, B. (2007) Capacidad Reductora de 15 Frutas Tropicales. Scientia et Technica, 13, 295-296.
- Castellar, R., Obon, J., Alacid, M. and Fernández-López, J. (2003) Color Properties and Stability of Betacyanins from Opuntia Fruits. Journal of Agricultural and Food Chemistry, 51, 2772-2776. http://dx.doi.org/10.1021/jf021045h
- Desai, K. and Park, H. (2005) Recent Development in Microencapsulation of Foods Ingredients. Drying Technology, 23, 1361-1394. http://dx.doi.org/10.1081/DRT-200063478
- Ceballos, A. (2008) Estudio Comparativo de tres Sistemas de Secado para la Producción de un polvo Deshidratado de Fruta. Universidad Nacional de Colombia, Manizales.
- AOAC International (2007) Official Methods of Analysis of AOAC International. 18th Edition, AOAC Intl., Gaithersburg.
- Rojano, B., Saez, J., Schinella, G., Quijano, J., Vélez, E. and Gil, A. (2008) Experimental and Theoreticaldetermination of the Antioxidant Properties of Isoespintanol (2-ISOPROPYL-3,6-dimethoxy-5-methylphenol). Journal of Molecular Structure, 877, 1-6.
- Benzie, I. and Strain, J. (1996) The Ferric Reducing Ability of Plasma (FRAP) as a Measure of “Antioxidant Power: The FRAP Assay”. Analytical Biochemistry, 239, 70-76. http://dx.doi.org/10.1006/abio.1996.0292
- Ou, B., Hampsch-Woodill, M. and Prior, R. (2001) Development and Validation of an Improved Oxygen Radical Absorbance Capacity Assay Using Fluorescein as the Fluorescent Probe. Journal of Agricultural and Food Chemistry, 49, 4619-4626. http://dx.doi.org/10.1021/jf010586o
- Kelebek, H., Serkan, S., Ahmetm, C. and Turgut, C. (2009) HPLC Determination of Organic Acids, Sugars, Phenolic Compositions and Antioxidant Capacity of Orange Juice and Orange Wine Made from a Turkish cv. Kosan. Microchemical Journal, 91, 187-192. http://dx.doi.org/10.1016/j.microc.2008.10.008
- Cai, Y. and Corke, H. (2000) Production and Properties of Spray-Dried Maranthusbetacyanin Pigments. Journal of Food Science, 65, 1248-1252. http://dx.doi.org/10.1111/j.1365-2621.2000.tb10273.x
- Goldstein, J. (2003) Microscopía Electrónica de Barrido y Microanálisis de Rayos X. 689.
- Lewis, G., Mathieu, D. and Phan-Tan-Luu, R. (1999) Pharmaceutical Experimental Design. Marcel Dekker. Inc., New York, 448.
- Cornell, J. (2002) Experiments with Mixtures: Designs, Models, and the Analysis of Mixture. 3rd Edition, John Wiley & Sons, Inc., New York. http://dx.doi.org/10.1002/9781118204221
- Codex Alimentarius (2005) Norma General del Codex para Zumos, Jugos (Néctares) de Fruta.
- Saénz, C., Tapia, S., Chávez, J. and Robert, P. (2009) Microencapsulation by Spray Drying of Bioactive Compounds from Cactus pear (Opuntiaficus-Indica). Food Chemistry, 114, 616-622. http://dx.doi.org/10.1016/j.foodchem.2008.09.095
- Beserra-Almeida, M.M., Machado de Sousa, P.H., Campos Arriaga, A., Matias do Prado, G., Carvalho Magalhães, C., Arraes Maia, G. and Gomes de Lemos, T. (2011) Bioactive compounds and Antioxidant Activity of Fresh Exotic Fruits from Northeastern Brazil. Food Research International, 44, 2155-2159. http://dx.doi.org/10.1016/j.foodres.2011.03.051
- Kukoski, E., Asuero, A., Troncoso, A., Mancini-Filho, J. and Fett, R. (2005) Aplicación de Diversos Métodos Químicos para Determinar Actividad Antioxidante en pulpa de Frutos. Ciência e Tecnologia de Alimentos, 25, 726-732. http://dx.doi.org/10.1590/S0101-20612005000400016
- Marquina, V., Araujo, L., Ruíz, J., Rodríguez-Malaver, A. and Vit, P. (2008) Composición Química y Capacidad Antioxidante en fruta, pulpa y Mermelada de Guayaba (Psidiumguajava L.). Archivos Latinoamericanos de Nutrición, 58, 98-102.
- USDA (2013) Oxygen Radical Absorbance Capacity (ORAC) of Selected Foods. Release 2. http://www.ars.usda.gov/SP2UserFiles/Place/12354500/Data/ORAC/ORAC_R2.pdf
- Strail, P., Klejdus, B. and Kubán, V. (2007) Determination of Phenolic Compounds and Their Antioxidant Activity in Fruits and Cereals. Talanta, 4, 1741-1751. http://dx.doi.org/10.1016/j.talanta.2006.08.012
- Thaiponga, K., Boonprakoba, U., Crosbyb, K., Cisneros-Zevallosc, L. and HawkinsByrnec, D. (2006) Comparison of ABTS, DPPH, FRAP, and ORAC Assays for Estimating Antioxidant Activity from Guava Fruit Extracts. Journal of Food Composition and Analysis, 19, 669-675. http://dx.doi.org/10.1016/j.jfca.2006.01.003
- Carboneau, M., Leger, C. and Monnier, L. (1997) Supplementation with Wine Phenolic Compounds Increases the Antioxidant Capacity of Plasma and Vitamin E of LDL. European Journal of Clinical Nutrition, 51, 682-690. http://dx.doi.org/10.1038/sj.ejcn.1600464
- Gutierres, A. (2002) Antioxidantes y Protección a la Salud. MEDISAN, 6, 72-81.
- Re, R., Pellegrini, N., Proteggente, A., Pannala, A., Yang, M. and Rice-Evans, C. (1999) Antioxidant Activity Applying an Improved ABTS Radical Cation Decolorizing Assay. Free Radical Biology & Medicine, 26, 1231-1237. http://dx.doi.org/10.1016/S0891-5849(98)00315-3
- Ersus, S. and Yurdagel, U. (2007) Microencapsulation of Anthocyanin Pigments of Black Carrot (Daucuscarota L.) by Spray Drier. Journal of Food Engineering, 80, 805-812.
- Osorio, C., Forero, D. and Carriazo, J. (2011) Characterisation and Performance Assessment of Guava (Psidiumguajava L.) Microencapsulates Obtained by Spray-Drying. Food Research International, 44, 1174-1181. http://dx.doi.org/10.1016/j.foodres.2010.09.007
- Bakowska-Barczak, A.M. and Kolodziejczyk, P. (2011) Black Currant Polyphenols: Their Storage Stability and Microencapsulation. Industrial Crops and Products, 34, 1301-1309. http://dx.doi.org/10.1016/j.indcrop.2010.10.002
NOTES

*Corresponding author.