Food and Nutrition Sciences
Vol.5 No.4(2014), Article ID:42650,15 pages DOI:10.4236/fns.2014.54036
Antioxidant Capacities and Main Reducing Substance Contents in 110 Fruits and Vegetables Eaten in China
1Key Laboratory of Food Nutrition and Safety, Ministry of Education, Tianjin University of Science and Technology, Tianjin, China; 2China National Japonica Rice Research & Development Centre, Tianjin, China; 3College of Science, Tianjin University of Science and Technology, Tianjin, China.
Email: *cjliu@tust.edu.cn
Copyright © 2014 Changjin Liu et al. This is an open access article distributed under the Creative Commons Attribution License, which permits unrestricted use, distribution, and reproduction in any medium, provided the original work is properly cited. In accordance of the Creative Commons Attribution License all Copyrights © 2014 are reserved for SCIRP and the owner of the intellectual property Changjin Liu et al. All Copyright © 2014 are guarded by law and by SCIRP as a guardian.
Received August 11th, 2013; revised September 11th, 2013; accepted September 18th, 2013
Keywords: Antioxidant Capacity; Fruits; Vegetables; Phenolic; Flavonoid; Vitamin C
ABSTRACT
The aim of this study was to screen strongly-antioxidant fruits and vegetables and supply practical diet guidance for the public. We used 1,1-diphenyl-2-picrylhydrazyl (DPPH), ferric-reducing antioxidant potential (FRAP), 2,2’-azino-bis-3-ethylbenzthiazoline-6-sulphonic acid (ABTS) and total reducing power (TRP) assays to investigate antioxidant activities in 110 fruits and vegetables. To analyze the correlation between antioxidant capacities and main reducing substance contents, total phenolic, flavonoid and vitamin C contents were assessed. The results showed great variation in antioxidant activity, and fifteen fruits and vegetables possessed the strongest antioxidant capacities: Toona sinensis, hawthorn, jujube, lotus root, persimmon, red plum, black plum, chilli pepper, star fruit, strawberry, blueberry, cherry, peach, pomegranate and great burdock. Total phenolic contents showed higher correlation with antioxidant capacity when using FRAP and TRP assays than when using the DPPH or ABTS assay. Phenolics and flavonoids, rather than vitamin C, contributed to antioxidant potential in most fruits and vegetables.
1. Introduction
Many epidemiological studies have indicated that the oxidative stress imposed by reactive oxygen species (ROS) plays an important role in many chronic and degenerative diseases, such as cardiovascular diseases, cancer, diabetes mellitus, neurodegenerative diseases and ageing [1,2]. The scavenging of ROS is thought to be an effective measure to depress the level of oxidative stress in organisms for prevention and treatment of some chronic and degenerative diseases [3]. Fruits and vegetables are good sources of natural antioxidants, vitamins and minerals, which play key roles in maintaining nutritional balance and scavenging ROS in the human body. Various studies have demonstrated that intakes of fruits and vegetables rich in antioxidants are inversely associated with the risk of many chronic diseases, such as cardiovascular diseases and cancer [4-6]. Following cereal foods, fruits and vegetables played the second most important role in the traditional Chinese diet, the Yellow Emperor Canon of Medicine, which was compiled from about 475-221 BC and emphasized that, “fruits are helpful and vegetables are beneficial supplementary food for human health”, indicating that Chinese ancestors realized fruits and vegetables had a positive influence on human health and nutritional balance. A great deal of recent research has indicated that fruits and vegetables rich in natural nutrients and secondary metabolites with antioxidant activity, such as phenolic and flavonoid compounds, contributed to overall health and disease prevention [7-9]. Phenolic and flavonoid compounds are considered to have potent antioxidant capacity and ROS-scavenging activity. In recent years, there has been considerable interest in determining total phenolic contents and antioxidant capacities of vegetables and fruits [10,11]. Flavonoids, a large family of compounds with a C6-C3-C6 skeleton structure, are the most abundant polyphenols in human diets. Polyphenols are regarded as basic to human health and have broad pharmacological effects on human health, especially in prevention of age-related diseases [12]. Besides phenolic and flavonoid compounds, ascorbic acid (vitamin C) is usually considered to be one of the main reducing substances in fruits and vegetables.
Following development of the economy and improvement of living conditions in China, some chronic and degenerative diseases, such as cardiovascular diseases, cancer, diabetes mellitus, neurodegenerative diseases and ageing, have increased in both cities and countryside. For health promotion and disease prevention, it is necessary for the public to know about the total antioxidant capacities and main reducing substance contents in common fruits and vegetables. In recent years, there has been a great deal of research on the antioxidant capacities of fruits and vegetables in China [3,13]. However, these studies all included small samples and used only one or two assay methods, thus limiting the value of their results. A comparative, multi-method screening of a larger number of fruits and vegetables for antioxidant activity in relation to their phenolic compounds and vitamin C is needed to provide a better understanding of the foods’ relative importance as natural antioxidants.
The aim of this study is to systematically evaluate antioxidant capacities with DPPH, ABTS, FRAP and TRP assays and to determine the hydrophilic antioxidant substance content including total phenolic, flavonoid and vitamin C content of 110 fruits and vegetables commonly consumed in China. The study also aims to investigate the correlation between antioxidant capacities and the main reducing substance contents of the foods so as to supply valuable guidance for consumers. Correlation among different antioxidant evaluation methods will also be investigated to obtain the most accurate results.
2. Materials and Methods
2.1. Chemicals and Samples
Gallic acid, ascorbic acid, 2,4,6-Tri(2-pyridyl)-S-triazine (TPTZ), 2,2’-azinobis(3-ethylbenothiazoline-6-sulphonic acid) diammonium salt (ABTS), 1,1-diphenyl-2-picrylhydrazyl (DPPH) and Folin-Ciocalteu’s phenol reagent were purchased from Sigma-Aldrich (St. Louis, MO). Potassium persulphate, sodium carbonate, iron (III) chloride 6-hydrate, iron (II) sulphate 7-hydrate, acetic acid and sodium acetate and potassium ferricyanide were obtained from Tianjin Chemical Factory (Tianjin, China). Ethanol, trichloroacetic acid and hydrochloric acid were purchased from Tianjin Guangfu S & T Development Co., Ltd. (Tianjin, China). All chemicals used in the experiments were of analytical grade, and distilled water was used.
All 110 fruits and vegetables were collected from the supermarkets in Tianjin, China.
2.2. Sample Preparation and Determination of Moisture Content
The fruit or vegetable was washed with distilled water to remove dirt on their peels, and was given an airing at room temperature for a short time. Then, a precisely weighed amount (about 10.00 g) of edible portions of the samples were cut into small pieces and homogenized with a special grinder with a mixture of 90 ml ethanolwater (50:50, v/v) at 4˚C for 4 hr. The mixture was centrifuged at 5000 rpm for 20 min, and then the supernatants were filtered through a 0.2 µm PTFE membrane filter. The sample with final volume 100 ml was collected for the evaluation of antioxidant capacities, total phenolic and flavonoid contents. Another edible portion of each sample was dried in air oven at 95˚C for 48 hr until there was no change in weight and then determined moisture content. Samples were extracted and dried in triplicate.
2.3. DPPH Radical-Scavenging Activity Assay
The DPPH radical-scavenging capacity was measured by the method described by Braca et al. [14], with a slight modification. Briefly, a 2 ml ethanol solution of DPPH (0.2 mM) was mixed with 2 ml of fruit or vegetable extract in a 10 ml tube and incubated in the dark for 60 min at room temperature before absorbance was measured at 517 nm using a 752N UV-Vis spectrophotometer (Shanghai, China).
The radical-scavenging activity of the extract was calculated as follows:
where Acontrol is the absorbance of a mixture of 2 ml DPPH solution and 2 ml 80% ethanol solution, Asample is the absorbance of a mixture of 2 ml DPPH solution and 2 ml extract solution, while Abackground is the absorbance of a mixture of the extract and 80% ethanol solution in a volume ratio of 1:1. All samples were tested in triplicate.
2.4. ABTS Radical-Scavenging Activity Assay
The ABTS assay was carried out according to the method established in the literature [15]. Briefly, the ABTS+ stock solution was prepared from 7 mM ABTS and 2.45 mM potassium persulphate in a volume ratio of 1:1 and then incubated in the dark for 16 hr at room temperature and used within 2 days. The ABTS+ working solution was prepared by diluting the stock solution with ethanol to an absorbance of 0.70 ± 0.05 at 734 nm. The sample extract (200 µl) was mixed with 2 ml of the ABTS+ working solution. Absorbance of the mixture was measured at 734 nm, and the results were expressed as follows:
where Acontrol is the absorbance of a mixture of 200 µl water and 2 ml ABTS+ working solution, while Asample is the absorbance of a mixture of 200 µl extracts and 2 ml ABTS+ working solution. All samples were tested in triplicate.
2.5. Ferric-Reducing Ability of Plasma (FRAP) Assay
The FRAP assay was determined according to the method described in the literature [16], with a slight modification. The FRAP assay measures ability of antioxidants in the vegetable or fruit extracts to reduce ferrictripyridyl-triazine (Fe3+-TPTZ) complex to the blue-colored, ferrous form (Fe2+), which absorbs light at 593 nm. Briefly, sample extract (200 µl) was mixed with 2.8 ml of ferric-TPTZ reagent (prepared by mixing 300 mM acetate buffer, pH 3.6, and 10 mM TPTZ with 40 mM HCl and 20 mM FeCl3∙6H2O at a ratio of 10:1:1 (v/v/v)) and incubated at 37˚C for 10 min. Six concentrations, of 5, 10, 20, 30, 40 and 50 µmol/L, were used to prepare the standard curve of FeSO4. Antioxidant activities are expressed as micromole Fe (II) equivalent per 100 grams fresh weight. Higher values indicate higher reducing power of the sample, and, thus, higher antioxidant activity.
2.6. Total Reducing Power (TRP) Assay
TRP assay of the 110 extracts was determined and expressed as vitamin C equivalence according to the method described in the literature [17], with a slight modification. Briefly, each extract of 1.0 ml was mixed with 2.5 ml phosphate buffer solution (0.2 M, pH 6.6) and 2.5 ml of 1% aqueous potassium ferricyanide, and then incubated at 50˚C for 30 min. Then, 2.5 ml of 1% trichloroacetic acid was added to the mixture to stop the reaction, and the mixture was centrifuged at 5000 rpm for 10 min. The supernatant 2.5 ml was mixed with 2.5 ml distilled water and 0.1% FeCl3 (5 ml), and absorbance was measured at 700 nm with a spectrophotometer. Ascorbic acid was used as a reference owing to its good reducing property. Increased absorbance in 700 nm of the reaction mixture indicated increased reducing power.
2.7. Determination of Total Phenolic Content
Total phenolic content (TPC) was determined according to the literature [3,18]. Briefly, 1 ml of the sample extract or gallic acid standard was added into 2.5 ml of 0.2 M diluted Folin-Ciocalteu reagent. After 6 min, 2 ml of saturated sodium carbonate (about 75 g/L) was added. Absorbance of the mixture was measured at 760 nm after incubation for 2 hr at room temperature. The calibration curve (y = 7.75x − 0.0082; R2 = 0.9960) was recorded by using milligram gallic acid equivalents/g dry weight (mg GAE/g DW). All samples were tested in triplicate.
2.8. Determination of Total Flavonoid Content
Total flavonoid content (TFC) was determined according to the reported literature [19], with a slight modification. Briefly, 1 ml of each extract or rutin standard was separately mixed with 0.5 ml of 10% sodium nitrite. After 5 min, 0.5 ml of 10% aluminium nitrate was added and mixed. After 6 min, 3 ml of 4% sodium hydroxide was added and mixed. The final volume was 10 ml with 40% ethanol solution. The reaction mixture was incubated at room temperature for 15 min. Absorbance of the reaction mixture was measured at 510 nm with a UV-visible spectrophotometer. The calibration curve (y = 0.001x + 0.0024; R2 = 0.9917) was recorded by using rutin standard solutions in 40% ethanol with concentrations ranging from 2 to 20 µg/ml. TFC was expressed in terms of milligrams of rutin equivalent per gram of dry mass (mg RE/g DW). Three replications were performed for each to get more accurate results. Results are represented as mean ± standard deviation (SD).
2.9. Determination of Vitamin C Content
Vitamin C content was determined according to the literature [20,21]. The reaction principle is that the ammonium molybdate as a colouring reagent with vitamin C forms the molybdenum blue in the presence of  ions, and the reaction complex has a strong absorption at a wavelength of 730 nm. Briefly, 10 grams of a fruit or vegetable was homogenized with 2% oxalate solution and then filtered to a final volume of 100 ml. Each filtrate 1 ml was separately mixed with a 6% H2SO4 solution of 1.5 ml and a 10% ammonium molybdate solution of 2.5 ml in a tube. Finally, 6 ml double-distilled water was added and the reaction tube was sealed. The reaction mixture was dipped in boiling water for 6 min. After being cooled to room temperature, the reaction mixture was measured for absorbance at 730 nm with a UV-visible spectrophotometer. The calibration curve (y = 10.065x − 0.0574; R2 = 0.9966) was recorded by using standard vitamin C solution in the range of 2 - 22 µg/ml. The concentrations were expressed as mg of ascorbic acid equivalents per 100 g of fresh weight (mg Vc/100g FW).
2.10. Statistical Analysis
All the experiments were performed in triplicate, and the results were expressed as mean ± SD. Regression correlation coefficients were calculated to determine the correlation between the antioxidant evaluation method used and the measured contribution to antioxidant capacity of total phenols, total flavonoids and vitamin C. Statistical analysis was performed using SPSS 13.0 and Microsoft Excel 2003.
3. Results and Discussion
3.1. Antioxidant Capacities of 110 Fruits and Vegetables Commonly Consumed in China
DPPH assay is routinely used to evaluate free-radical scavenging potential of foods or other natural compounds and is considered a standard, easy colorimetric method for assessment of antioxidant properties [22]. Results of DPPH assay of 110 fruits and vegetables are shown in Table 1. These results indicate that different samples had a wide range of DPPH radical-scavenging activities, 8.59% ± 0.69% to 99.86% ± 0.46%, and the mean DPPH radical-scavenging rate was 58.05% for all 110 samples. Among them, Toona sinensis (TS), or Chinese toon, had the highest DPPH radical-scavenging activity (99.86% ± 0.46%), followed by hawthorn (95.72% ± 1.10%), pomegranate (94.62% ± 1.80%) and jujube (94.43% ± 0.36%). The other 12 foods that have DPPH radicalscavenging rates above 90% are black plum, chili pepper, star fruit, strawberry, red plum, blueberry, persimmon, cherry, lotus root, red delicious apple, peach and citrus lemon (Table 1). Durian had the lowest scavenging rate (8.59% ± 0.69%) among the tested samples.
ABTS assay better reflects antioxidant content in a variety of foods than DPPH assay [23]. The results in Table 1 showed that all samples had some ABTS+ radical-scavenging activities, with a wide range of from 7.77% ± 0.87% to 98.88% ± 1.04%, and the mean scavenging rate was 49.89% for all 110 samples. In agreement with the DPPH assay results, TS possessed the strongest ABTS+ radical-scavenging activity (98.88% ± 1.04%), followed by hawthorn (96.52% ± 0.98%), chili pepper (94.56% ± 5.15%) and persimmon (92.78% ± 0.69%). The other 13 foods that have ABTS+ radical-scavenging rates above 90% include jujube, black plum, star fruit, lotus root, strawberry, peach, taro, pomegranate, red plum, great burdock, ginger, cherry and blueberry (Table 1). Wax guard had the lowest free-radical scavenging rate (7.77% ± 0.87%) among the tested samples. The results of top-ranked antioxidant fruits and vegetables from ABTS assay are very close to those obtained by DPPH assay.
FRAP assay is based on the ability of antioxidants to reduce ferrous III ions to ferrous II ions, and FRAP assay is a simple and widely used method for antioxidant capacity evaluation [3,18]. As indicated in Table 1, FRAP values varied from 0.01 ± 0.00 to 12.81 ± 0.92 mmol Fe II/100g FW with the difference being 1281-fold and the average value being 0.386 mmol Fe II/100g FW, based on 110 samples. As Table 1 shows, TS had the highest antioxidant activity (12.81 ± 0.92 mmol Fe II/100g FW) of all samples analyzed and was ranked first in antioxidant activity by both DPPH and ABTS assays. Following TS, hawthorn fruit had the second-strongest antioxidant activity (4.95 ± 0.28 mmol Fe II/100g FW). In addition, the antioxidant values of jujube and lotus root were higher than 1 mmol Fe II/100g FW. The other ten fruits and vegetables (FRAP values above 0.56 mmol Fe II/ 100g FW) possessing stronger antioxidant activities as evaluated by FRAP assay were chili pepper, pomegranate, persimmon, black plum, red plum, strawberry, peach, winter Chinese date, great burdock and ginger, in that order. In contrast, milky cucumber, wax gourd, crown daisy, celery, summer squash and haricot bean had the lowest antioxidant activities, with FRAP values of about 0.02 mmol Fe II/100g FW, as Table 1 shows.
TRP assay is based on the principle of increase in absorbance of reaction mixtures [24], with increase absorbance indicating increased antioxidant activity. Ascorbic acid was used as a standard equivalent antioxidant. As indicated in Table 1, TRP values varied from 0.08 to 21.72 mg vitamin C/g FW, with the difference being 271- fold and the mean value being 1.24 mg vitamin C/g FW for 110 samples. TS had the highest TRP value (21.72 ± 1.05 mg vitamin C/g FW), while lettuce (edible stem) had the lowest TRP value (0.08 ± 0.02 mg vitamin C/g FW) among the tested samples. Besides TS, there were 14 other fruits and vegetables( TRP value above 2.02 mg vitamin C/g FW) possessing the higher antioxidant capacities: jujube, hawthorn, lotus root, black plum, great burdock, persimmon, red plum, strawberry, star fruit, chili pepper, Siraitia grosvenorii, peach, coriander and pomegranate. These fruits and vegetables possessed topranking ferric-reducing power.
Although variance in the antioxidant capacities of various fruits and vegetables was largely due to different evaluation methods, 15 top-ranked antioxidant fruits and vegetables were finally identified, including TS, hawthorn, jujube, lotus root, persimmon, red plum, black plum, chili pepper, strawberry, blueberry, cherry, star fruit, great burdock, peach and pomegranate. They displayed outstanding antioxidant potentials as rated by four evaluation systems. These fruits and vegetables can be important and convenient dietary sources of natural antioxidants for prevention of chronic degenerative diseases caused by oxidative stress. Our research indicated that

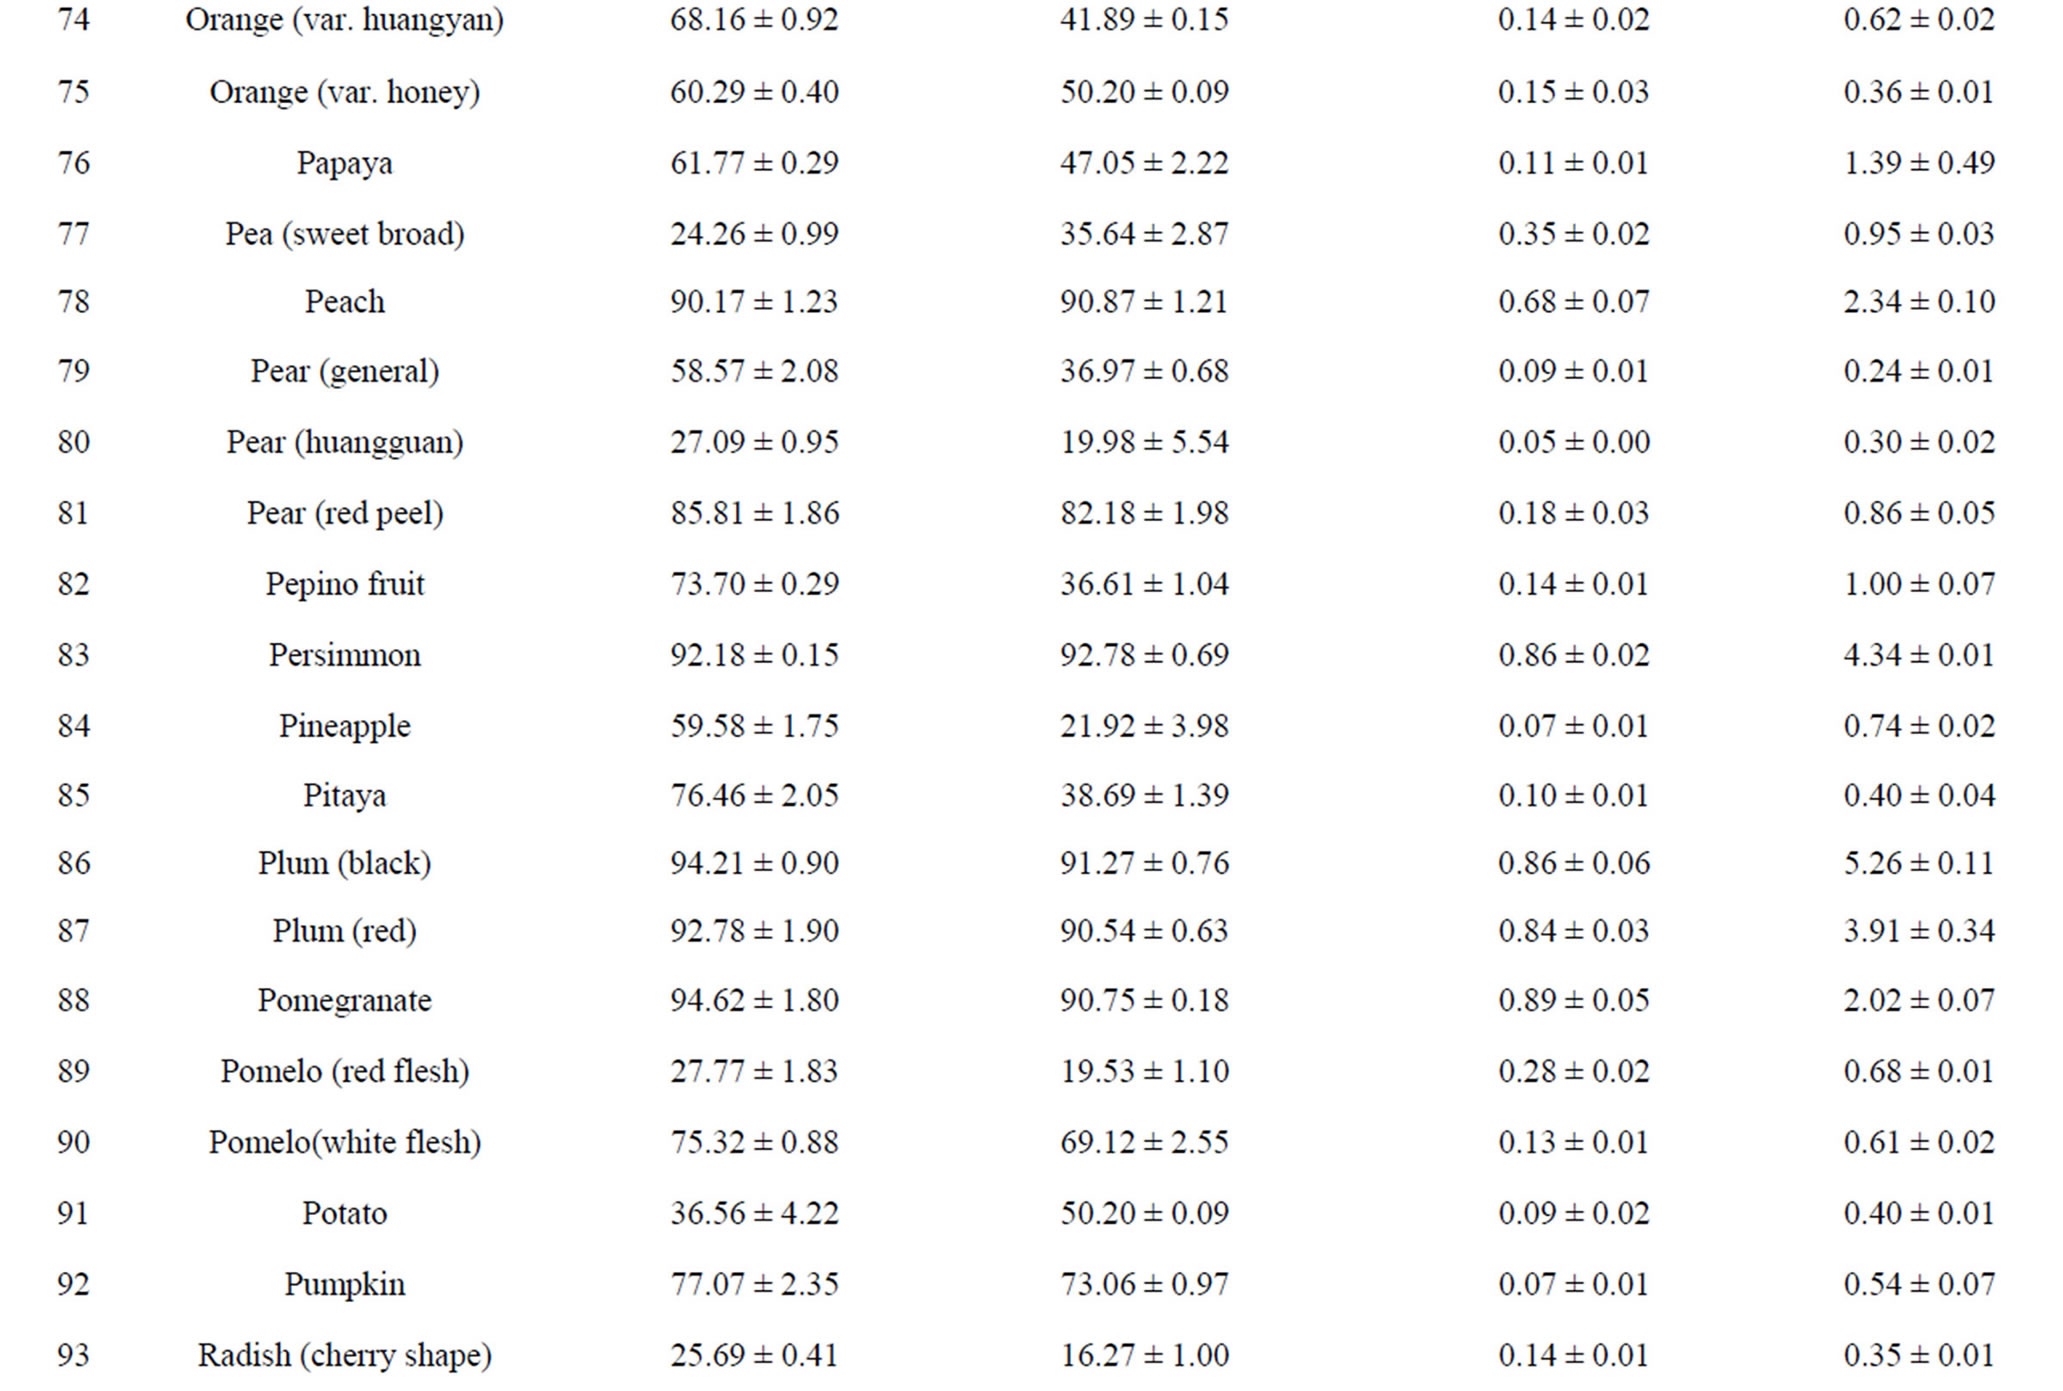


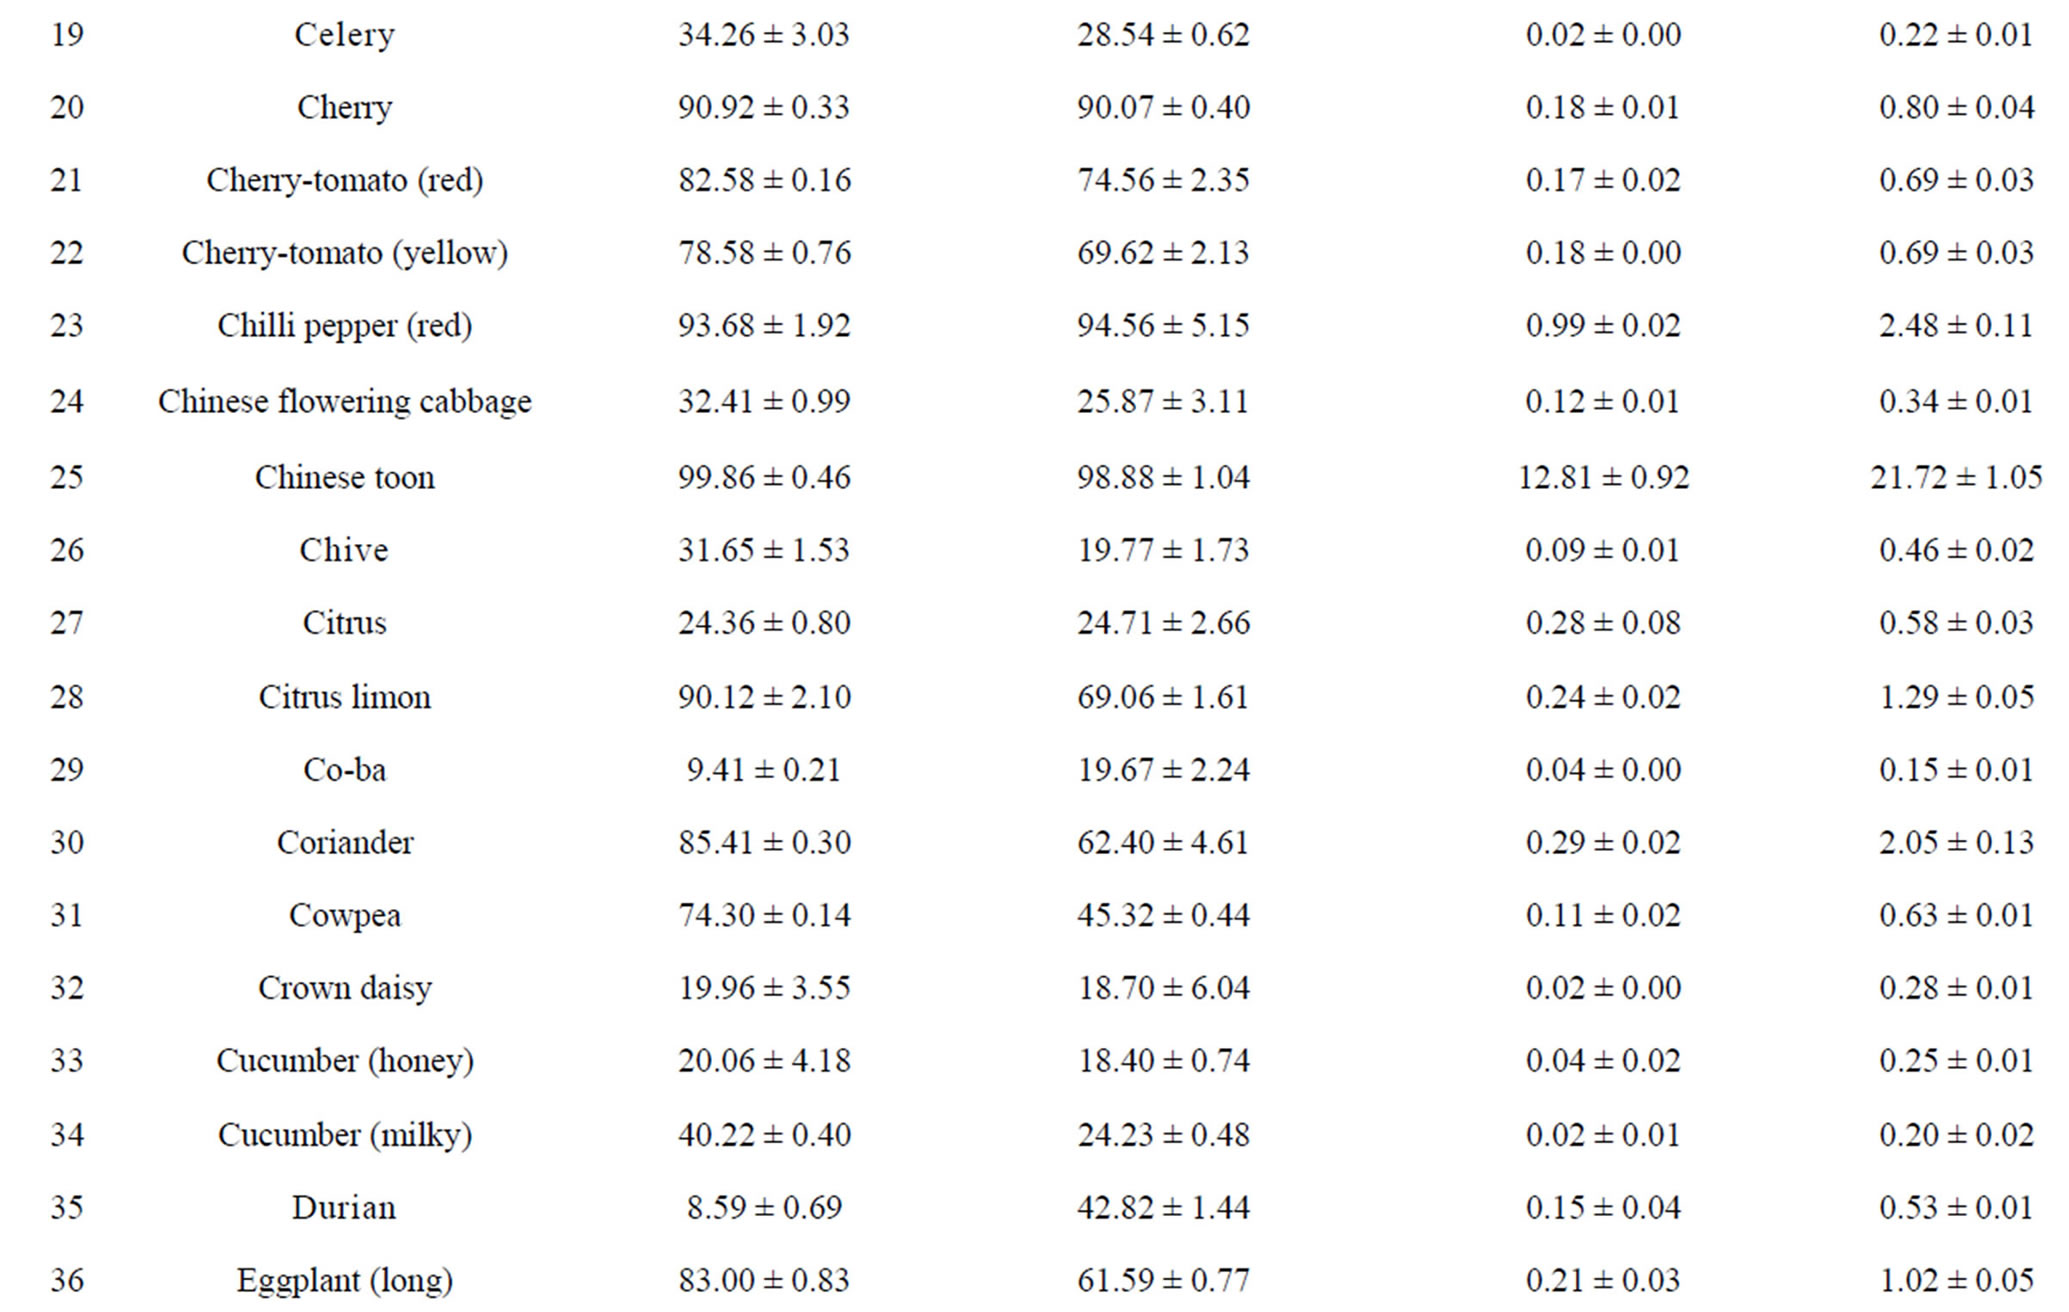
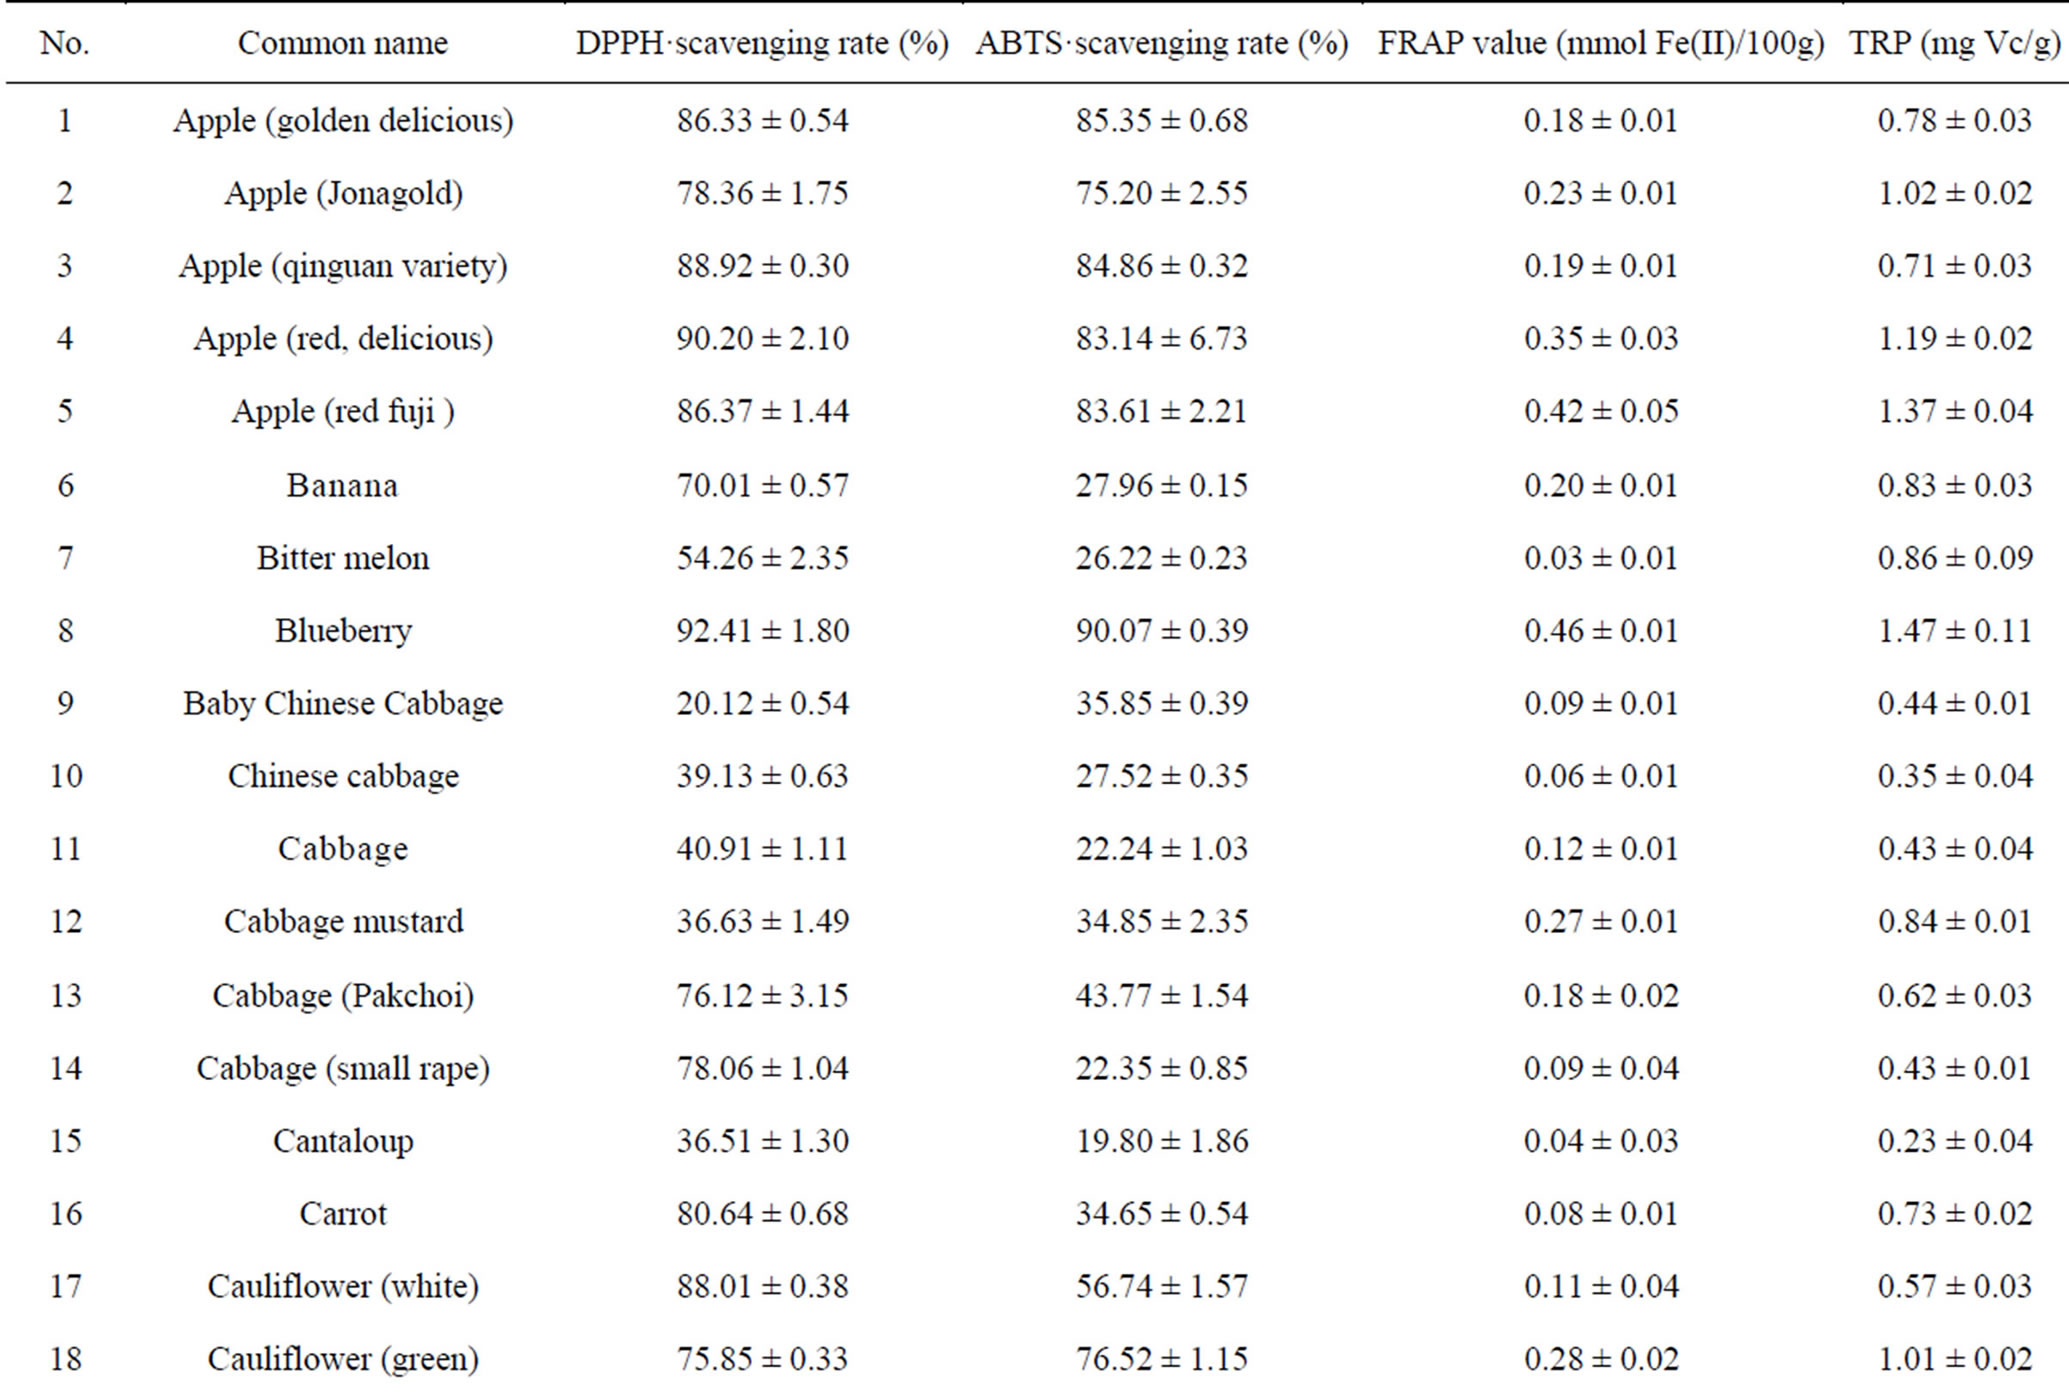
Table 1. Antioxidant capacities of 110 fruits and vegetables consumed in Chinaa.
aValues are means of 3 replicates ± standard deviation; n = 3.
TS, a popular tree vegetable originally from China, had the strongest antioxidant activities among the tested fruits and vegetables. Other recent research has shown that TS is rich in flavonoids and gallic acid, which play an important role in its antioxidant activity and make it an ideal dietary vegetable for natural antioxidants [25,26]. Our previous research also indicated that the older leaves as well as the edible, tender leaves of TS have significant antioxidant potential and are suitable natural alternatives to synthetic antioxidants [27]. Therefore, TS can be considered a good source of natural antioxidants with a health-promoting function.
3.2. Correlation among Different Evaluation Methods
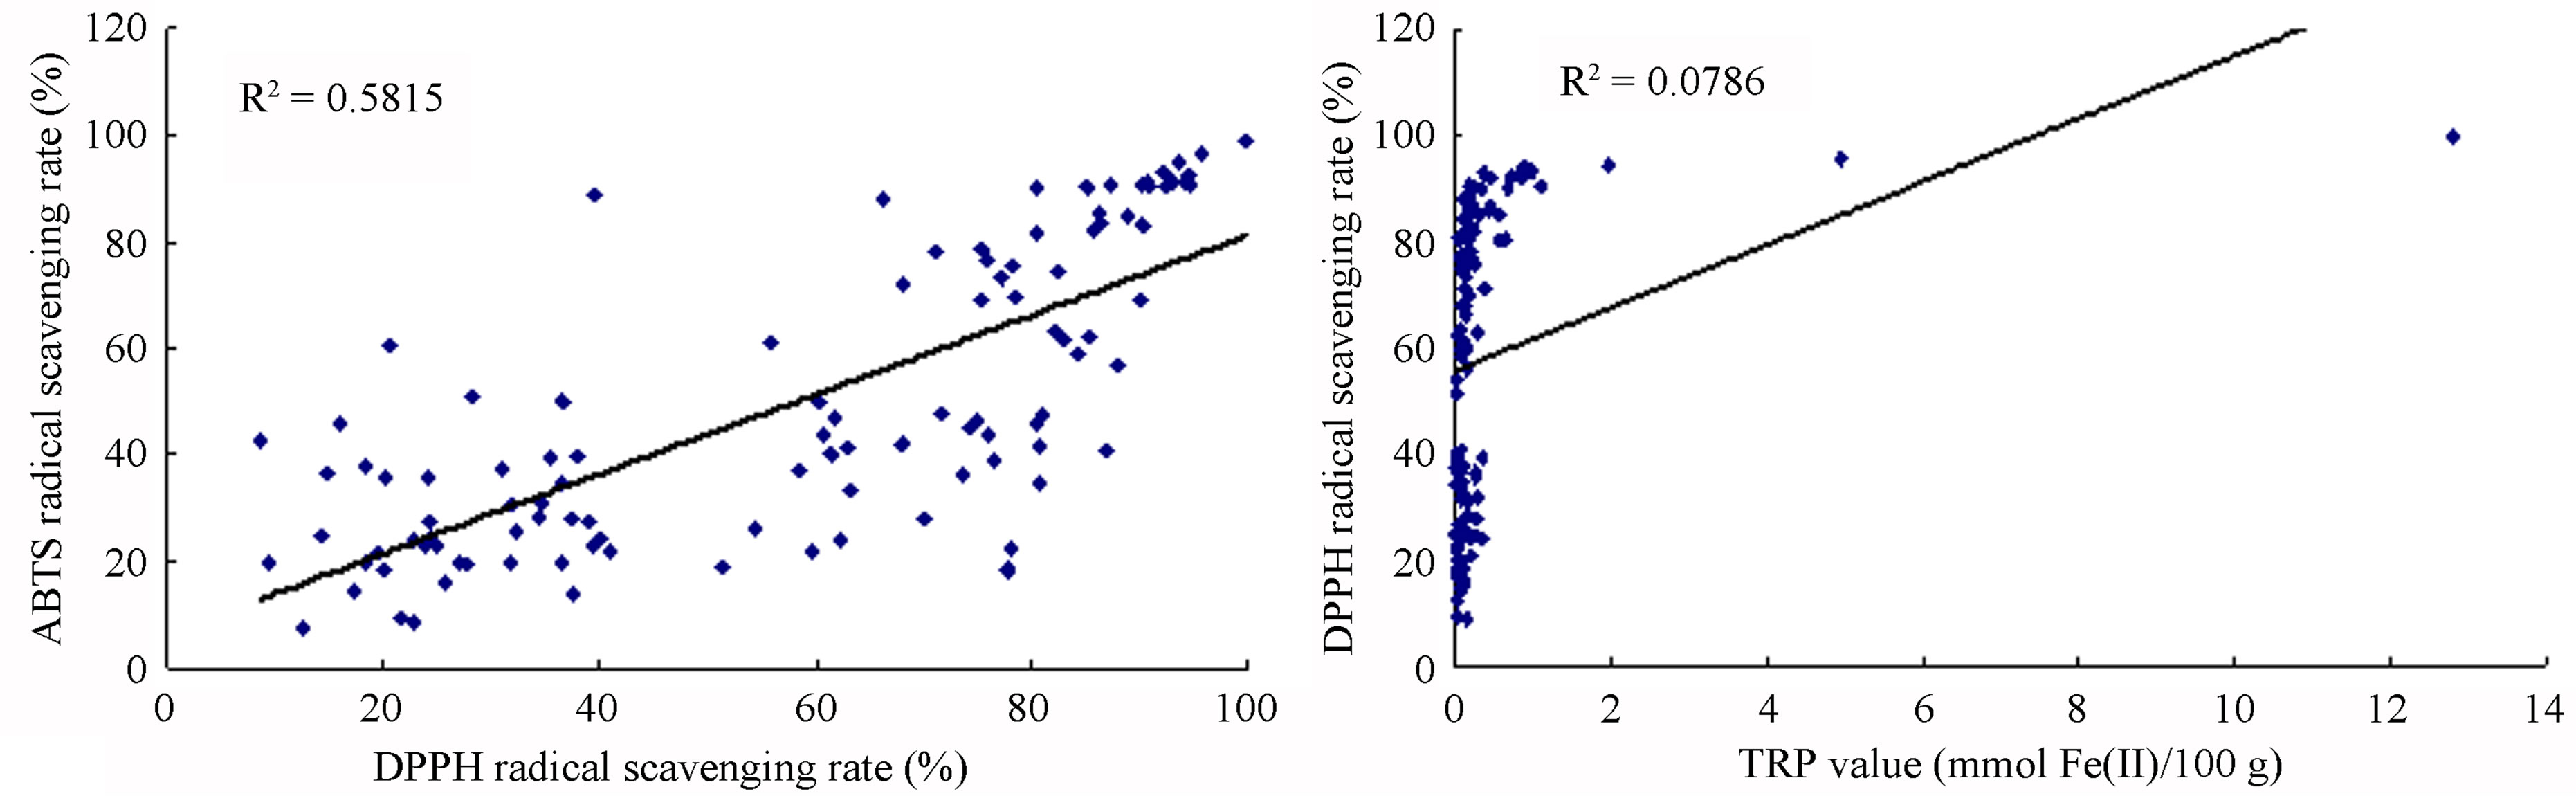
Because multiple reaction characteristics and mechanisms likely are involved, each antioxidant assay procedure provides only an estimate of antioxidant capacity, and is subjective to its conditions and reagents. Therefore, the use of different methods (DPPH, ABTS, FRAP and TRP) helps to fully elucidate a full profile of the antioxidant capacities of many samples. Correlation analysis was used to explore the relationship among the varying antioxidant capacities identified by different evaluation methods for all 110 fruits and vegetables. Among the methods used for quantifying antioxidant activities, the correlation by squared regression coefficient (R2) between DPPH and ABTS, FRAP and TRP was 0.5815, 0.0786 and 0.1569, respectively (Figure 1). The R2 values between ABTS and FRAP and TRP were 0.1228 and 0.2307, respectively, while the R2 value between TRP and FRAP was 0.8861 (Figure 1). Results showed that correlations among different assay methods varied greatly. Among them, we found the R2 values between DPPH and ABTS and that between FRAP and TRP had higher positive correlations, while the R2 values between DPPH and FRAP or TRP and that between ABTS and FRAP or TRP had lower positive correlations. This suggests that different antioxidant evaluation assays, with different mechanisms and reaction characteristics, have great variation when assaying the same sample. Furthermore, if three samples possessing the strongest free-radical scavenging abilities (TS, hawthorn and jujube) were removed, the R2 value of left 107 samples would increase significantly (e.g. the R2 value between DPPH and FRAP would change from 0.0786 to 0.2654). This indicates that the strongest antioxidant samples skewed the relation-
 (a)
(a)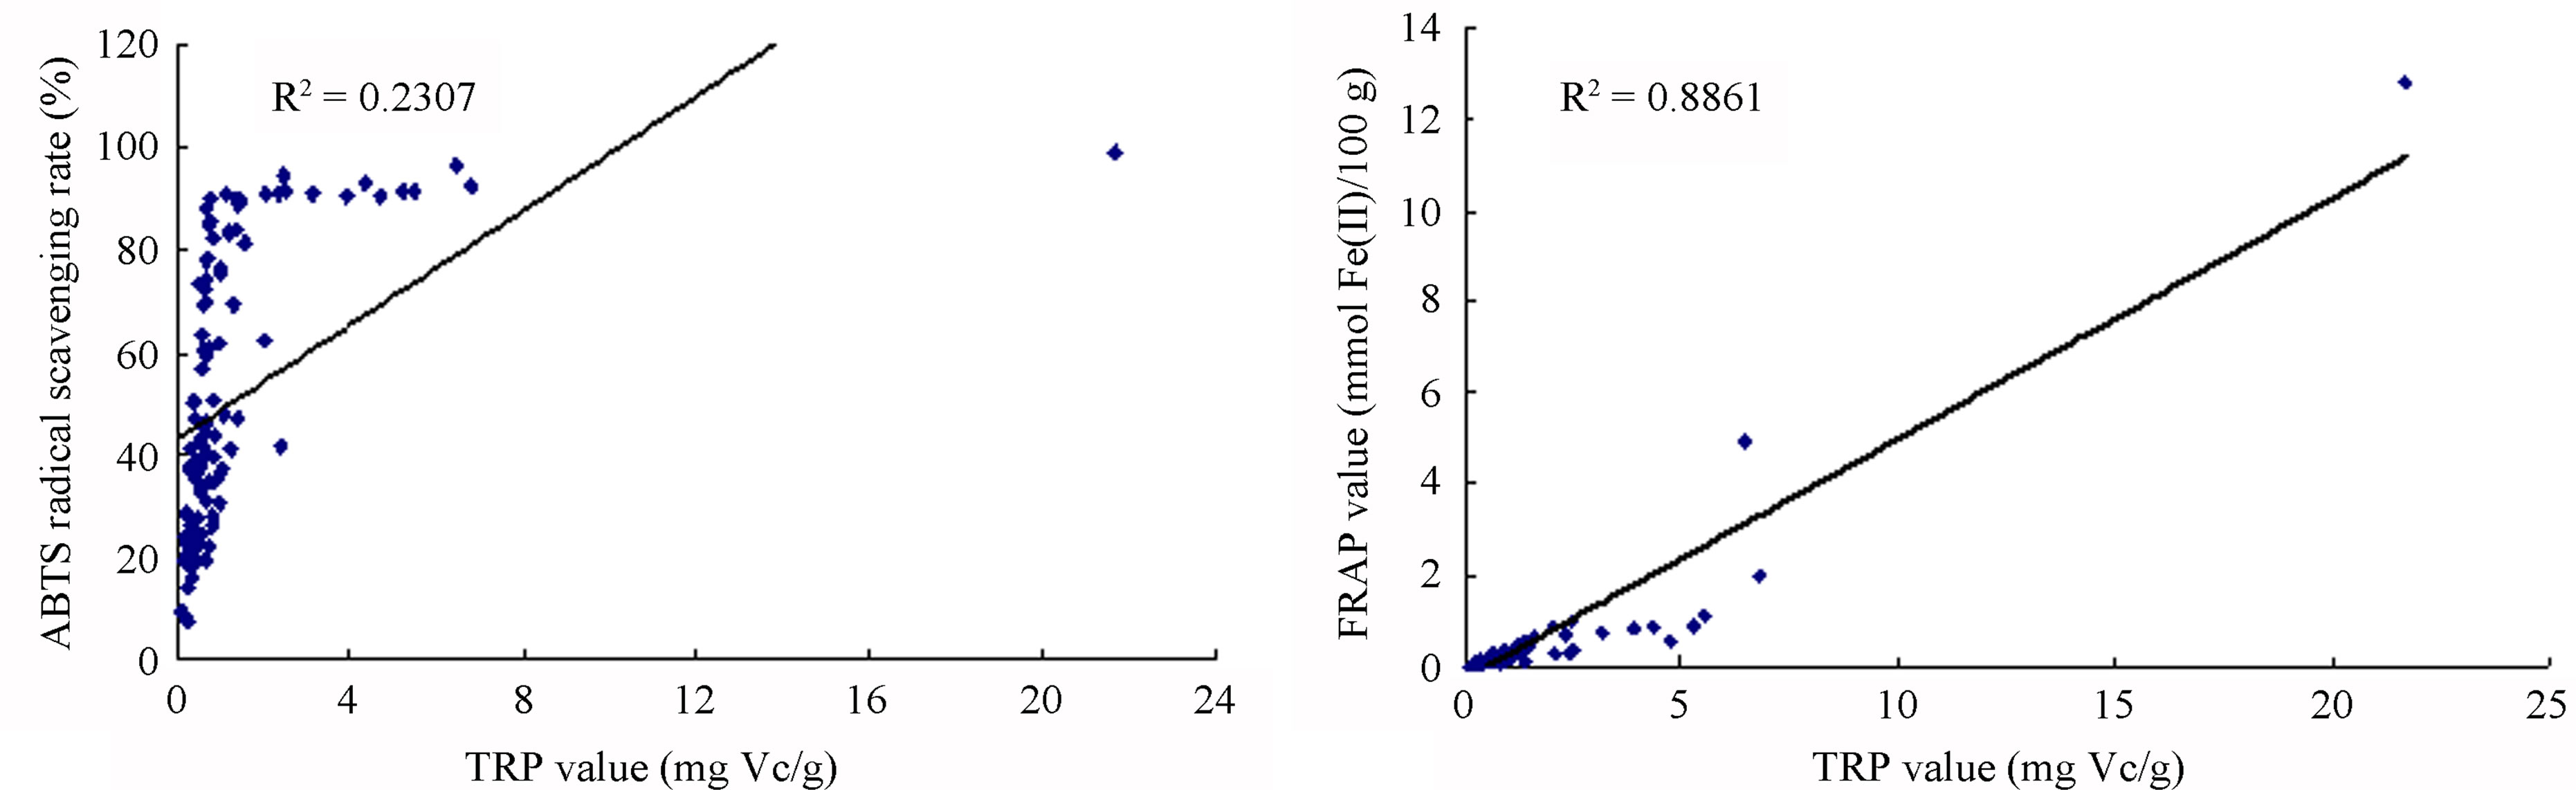 (b)
(b)
Figure 1. Correlation between antioxidant capacities measured by the DPPH, ABTS, FRAP and TRP assays. (a) Correlation between antioxidant capacities measured by DPPH and ABTS assays. (b) Correlation between antioxidant capacities measured by DPPH and FRAP assays. (c) Correlation between antioxidant capacities measured by ABTS and TRP assays. (d) Correlation between antioxidant capacities measured by FRAP and TRP assays.
ships among the antioxidant evaluation methods, and the same conclusion has been obtained by other researchers [3,28].
3.3. Total Phenolic and Flavonoid Content of 110 Fruits and Vegetables
The total phenolic content (TPC) of 110 fruits and vegetables was determined using the Folin-Ciocalteu method, which is a simple and widely used method [3,18]. As shown in Table 2, TPC varied from 0.93 ± 0.10 to 96.37 ± 7.32 mg GAE/g DW, with the difference being 103- fold and the average value being 6.02 mg GAE/g DW for 110 fruits and vegetables. TS (96.37 ± 7.32 mg GAE/g) had the highest TPC value, followed by hawthorn, great burdock, red plum, black plum, lotus root, jujube and cabbage mustard. Grape had the lowest TPC value (0.93 ± 0.10 mg GAE/g) among the tested fruits and vegetables. Most of the highest-antioxidant fruits and vegetables also had the highest TPC values, such as TS, hawthorn, black plum, red plum, lotus root and jujube. However, pomegranate (4.79 ± 0.15 mg GAE/g) and persimmon (5.59 ± 0.18 mg GAE/g) had only medium TPC values; their potent antioxidant capacities may be due to other types of antioxidant substances.
Total flavonoid content (TFC) of 110 fruits and vegetables was determined using the reported method of Zhishen et al. [19], with minor modifications. As shown in Table 2, TFC varied from 0.19 ± 0.04 to 24.34 ± 1.39 mg RE/g DW, and the mean value of 110 fruits and vegetables was 1.866 mg RE/g DW. TS (24.34 ± 1.39 mg RE/g DW) had the highest TFC value, followed by hawthorn (15.71 ± 0.26 mg RE/g DW) and lotus root (8.53 ± 0.36 mg RE/g DW). Chinese cabbage had the lowest TFC value (0.19 ± 0.04 mg RE/g DW) among the tested fruits and vegetables. Following TS, hawthorn and lotus root, the eight fruits and vegetables with the highest TFC values were peach, black plum, great burdock, jujube, star fruit, blueberry, pomegranate and red plum. However, despite their lower antioxidant potential, fennel, Houttuynia cordata, coriander and swamp cabbage actually had higher TFC values (Table 2). This illustrates that there is not always a positive correlation between antioxidant potential and flavonoid content.
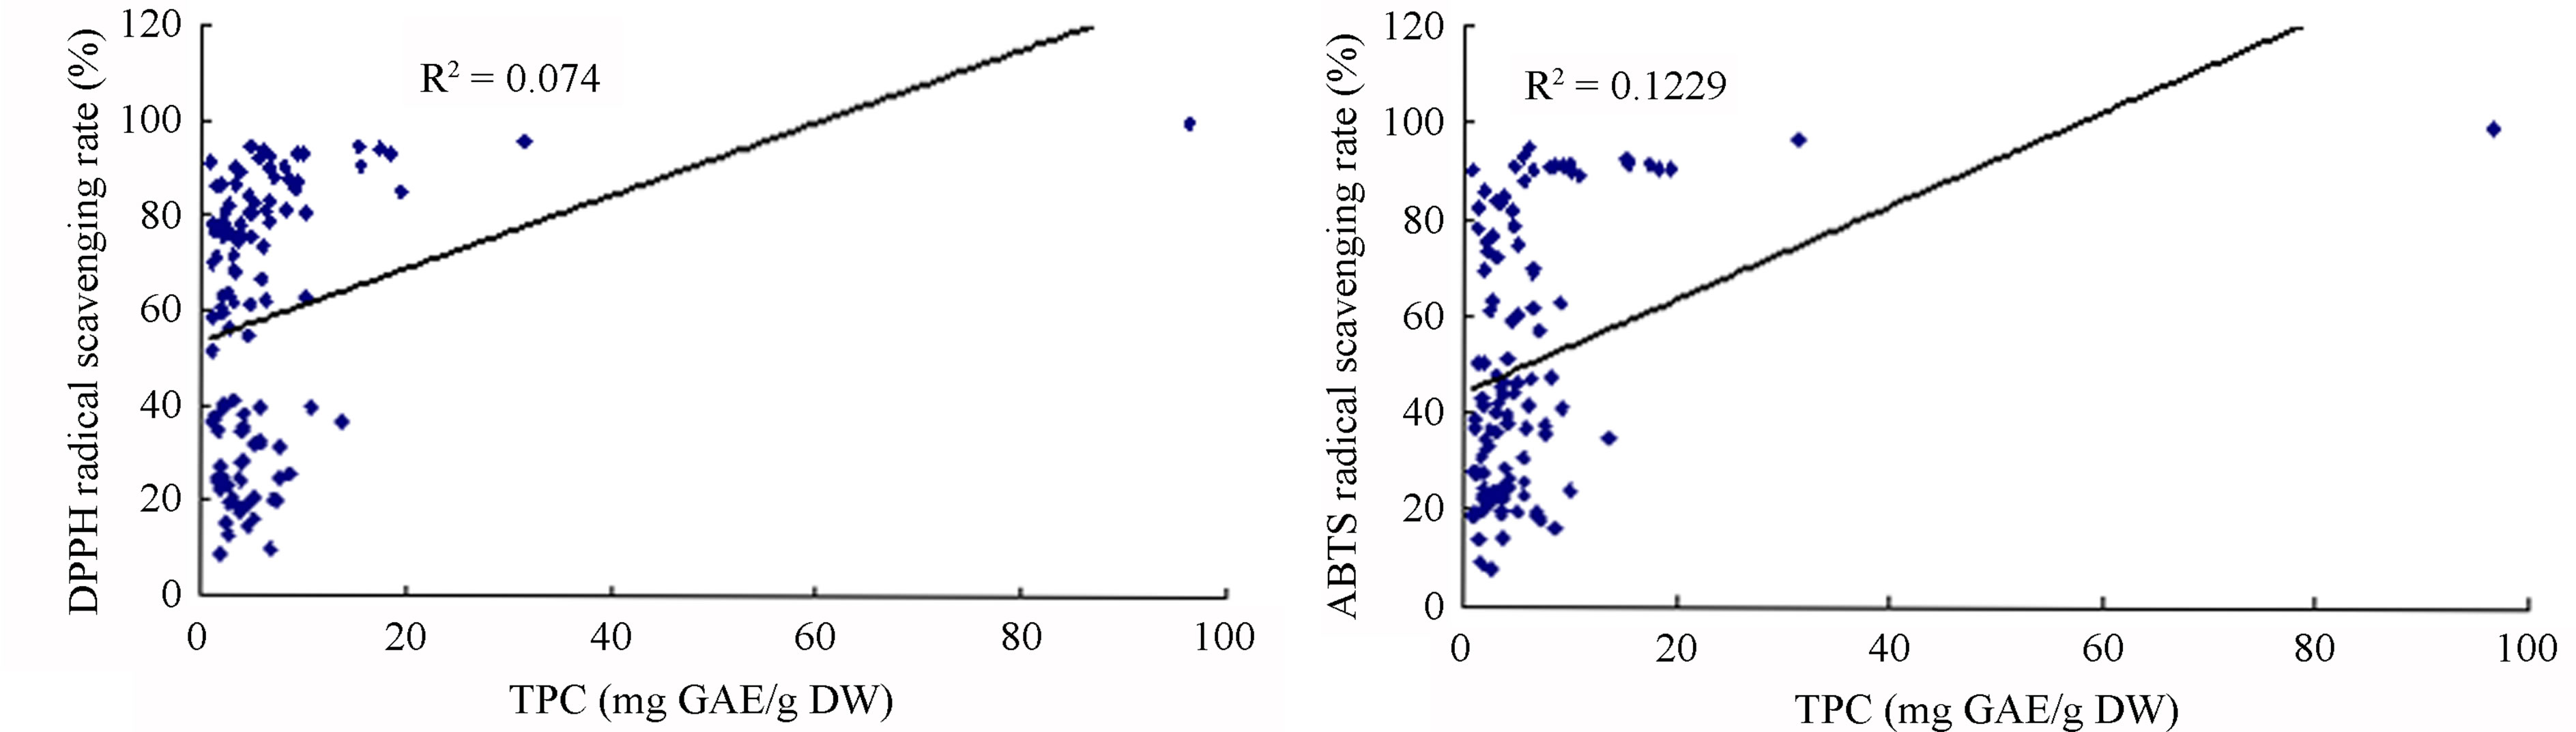
3.4. Correlation between Antioxidant Capacities and TPC and TFC
A great deal of research has shown a significant relationship between antioxidant activity and TPC in selected herbs, vegetables and fruits. Phenolic compounds have been found to make a major contribution to antioxidant activity [7,28,29]. However, results were based on statistical analysis of small samples. The current study systematically investigated antioxidant capacity and TPC of 110 fruits and vegetables. Statistical results of such a large sample revealed that correlation between antioxidant activity and TPC by different systems of assay showed large variations, with R2 values ranging from 0.0740 to 0.9026 (Figure 2). Correlations between TPC and antioxidant activities as shown by FRAP and TRP assays are much higher than those shown by DPPH and ABTS assays (Table 2). This means that phenolic compounds are the main antioxidant components of fruits and vegetables identified by the FRAP and TRP systems of assay. Correlations between antioxidant capacity and TFC in 110 fruits and vegetables are in agreement with those of TPC (R2 values ranging from 0.1391 to 0.8186, data not shown). We found some fruits and vegetables had higher TFC but lower antioxidant activity (Tables 1 and 2). This conclusion is similar to others’ research [30, 31]. Even so, we found phenolic and flavonoid compounds had a decisive influence on antioxidant potency in most of the fruits and vegetables tested, which agrees with other previous reports [9,13,18].
3.5. Vitamin C Content and Its Relationship with Antioxidant Activity
Vitamin C content in 110 fruits and vegetables fell into a very wide range, between 1.13 and 345.78 mg vitamin C/100g FW (Table 2). Correlation analysis between vitamin C content and antioxidant activity was conducted for the purpose of investigating contribution of vitamin C to antioxidant potential. We found the correlation coefficients between vitamin C content and antioxidant capacity of the 110 samples were very low as measured by all four assays (R2 values ranging from 0.0127 to 0.0726, data not shown). The correlation between vitamin C content and FRAP value was the lowest, but the other three correlations were not much higher. This suggests that vitamin C has only a weak contribution, compared with those of TPC and TFC, to antioxidant capacity in most of the fruits and vegetables tested. In recent research on this problem, some authors have reported a positive correlation between vitamin C content and antioxidant activity [31], while others have found no correlation [32]. We think vitamin C content plays a more important role in nutrition than in the antioxidant activity of fruits and vegetables. However, in some fruits and vegetables, vitamin C content might play a relatively important role in antioxidant power [13,33].
4. Conclusion
Antioxidant capacities of 110 fruits and vegetables displayed a very large range, and phenolic and flavonoid content, rather than vitamin C content, played a key role in antioxidant potential. Comparative assessments using four antioxidant evaluation methods strongly suggest that
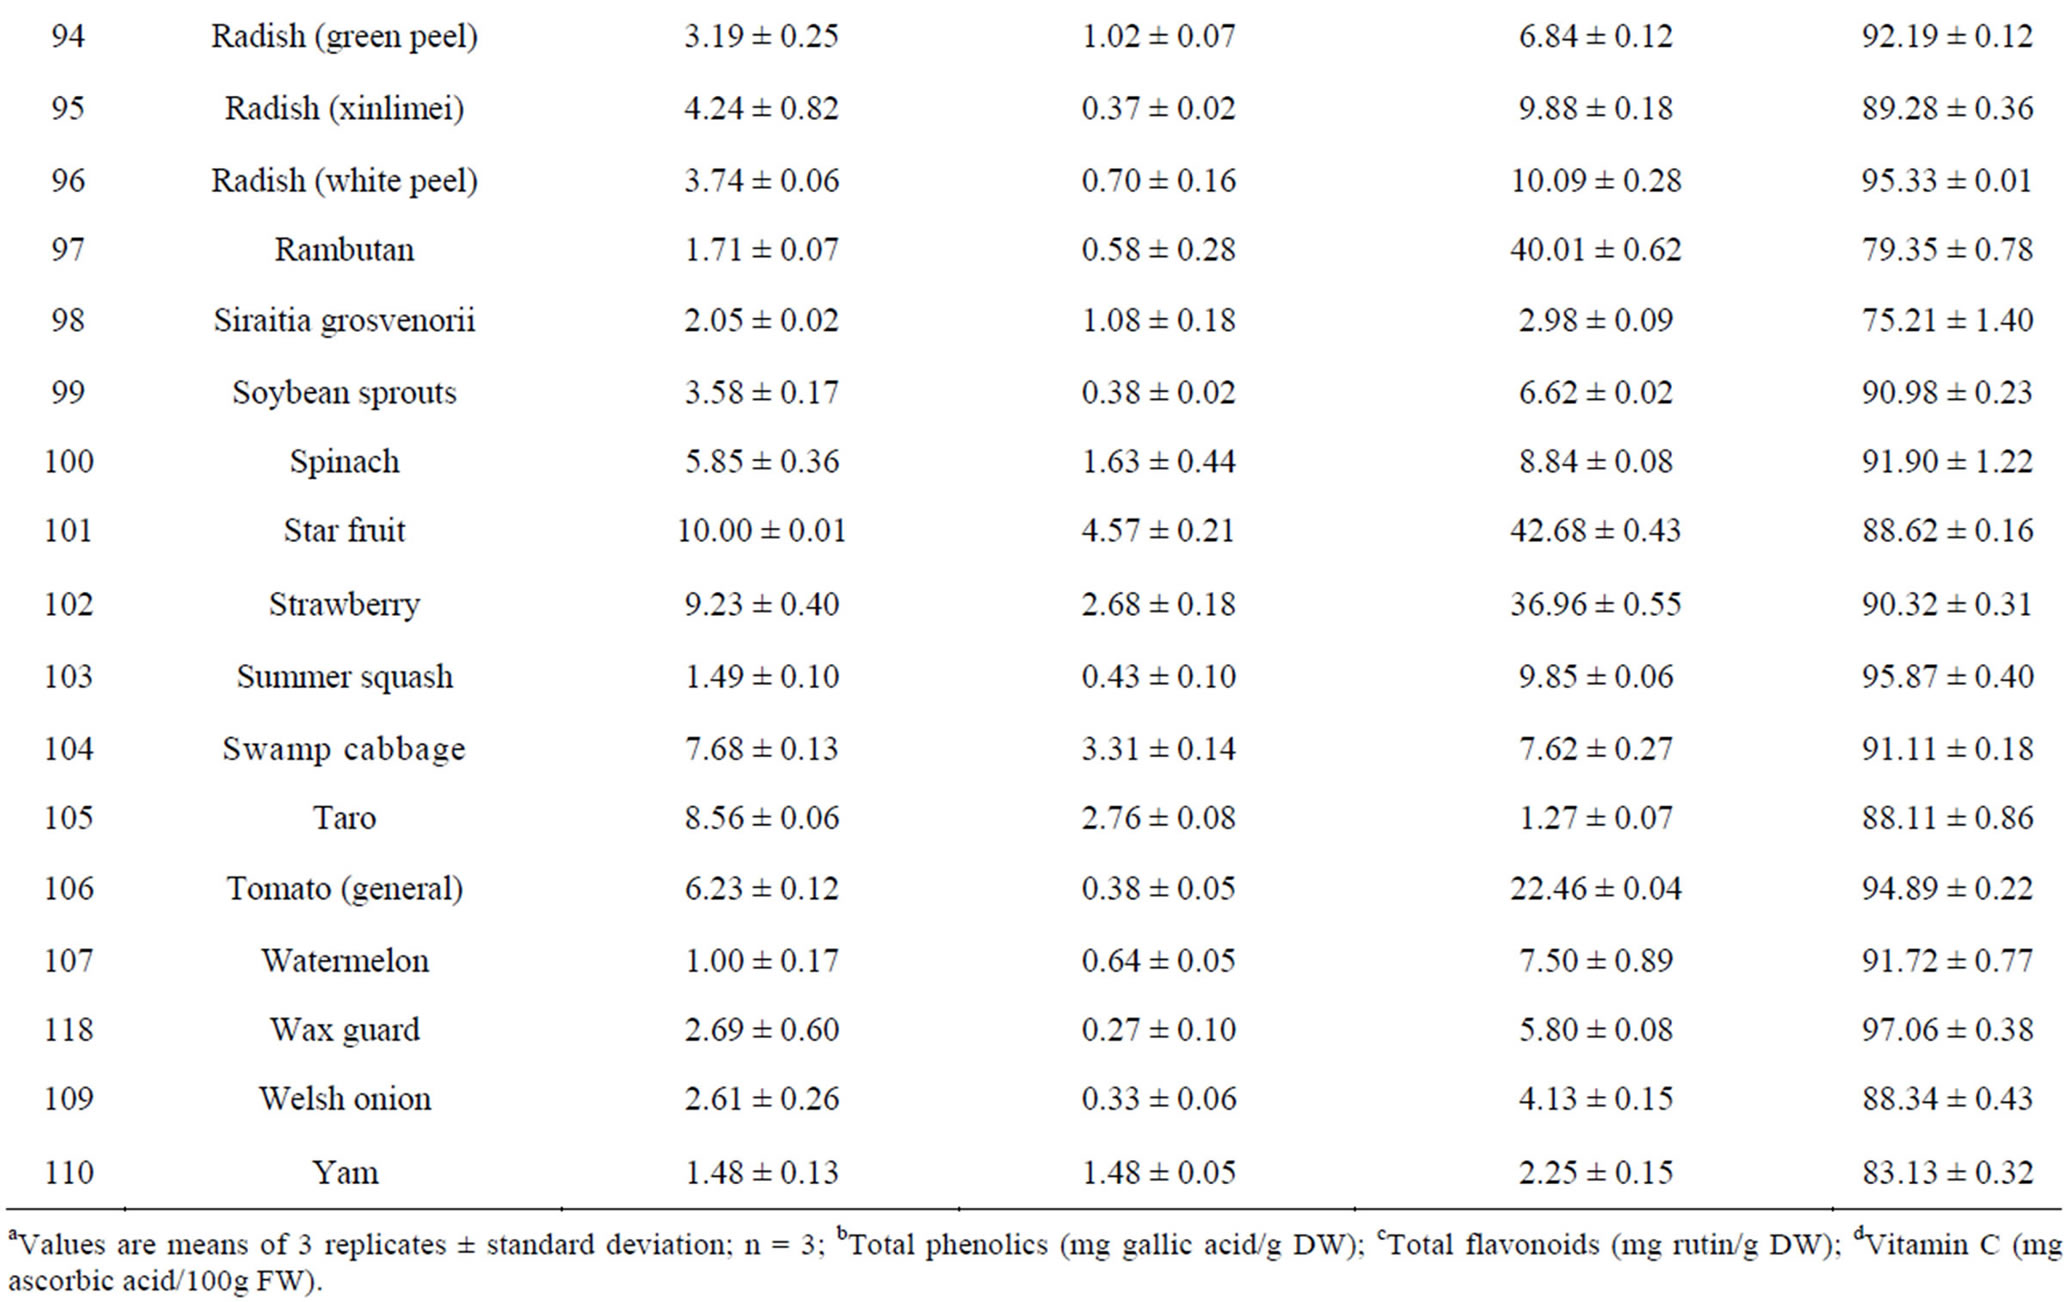
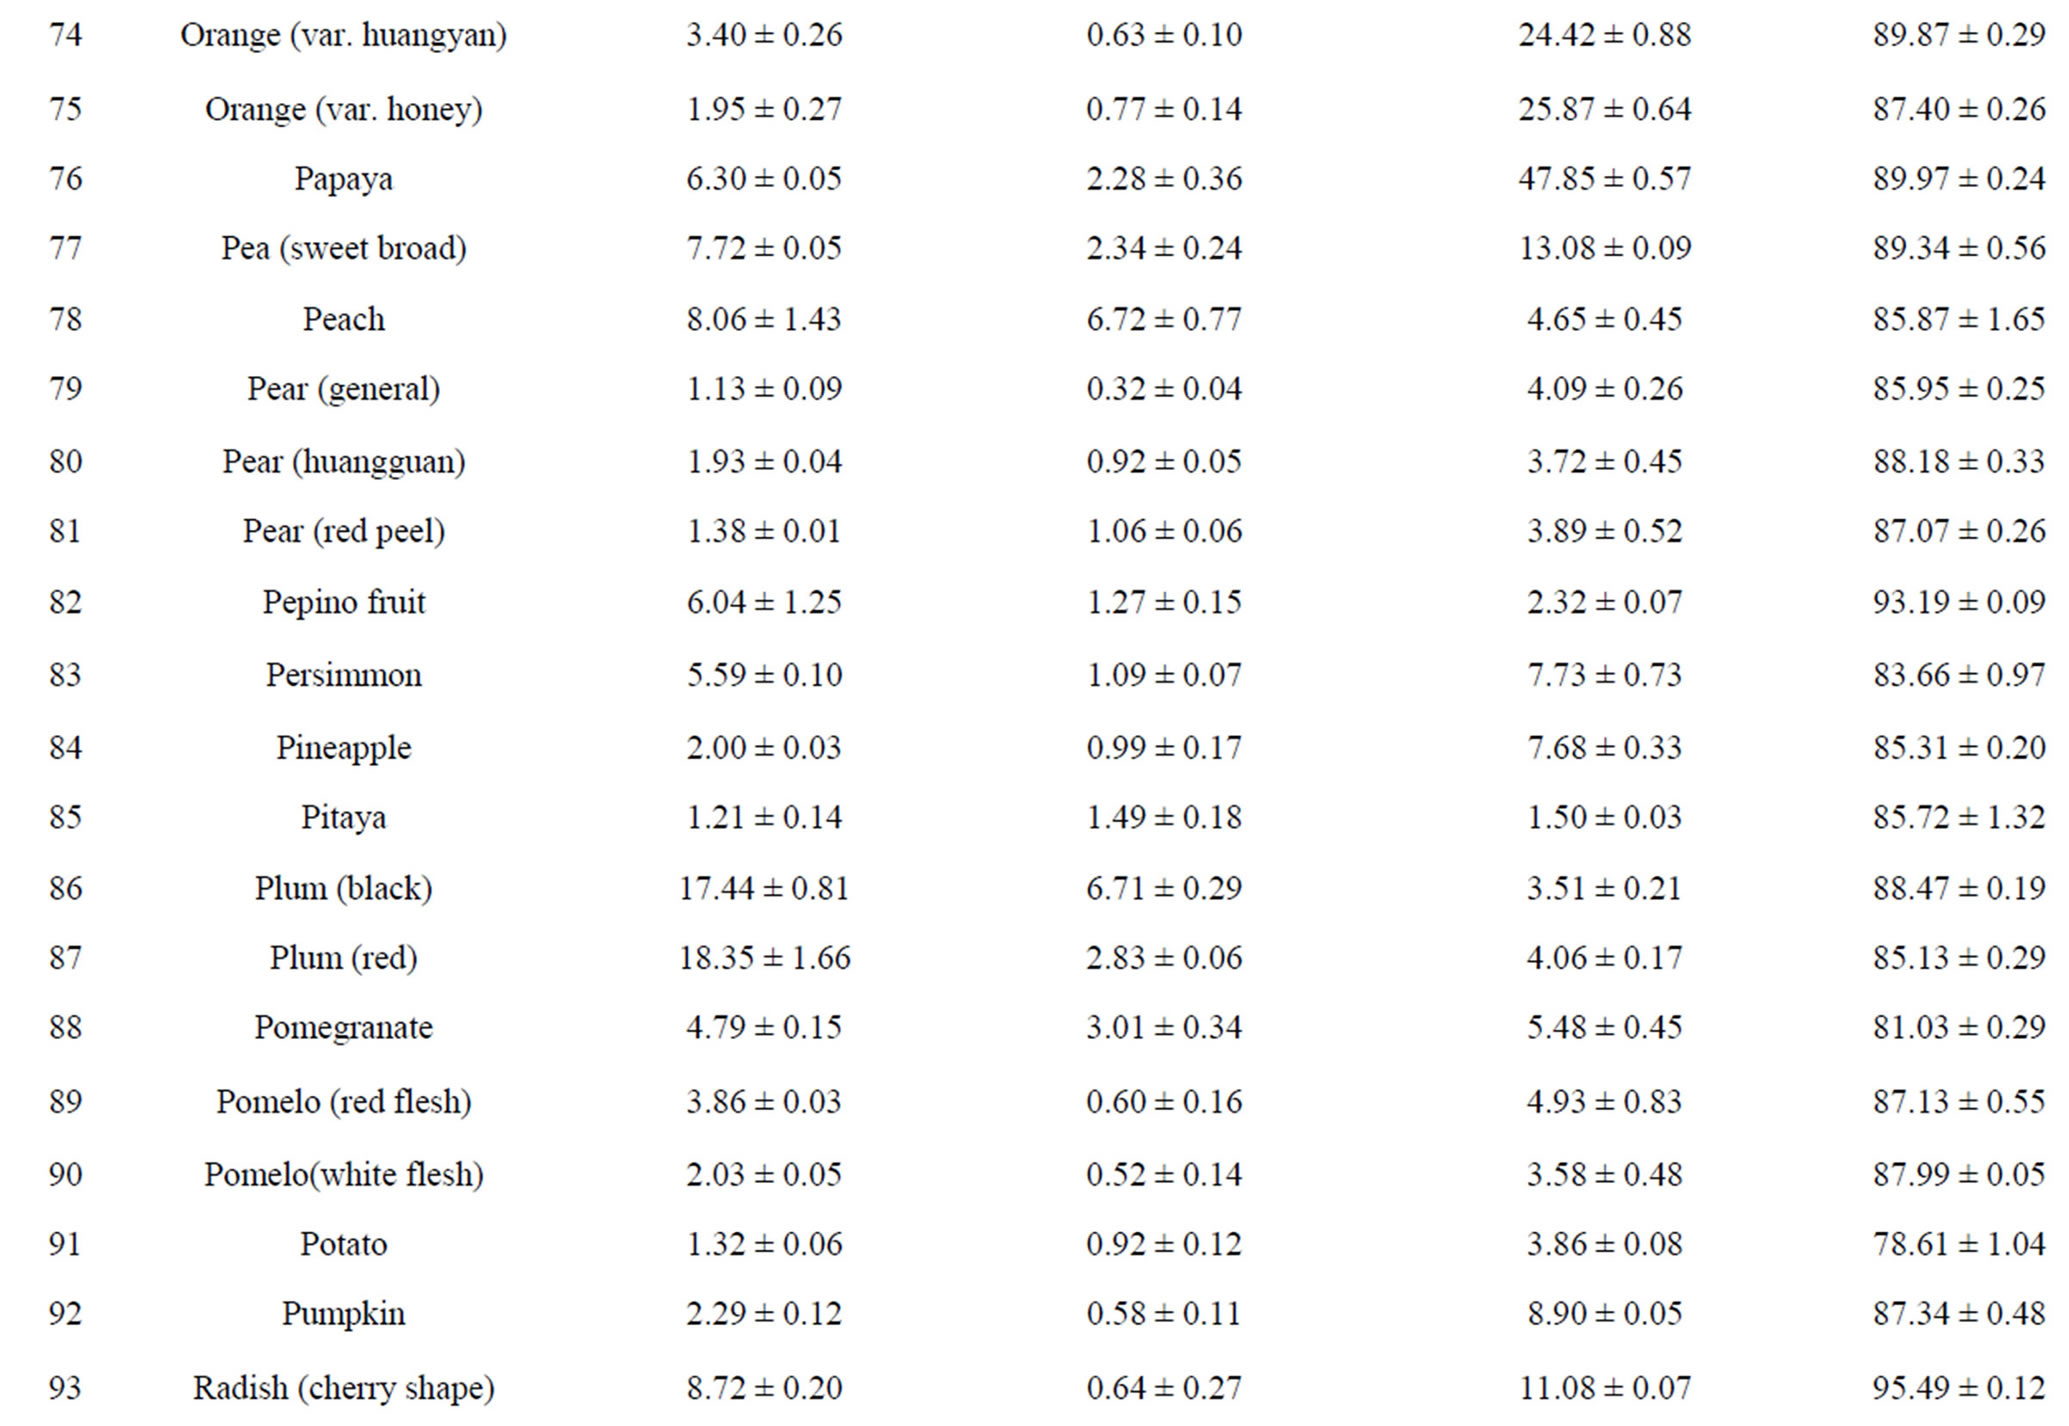
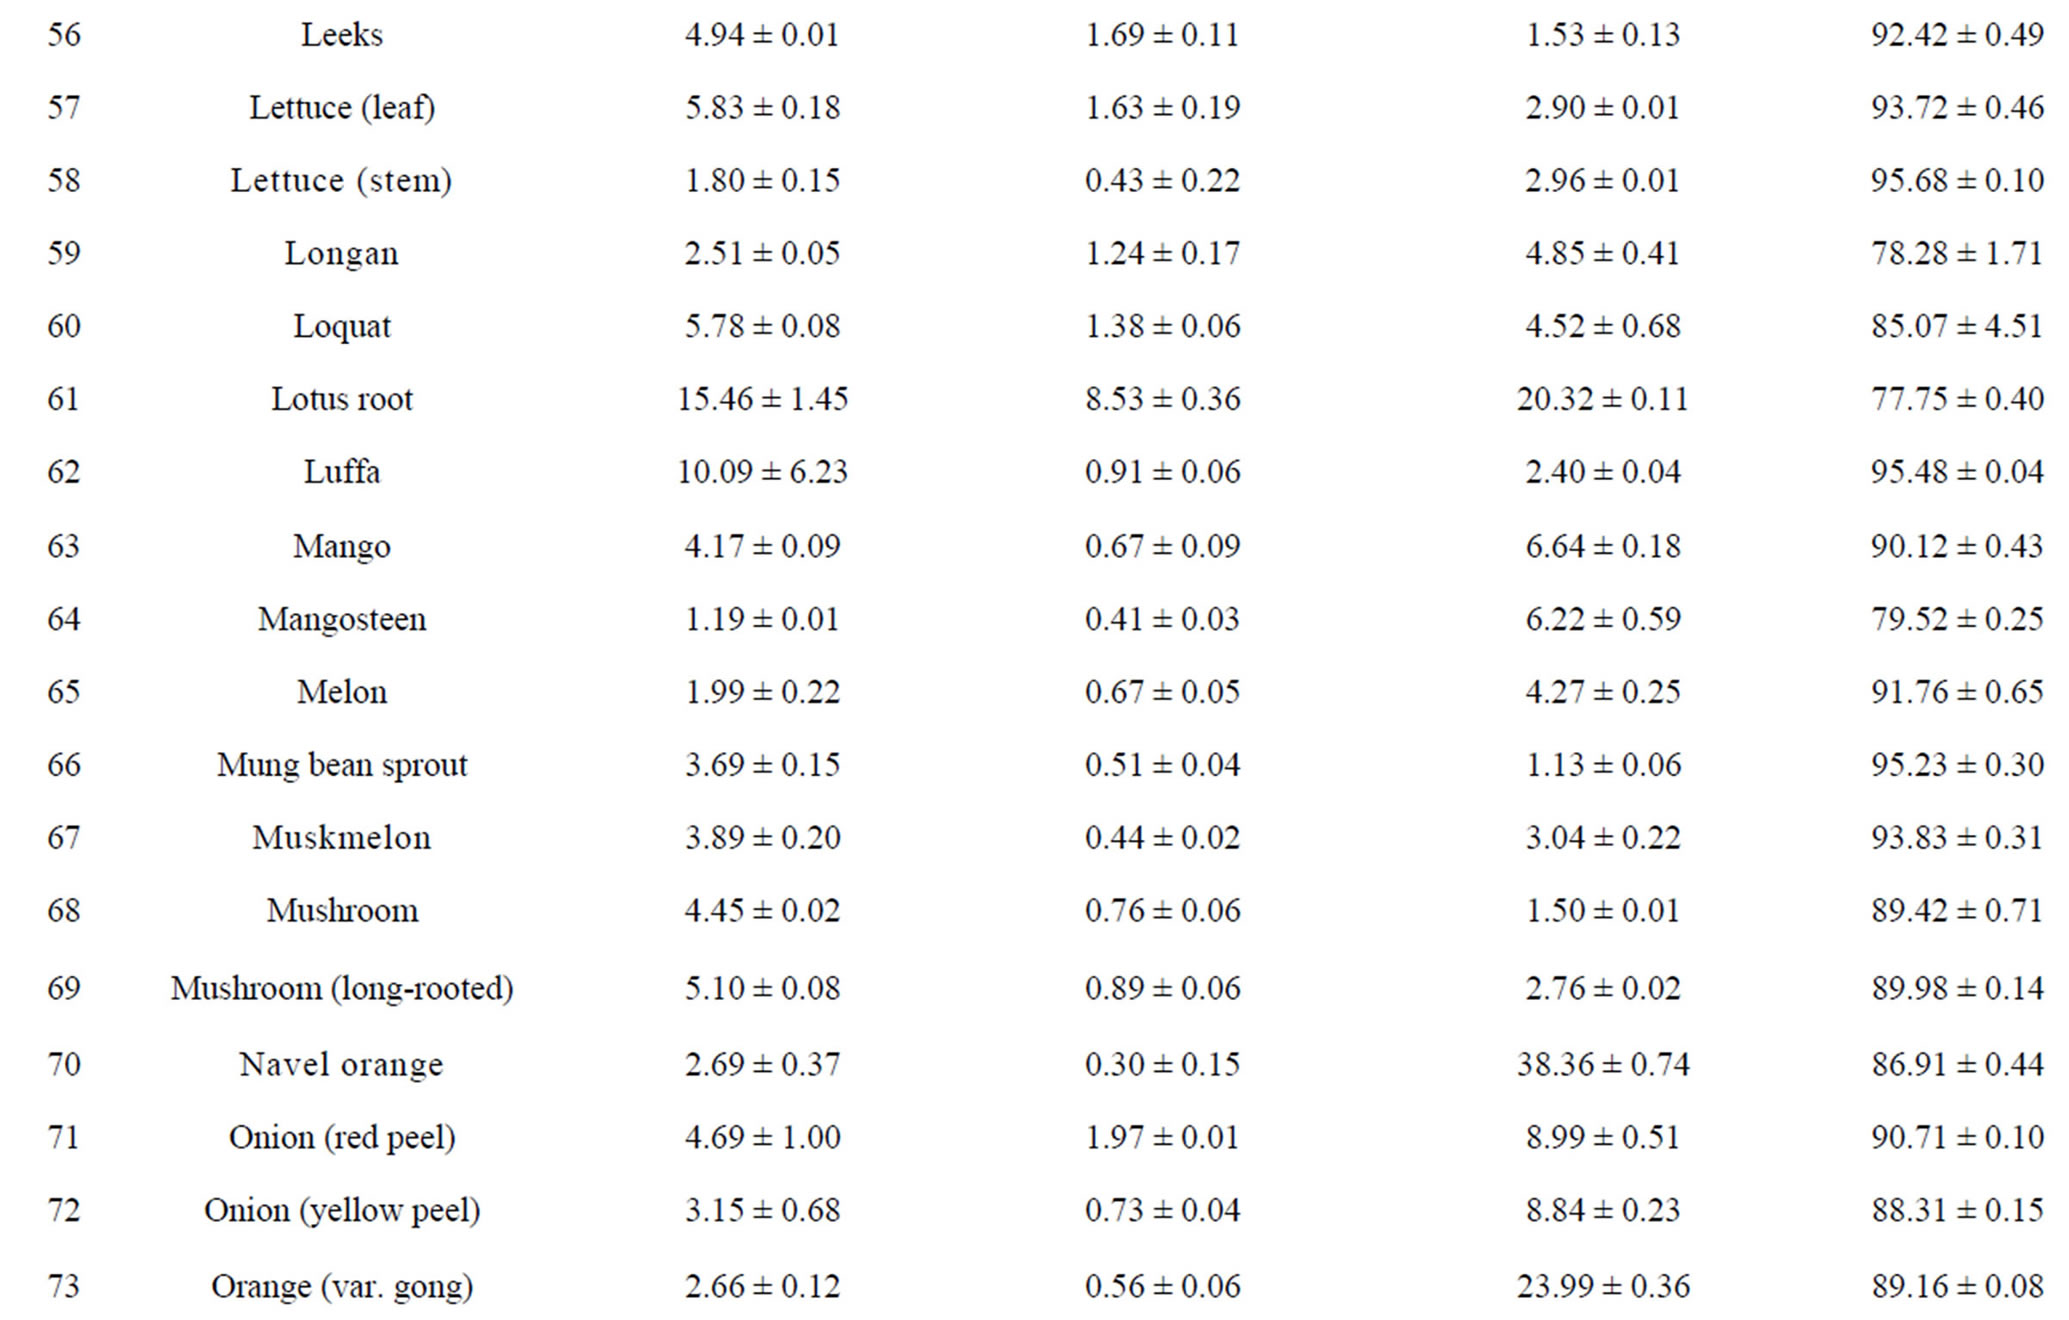
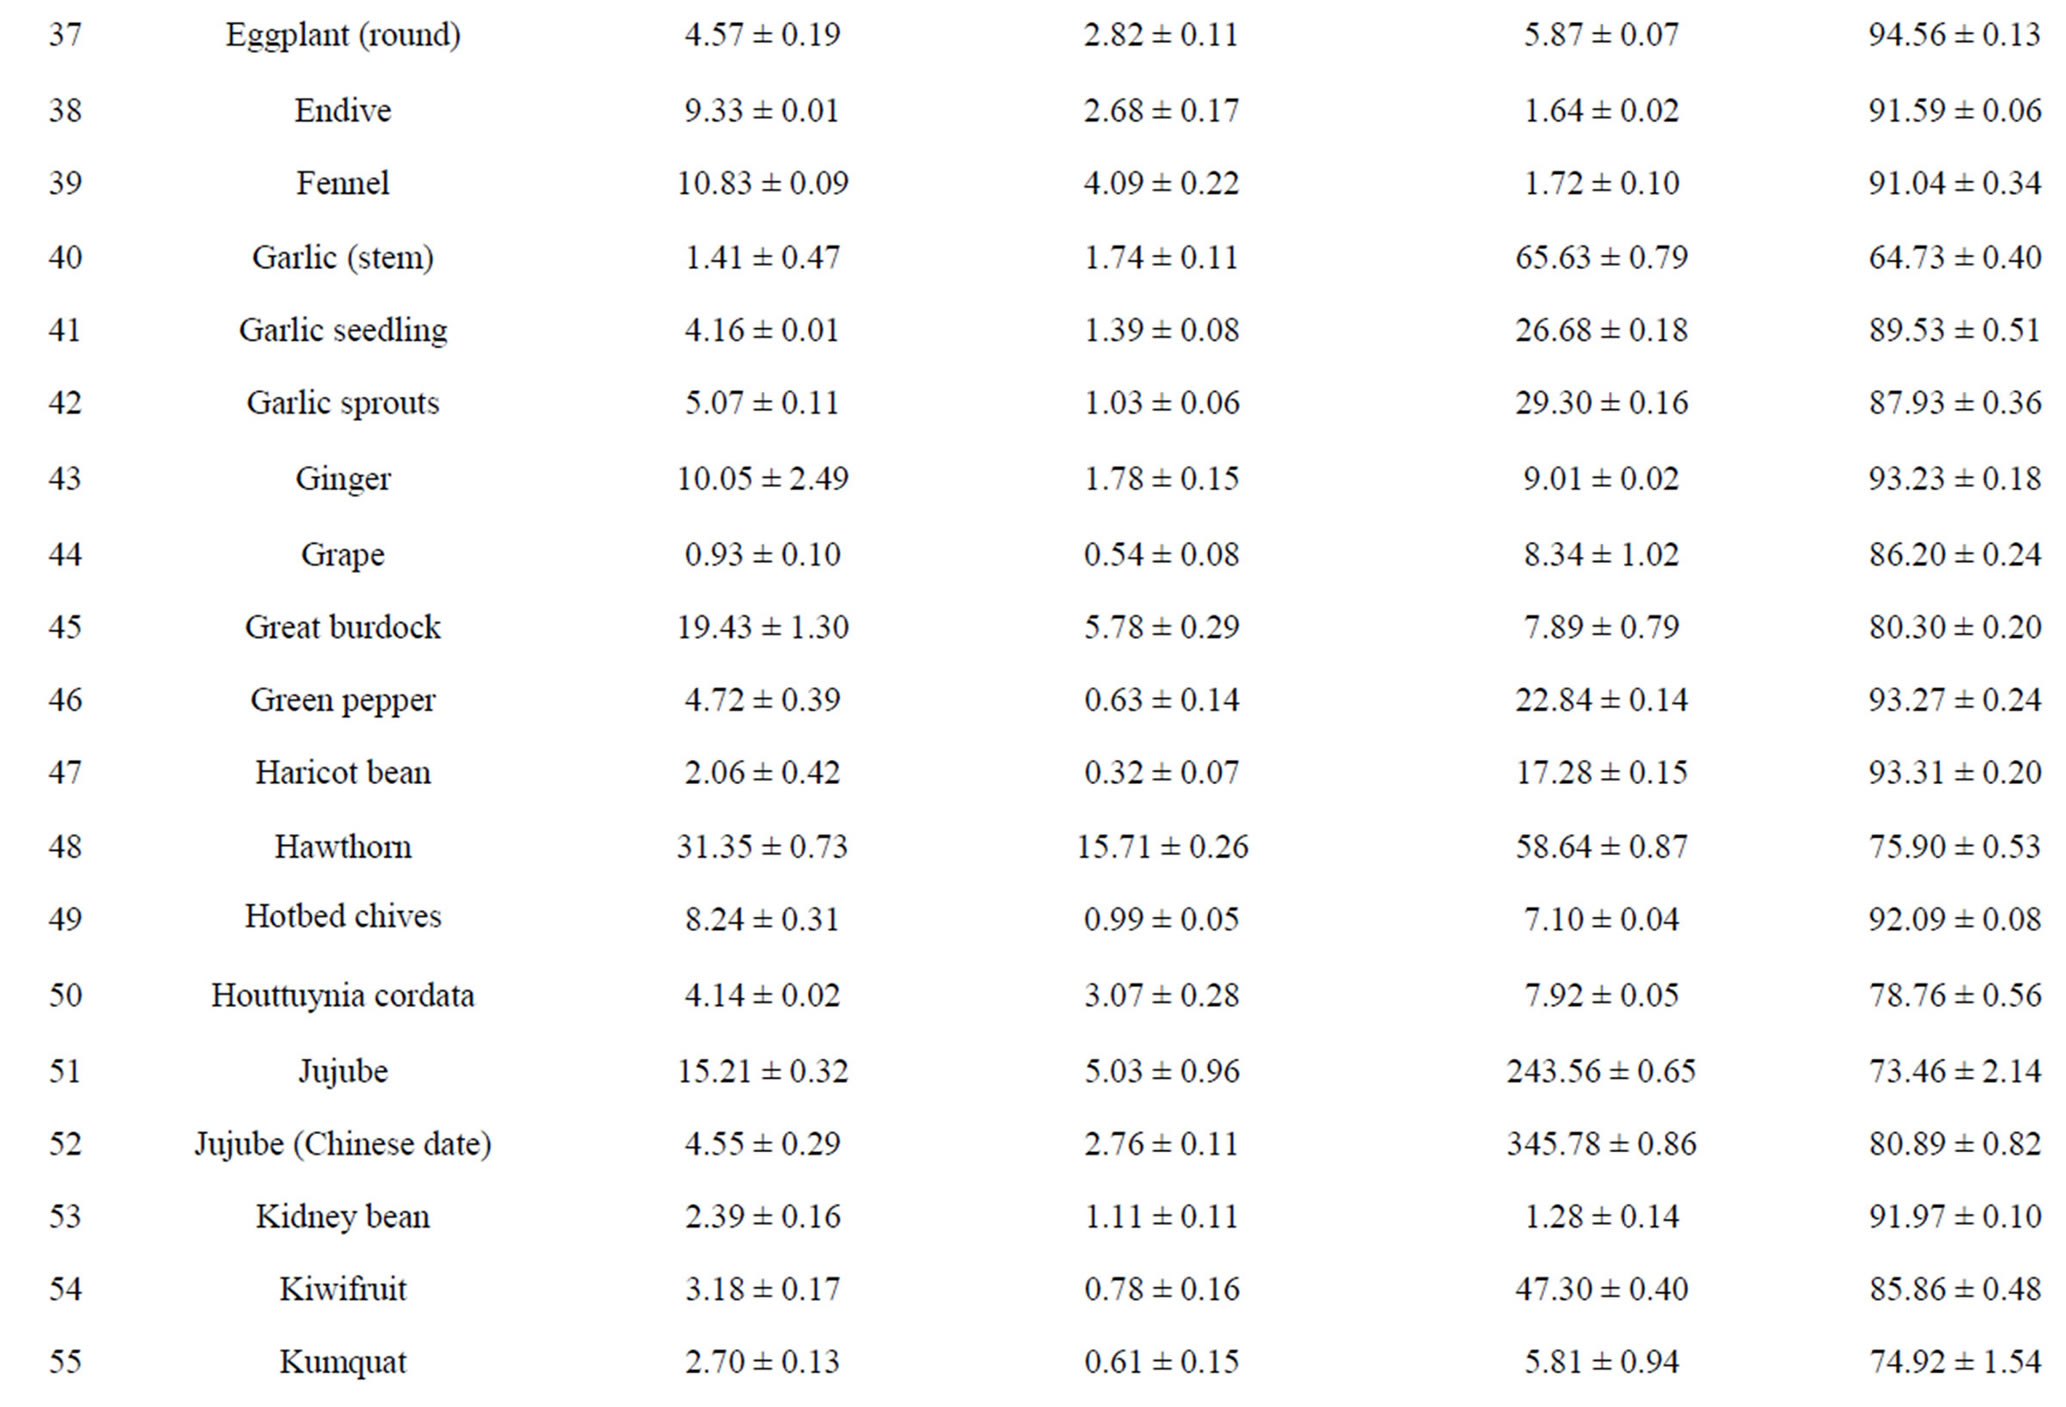
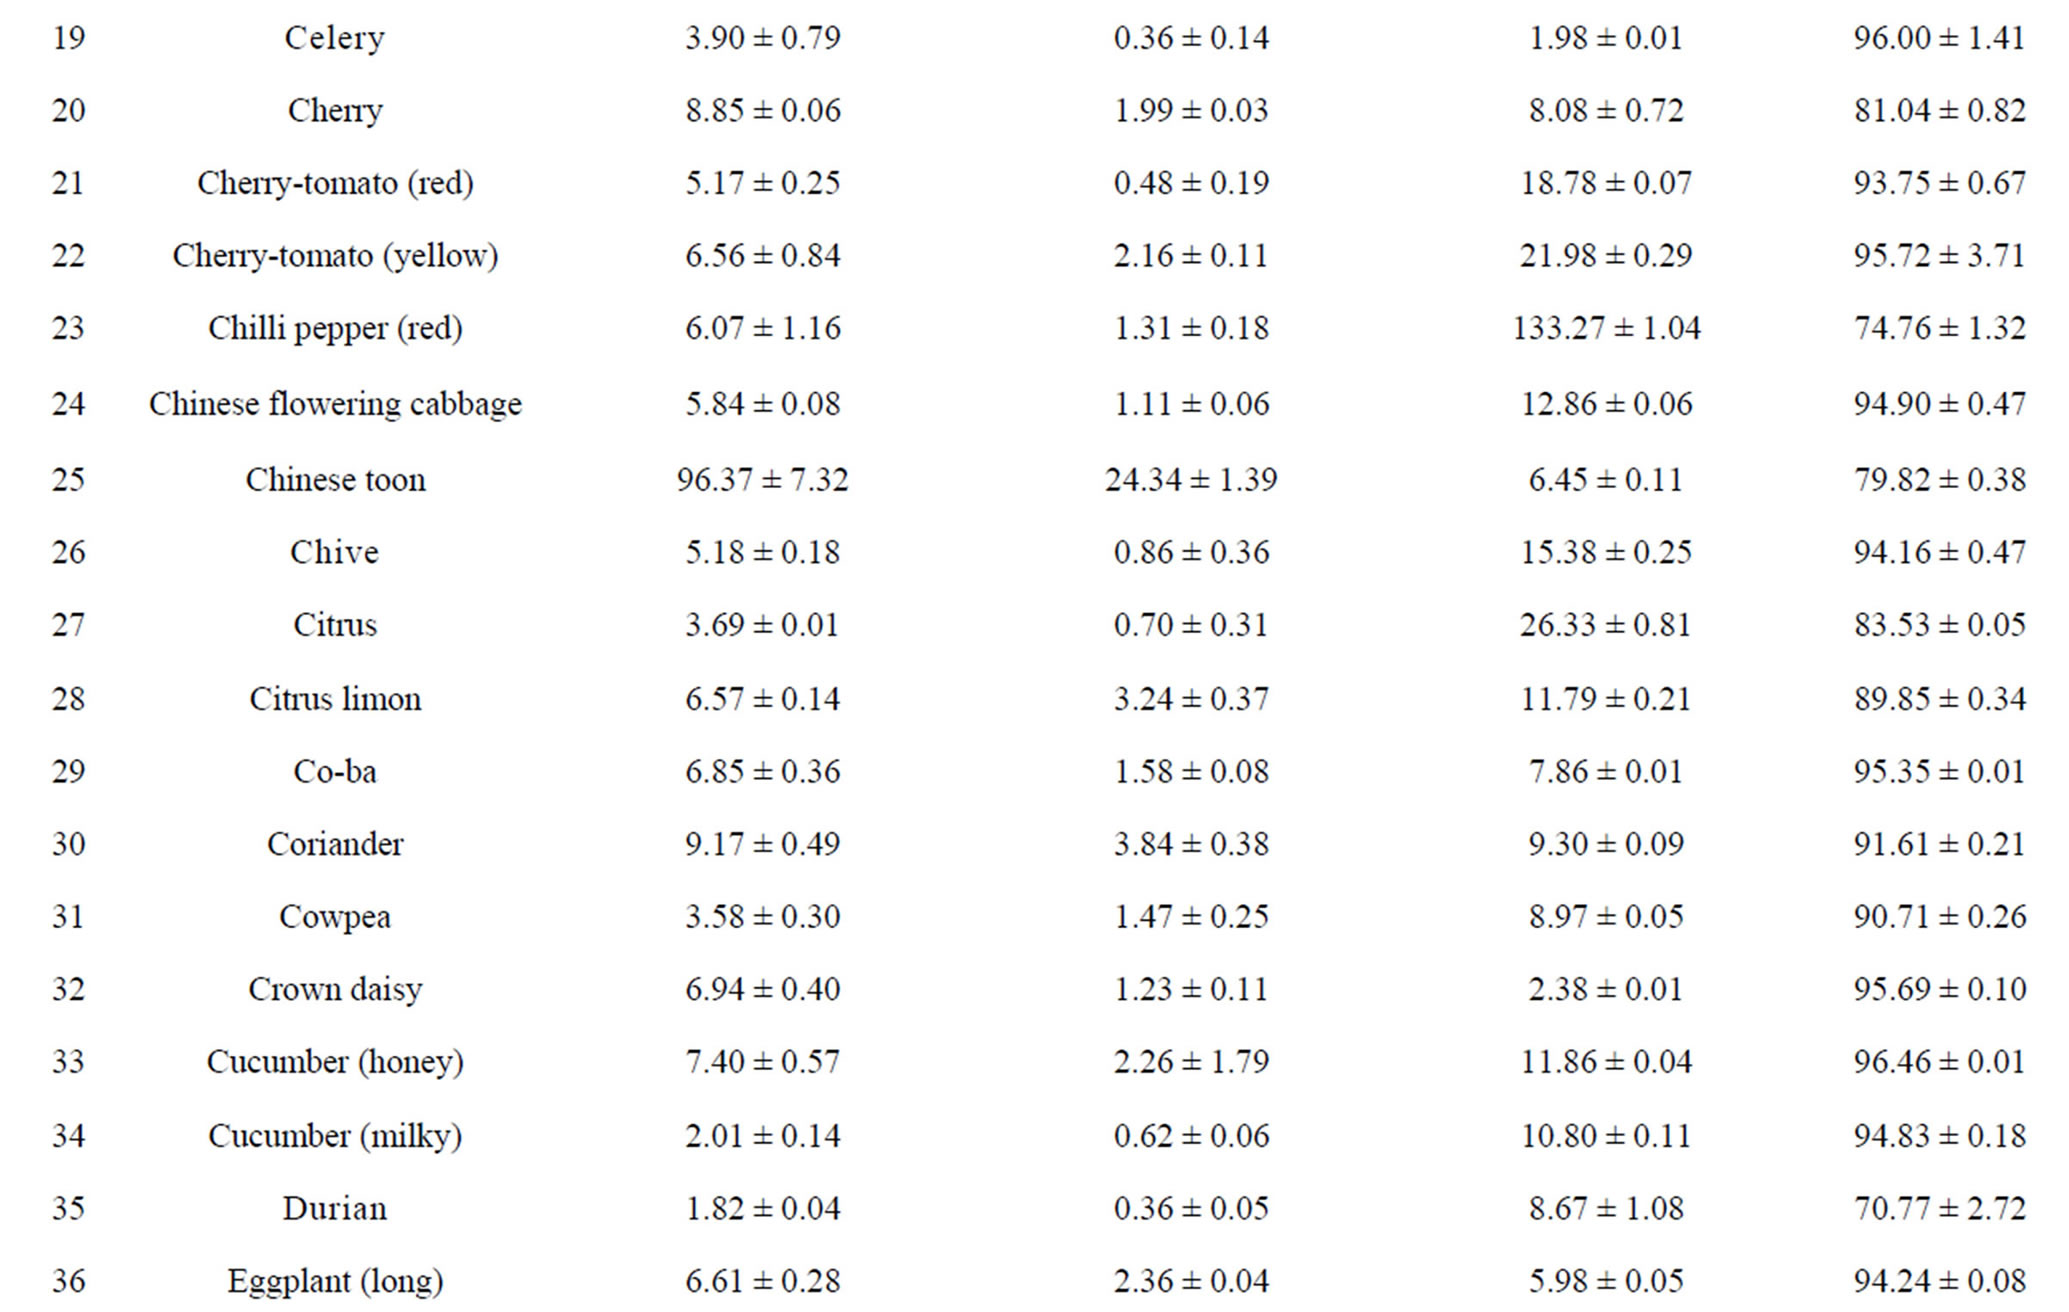
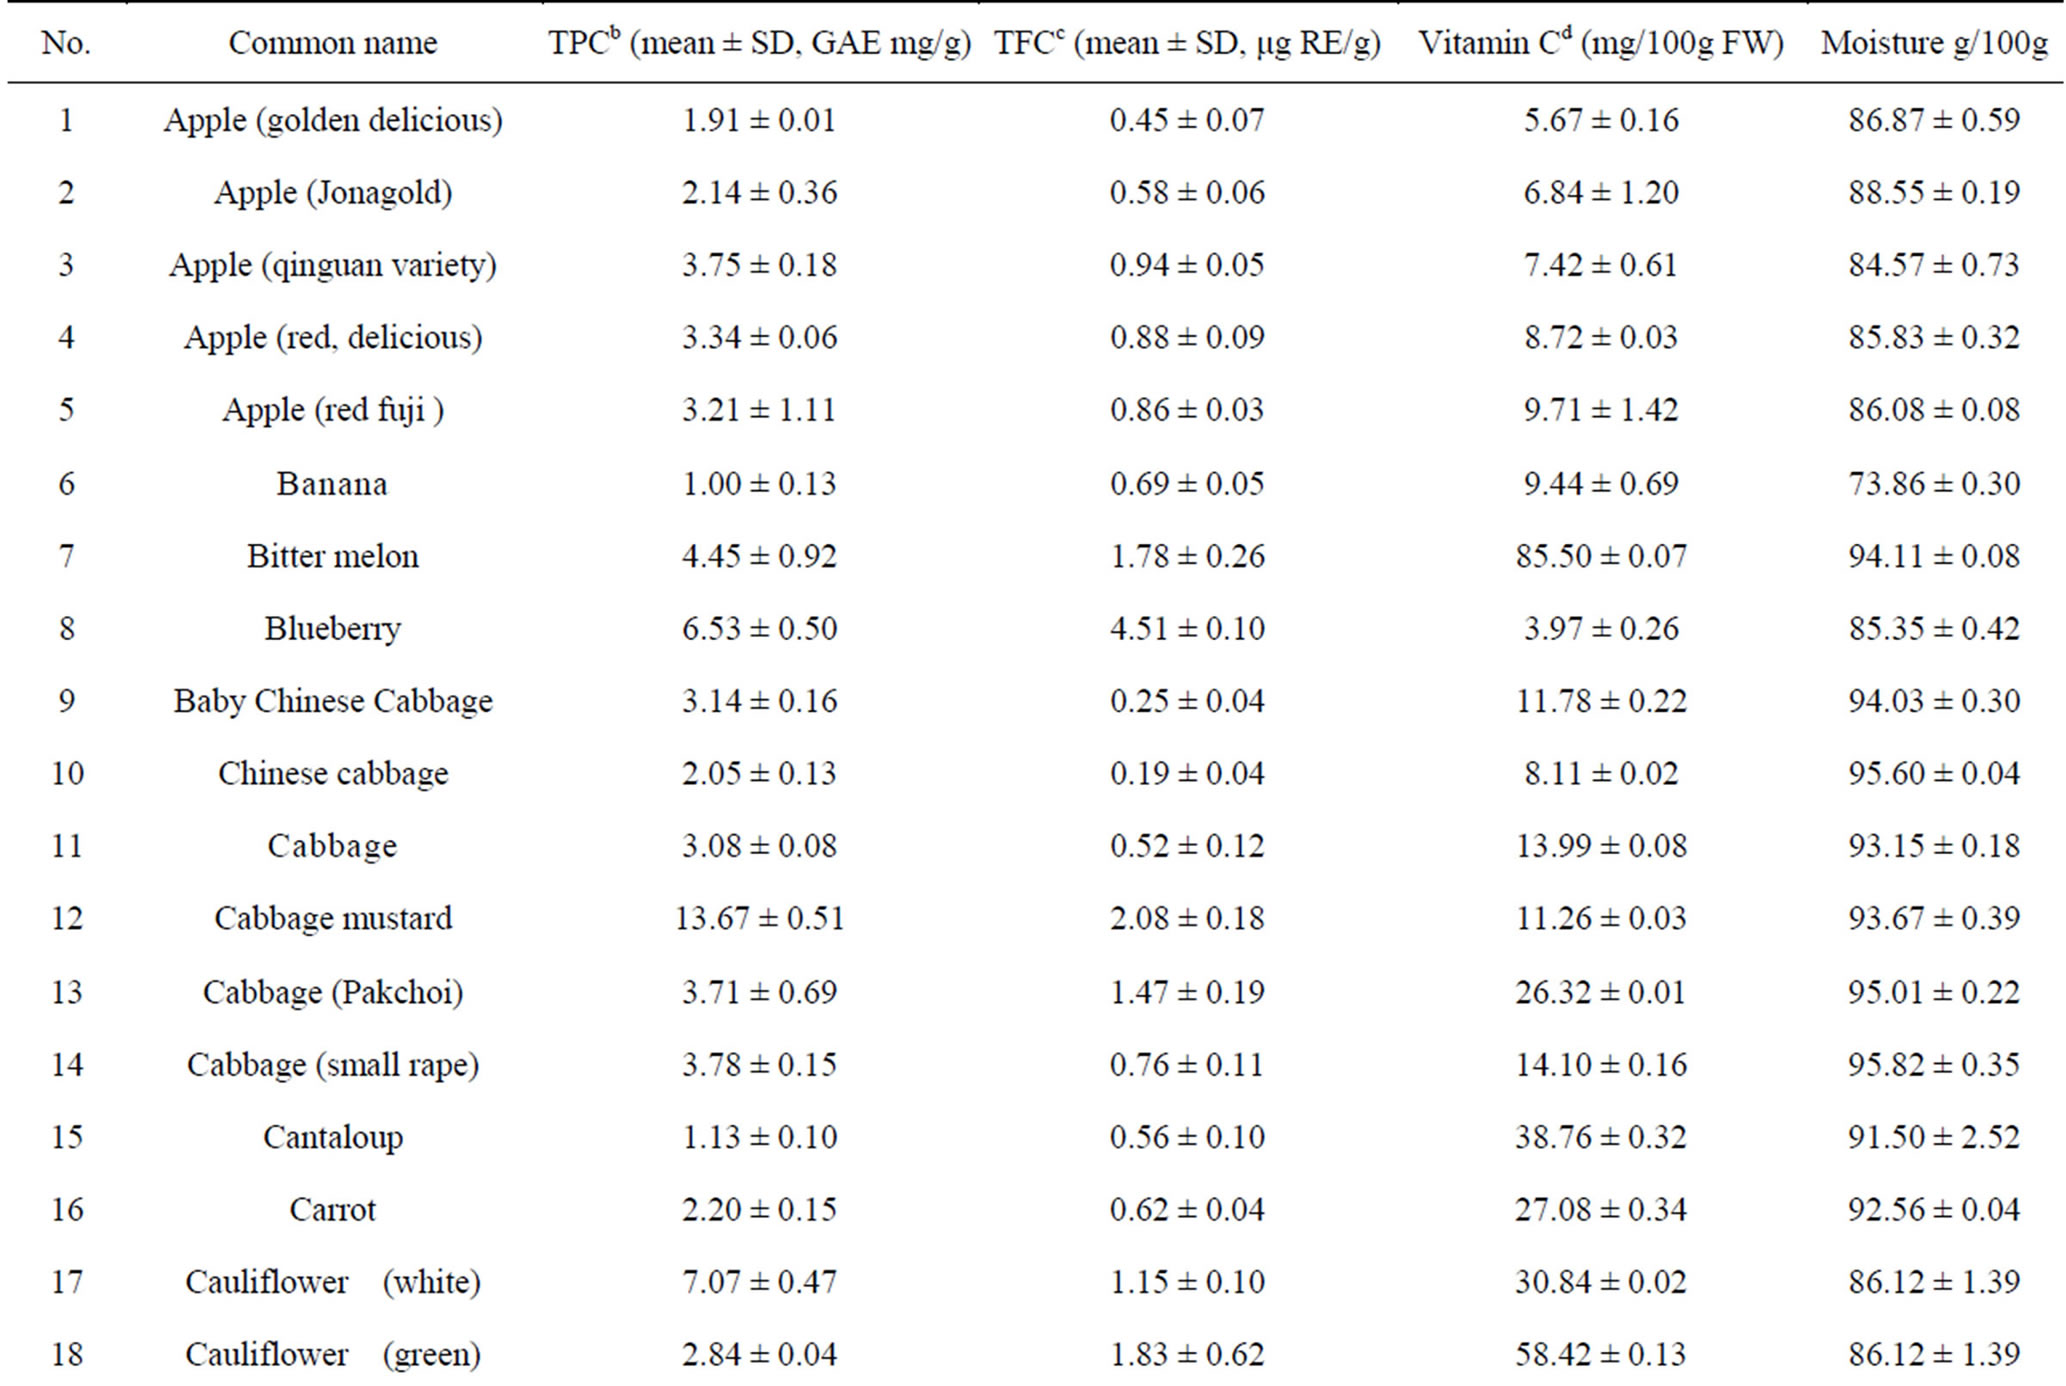
Table 2. Humidity (%) and the main reducing substance contents in110 fruits and vegetables in Chinaa.
aValues are means of 3 replicates ± standard deviation; n = 3; bTotal phenolics (mg gallic acid/g DW); cTotal flavonoids (mg rutin/g DW); dVitamin C (mg ascorbic acid/100g FW).
 (a)
(a)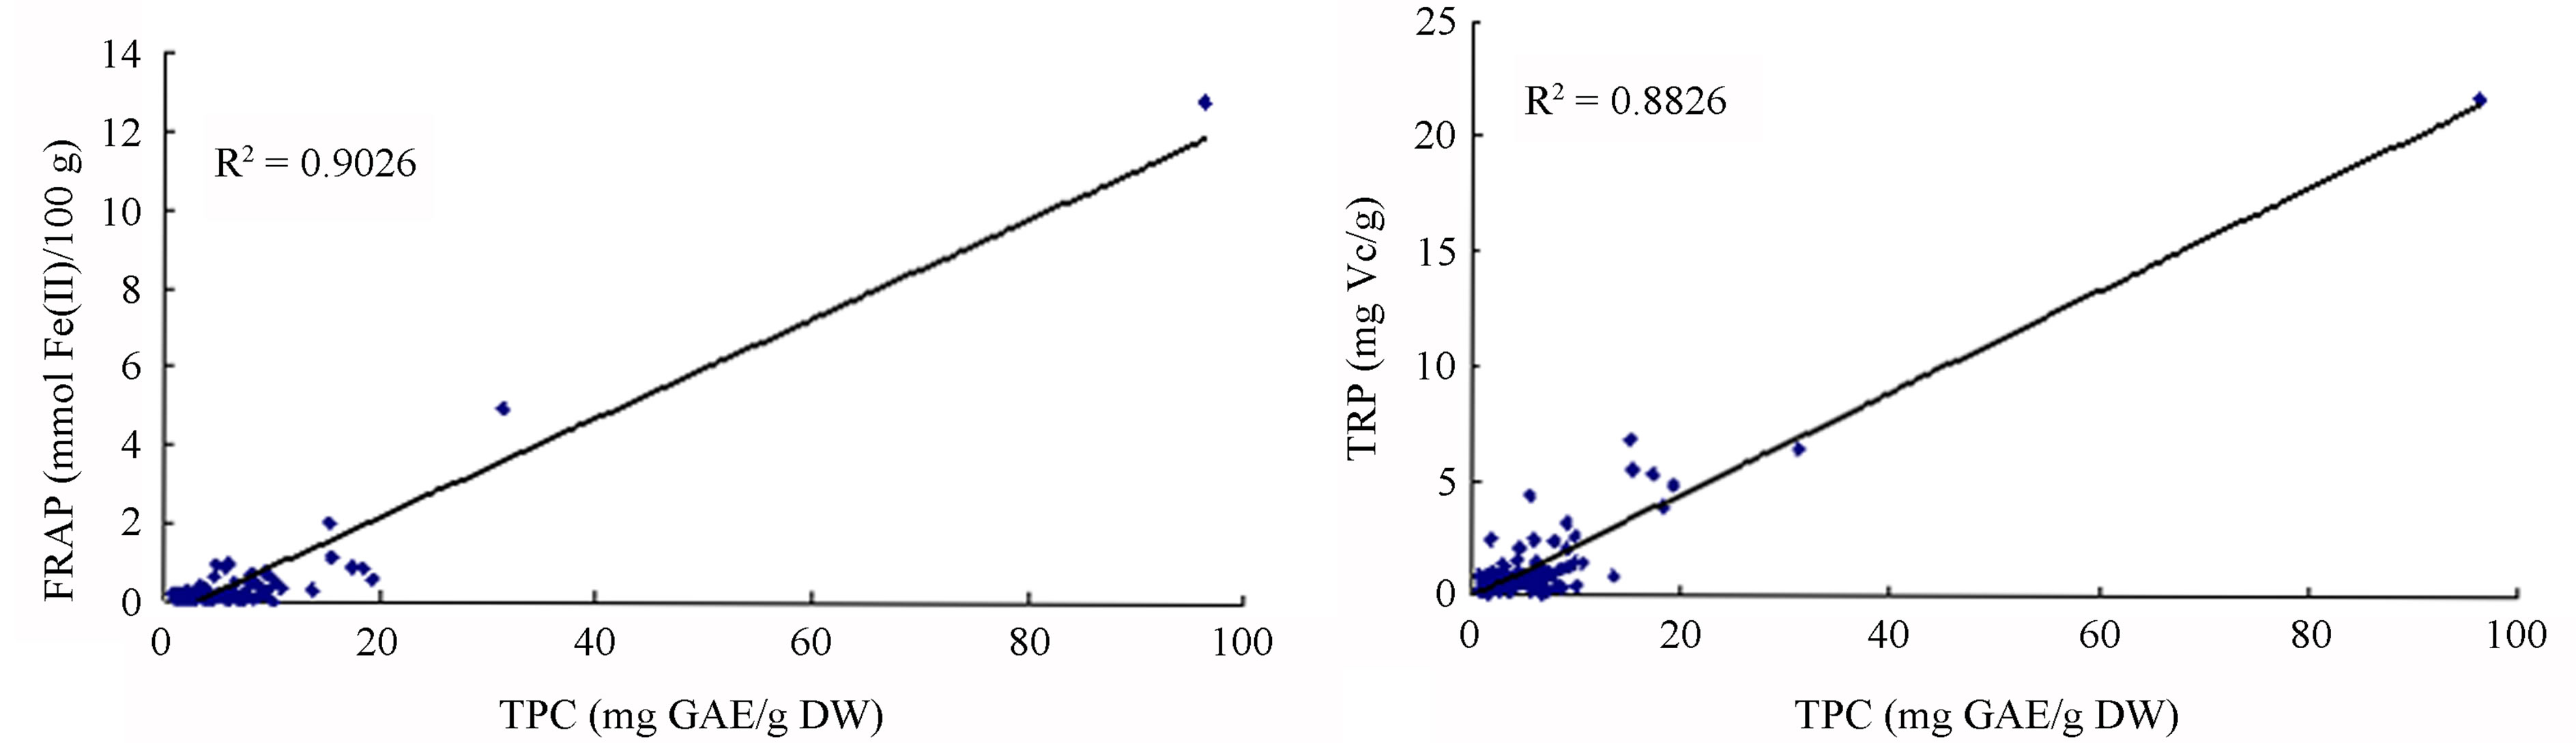 (b)
(b)
Figure 2. Relationship between antioxidant capacities and TPC (mg gallic acid equivalents/g dry weight) of 110 fruits and vegetables in China. (a) Relationship between antioxidant capacities measured by DPPH assay and total phenolic contents (TPC) recorded by milligram gallic acid equivalents/g dry weight (mg GAE∙g−1 DW). (b) Relationship between antioxidant capacities measured by ABTS assay and TPC recorded by mg GAE∙g−1 DW. (c) Relationship between antioxidant capacities measured by FRAP assay and TPC recorded by mg GAE∙g−1 DW. (d) Relationship between antioxidant capacities measured by TRP assay and TPC recorded by mg GAE∙g−1 DW.
not all of the adopted methods are highly related. TPC content showed higher correlation with antioxidant capacity when using FRAP and TRP assays than when using the DPPH or ABTS assay. We identified 15 fruits and vegetables possessing the strongest antioxidant capacities, including Chinese toon, hawthorn, jujube, lotus root, persimmon, red plum, black plum, chili pepper, star fruit, strawberry, blueberry, cherry, peach, pomegranate and great burdock. They can be important dietary sources of natural antioxidants for prevention of chronic degenerative diseases caused by oxidative stress. The highest antioxidant activity and total phenolic content were found in Chinese toon, which is beneficial for development of foods to protect against oxidative stress.
Conflict of Interest Statement
The authors declare that there are no conflicts of interest.
Acknowledgements
Financial support provided by the National Natural Science Foundation of the People’s Republic of China (Grant No.31271676) is greatly appreciated. The authors also thank Ph. D. Yun-Tao Zhang for his help to revise the manuscript.
REFERENCES
- I. S. Young and J. V. Woodside, “Antioxidants in Health and Disease,” Journal of Clinical Pathology, Vol. 54, No. 3, 2001, pp. 176-186. http://dx.doi.org/10.1136/jcp.54.3.176
- O. A. Azizova, “Role of Free Radical Processes in the Development of Atherosclerosis,” Biologicheskie Membrany, Vol. 19, No. 6, 2002, pp. 451-471.
- L. Fu, B.-T. Xu, X.-R. Xu, R.-Y. Gan, Y. Zhang, E.-Q. Xia and H.-B. Li, “Antioxidant Capacities and Total Phenolic Contents of 62 Fruits,” Food Chemistry, Vol. 129, No. 2, 2011, pp. 345-350. http://dx.doi.org/10.1016/j.foodchem.2011.04.079
- G. Block, B. Patterson and A. Subar, “Fruit, Vegetables, and Cancer Prevention: A Review of the Epidemiological Evidence,” Nutrition and Cancer, Vol. 18, No. 1, 1992, pp. 1-29. http://dx.doi.org/10.1080/01635589209514201
- G. G. Duthie, S. J. Duthie and J. A. M. Kyle, “Plant Polyphenols in Cancer and Heart Disease: Implications as Nutritional Antioxidants,” Nutrition Research Reviews, Vol. 13, No. 1, 2000, pp. 79-106. http://dx.doi.org/10.1079/095442200108729016
- W. R. Leifert and M. Y. Abeywardena, “Cardioprotective Actions of Grape Polyphenols,” Nutrition Research, Vol. 28, No. 11, 2008, pp. 729-737. http://dx.doi.org/10.1016/j.nutres.2008.08.007
- M. Leja, A. Mareczek and J. Ben, “Antioxidant Properties of Two Apple Cultivars during Long-Term Storage,” Food Chemistry, Vol. 80, No. 3, 2003, pp. 303-307. http://dx.doi.org/10.1016/S0308-8146(02)00263-7
- S. B. Lotito and B. Frei, “Consumption of FlavonoidRich Foods and Increased Plasma Antioxidant Capacity in Humans: Cause, Consequence, or Epiphenomenon?” Free Radical Biology and Medicine, Vol. 41, No. 12, 2006, pp. 1727-1746. http://dx.doi.org/10.1016/j.freeradbiomed.2006.04.033
- F. Rautenbach and I. Venter, “Hydrophilic and Lipophilic Antioxidant Capacity of Commonly Consumed South African Fruits, Vegetables, Grains, Legumes, Fats/Oils and Beverages,” Journal of Food Composition and Analysis, Vol. 23, No. 7, 2010, pp. 753-761. http://dx.doi.org/10.1016/j.jfca.2010.03.018
- T. Stangeland, S. F. Remberg and K. A. Lye, “Total Antioxidant Activity in 35 Ugandan Fruits and Vegetables,” Food Chemistry, Vol. 113, No. 1, 2009, pp. 85-91. http://dx.doi.org/10.1016/j.foodchem.2008.07.026
- N. Babbar, H. S. Oberoi, D. S. Uppal and R. T. Patil, “Total Phenolic Content and Antioxidant Capacity of Extracts Obtained from Six Important Fruit Residues,” Food Research International, Vol. 44, No. 1, 2011, pp. 391- 396. http://dx.doi.org/10.1016/j.foodres.2010.10.001
- R. Govindarajan, M. Vijayakumar and P. Pushpangadan, “Antioxidant Approach to Disease Management and the Role of ‘Rasayana’ Herbs of Ayurveda,” Journal of Ethnopharmacology, Vol. 99, No. 2, 2005, pp. 165-178. http://dx.doi.org/10.1016/j.jep.2005.02.035
- H. Y. Li, Z. Y. Deng, H. H. Zhu, C. L. Hu, R. H. Liu, J. C. Young and R. Tsao, “Highly Pigmented Vegetables: Anthocyanin Compositions and Their Role in Antioxidant Activities,” Food Research International, Vol. 46, No. 1, 2012, pp. 250-259. http://dx.doi.org/10.1016/j.foodres.2011.12.014
- A. Braca, N. D. Tommasi, L. D. Bari, C. Pizza, M. Politi and I. Morelli, “Antioxidant Principles from Bauhinia Terapotensis,” Journal of Natural Products, Vol. 64, No. 7, 2001, pp. 892-895. http://dx.doi.org/10.1021/np0100845
- K. Thaipong, U. Boonprakob, K. Crosby, L. CisnerosZevallos and D. H. Byrne, “Comparison of ABTS, DPPH, FRAP and ORAC Assays for Estimating Antioxidant Activity from Guava Fruit Extracts,” Journal of Food Composition and Analysis, Vol. 19, No. 6, 2006, pp. 669-675. http://dx.doi.org/10.1016/j.jfca.2006.01.003
- I. F. F. Benzie and J. J. Strain, “The Ferric Reducing Ability of Plasma (FRAP) as a Measure of ‘Antioxidant Power’: The FRAP Assay,” Analytical Biochemistry, Vol. 239, No. 1, 1996, pp. 70-76. http://dx.doi.org/10.1006/abio.1996.0292
- Y.-C. Chung, S.-J. Chen, C.-K. Hsu, C.-T. Chang and S.-T. Chou, “Studies on the Antioxidative Activity of Graptopetalum paraguayense E. Walther,” Food Chemistry, Vol. 91, No. 3, 2005, pp. 419-424. http://dx.doi.org/10.1016/j.foodchem.2004.06.022
- F. L. Song, R. Y. Gan, Y. Zhang, Q. Xiao, L. Kuang and H. B. Li, “Total Phenolic Contents and Antioxidant Capacities of Selected Chinese Medicinal Plants,” International Journal of Molecular Sciences, Vol. 11, No. 6, 2010, pp. 2362-2372. http://dx.doi.org/10.3390/ijms11062362
- Z. S. Jia, M. C. Tang and J. M. Wu, “The Determination of Flavonoid Contents in Mulberry and Their Scavenging Effects on Superoxide Radicals,” Food Chemistry, Vol. 64, No. 4, 1999, pp. 555-559. http://dx.doi.org/10.1016/S0308-8146(98)00102-2
- K. L. Bajaj and G. Kaur, “Spectrophotometric Determination of L-Ascorbic Acid in Vegetables and Fruits,” The Analyst, Vol. 106, No. 1, 1981, pp. 117-120. http://dx.doi.org/10.1039/an9810600117
- A. Chanwitheesuk, A. Teerawutgulrag and N. Rakariyatham, “Screening of Antioxidant Activity and Antioxidant Compounds of Some Edible Plants of Thailand,” Food Chemistry, Vol. 92, No. 3, 2005, pp. 491-497. http://dx.doi.org/10.1016/j.foodchem.2004.07.035
- K. Mishra, H. Ojha and N. K. Chaudhury, “Estimation of Antiradical Properties of Antioxidant Using DPPH Assay: A Critical Review and Results,” Food Chemistry, Vol. 130, No. 4, 2012, pp. 1036-1043. http://dx.doi.org/10.1016/j.foodchem.2011.07.127
- A. Floegel, D.-O. Kim, S.-J. Chung, S. I. Koo and O. K. Chun, “Comparison of ABTS/DPPH Assays to Measure Antioxidant Capacity in Popular Antioxidant-Rich US Foods,” Journal of Food Composition and Analysis, Vol. 24, No. 7, 2011, pp. 1043-1048. http://dx.doi.org/10.1016/j.jfca.2011.01.008
- G. K. Jayaprakash, R. P. Singh and K. K. Sakariah, “Antioxidant Activity of Grape Seed (Vitis vinifera) Extracts on Peroxidation Models in Vitro,” Food Chemistry, Vol. 73, No. 3, 2001, pp. 1018-1022.
- K.-J. Wang, C.-R. Yang and Y.-J. Zhang, “Phenolic Antioxidants from Chinese Toon (Fresh Young Leaves and Shoots of Toona sinensis),” Food Chemistry, Vol. 101, No. 1, 2007, pp. 365-371. http://dx.doi.org/10.1016/j.foodchem.2006.01.044
- W.-J. Yu, C.-C. Chang, T.-F. Kuo, T.-C. Tsai and S.-J. Chang, “Toona sinensis Roem Leaf Extracts Improve Antioxidant Activity in the Liver of Rats under Oxidative Stress,” Food and Chemical Toxicology, Vol. 50, No. 6, 2012, pp. 1860-1865. http://dx.doi.org/10.1016/j.fct.2012.03.068
- S.-H. Jiang, C.-L. Wang, Z.-Q. Chen, M.-H. Chen, Y.-R. Wang, C.-J. Liu, Q.-L. Zhou and Z.-J. Li, “Antioxidant Properties of the Extract and Subfractions from Old Leaves of Toona sinensis Roem (Meliaceae),” Journal of Food Biochemistry, Vol. 33, No. 3, 2009, pp. 425-441. http://dx.doi.org/10.1111/j.1745-4514.2009.00226.x
- J. Takebayashi, T. Oki, J. Watanabe, K. Yamasaki, J. B. Chen, M. Sato-Furukawa, M. Tsubota-Utsugi, K. Taku, K. Goto, T. Matsumoto and Y. Ishimi, “Hydrophilic Antioxidant Capacities of Vegetables and Fruits Commonly Consumed in Japan and Estimated Average Daily Intake of Hydrophilic Antioxidants from These Foods,” Journal of Food Composition and Analysis, Vol. 29, No. 1, 2013, pp. 25-31. http://dx.doi.org/10.1016/j.jfca.2012.10.006
- Y.-Z. Cai, Q. Luo, M. Sun and H. Corke, “Antioxidant Activity and Phenolic Compounds of 112 Traditional Chinese Medicinal Plants Associated with Anticancer,” Life Sciences, Vol. 74, No. 17, 2004, pp. 2157-2184. http://dx.doi.org/10.1016/j.lfs.2003.09.047
- N. Dasgupta and B. De, “Antioxidant Activity of Some Leafy Vegetables of India: A Comparative Study,” Food Chemistry, Vol. 101, No. 2, 2007, pp. 471-474. http://dx.doi.org/10.1016/j.foodchem.2006.02.003
- M. S. M. Rufino, R. E. Alves, E. S. Brito, J. P. Jiménez, F. S. Calixto and J. M. Filho, “Bioactive Compounds and Antioxidant Capacities of 18 Non-Traditional Tropical Fruits from Brazil,” Food Chemistry, Vol. 121, No. 4, 2010, pp. 996-1022. http://dx.doi.org/10.1016/j.foodchem.2010.01.037
- M. M. B. Almeida, P. H. M. Souza, A. M. C. Arriaga, G. M. P. Prado, C. E. C. Magalhães, G. A. Maia and T. L. G. Lemos, “Bioactive Compounds and Antioxidant Activity of Fresh Exotic Fruits from Northeastern Brazil,” Food Research International, Vol. 44, No. 7, 2011, pp. 2155- 2159. http://dx.doi.org/10.1016/j.foodres.2011.03.051
- P. C. Wootton-Beard and L. Ryan, “Improving Public Health?: The Role of Antioxidant-Rich Fruit and Vegetable Beverages,” Food Research International, Vol. 44, No. 10, 2011, pp. 3135-3148. http://dx.doi.org/10.1016/j.foodres.2011.09.015
NOTES
*Corresponding author.