Food and Nutrition Sciences
Vol. 3 No. 8 (2012) , Article ID: 21570 , 10 pages DOI:10.4236/fns.2012.38136
A Statistical Approach to Optimize Xylitol Production by Debaryomyces nepalensis NCYC 3413 in Vitro
![]()
Applied Industrial Microbiology Laboratory, Department of Biotechnology, Indian Institute of Technology-Madras, Chennai, India.
Email: *gummadi@iitm.ac.in
Received May 5th, 2012; revised June 5th, 2012; accepted June 13th, 2012
Keywords: Debaryomyces nepalensis; Xylose; Xylitol; Medium Optimization; Plackett-Burman Design; Central Composite Design
ABSTRACT
Debaryomyces nepalensis NCYC 3413, halotolerant yeast isolated from rotten apple, was capable of utilizing components of hemicellulose hydrolysate such as glucose, galactose, mannose, xylose and arabinose. The organism utilizes xylose as a sole carbon source and produces xylitol. The Plackett-Burman design was applied to determine the specific medium components affecting xylitol production and found that xylose, K2HPO4, and ZnSO4 were critical in augmenting xylitol production. These significant parameters were further optimized using response surface methodology. The optimum concentrations of xylose, K2HPO4, and ZnSO4 were found to be 100 g/l, 10.6 g/l and 8.9 mg/l respectively. Under these optimal conditions the xylitol production increased from 27 g/l to 36 g/l with a yield of 0.44 g/g (57% increase in total yield). In addition, formation of the by product (glycerol) was decreased under optimal conditions.
1. Introduction
Lignocelluloses are the largest renewable source of energy and bioconversion of lignocelluloses to commercial products is a rational way of making use of this source. Major components of lignocelluloses are celluloses, hemicelluloses and lignin. Among these, hemicelluloses are heterogenous polysaccharides rich in pentoses and hexose sugars like xylose, arabinose, glucose, galactose, and mannose with trace quantities of glucuronic and galacturonic acids. Agricultural residues contain 37% of hemicelluloses which can be used as raw material for the production of useful compounds using chemical and biotechnological processes. One such compound is xylitol which has application in medical and food industries. The current industrial production of xylitol is by chemical reduction of D-xylose in the presence of a nickel catalyst at high temperature and pressure, which is laborious and expensive [1,2]. Microbial xylitol production from renewable sources like plant biomass rich in hemicelluloses is worthwhile since it is environment-friendly and economically viable [3]. The efficient bioconversion of both glucose and xylose components of the hemicellulose hydrolysate is essential for the economic production of industrially important metabolites. Many wildtype yeast strains cannot utilize glucose and xylose simultaneously. Yeast strains such as Pichia stipitis, Candida shehatae, Candida parapsilosis, Candida guilliermondii, Debaryomyces hansenii and Pachysolen tannophilus utilized both glucose and xylose to produce ethanol and xylitol but the product yield varied among organisms [4-7].
Even though some yeast strains were reported to utilize both glucose and xylose, the product yields need to be further improved for economical bioprocess. Hence, new microorganisms that can efficiently utilize glucose/xylose components of hemicellulosic hydrolysate and produce higher yields of industrial metabolites need to be identified [8]. Debaryomyces nepalensis NCYC 3413 is a halotolerant strain previously isolated from rotten apple capable of utilizing pectin as sole source of carbon [9]. From our previous work, it has been shown that this strain utilizes both glucose and xylose as sole source of carbon and produces industrially important metabolites such as xylitol and ethanol [10].
Xylitol is a commercially used pentitol composed of a five carbon pentose backbone which bacteria are unable to utilize. Xylitol mitigates the formation of dental plaque owing to its non-fermentability by plaque forming bacteria [11-14]. It is commonly used as a sugar substitute for diabetic patients because it is low in calories and its metabolism is not regulated by insulin. It was suggested as a therapeutic agent for glucose 6 phosphate dehydrogenase deficiency [11-13,15-18]. Xylitol is also known to improve health and biomechanical properties of the bone [12,13]. Xylitol has received global interest since its beneficial properties have been shown. The ever increasing market for xylitol necessitates research on novel yet economical processes for xylitol production. Microbial production of xylitol, a better alternative, is influenced by several factors including constituents of the culture medium hence their optimization study is important.
Development of economical medium requires selection of carbon, nitrogen, sodium, phosphorus and trace elements. Conventionally fermentation process was optimized by a single factor, keeping the other factors constant. This approach has been replaced using statistical techniques for optimizing the medium using fewer experiments thereby making the process economical. Statistical methods are rapid, reliable and lucrative, short list significant nutrients that help in understanding the interactions among nutrients at various concentrations [19]. Different types of statistical methods are available for such optimization experiments. Plackett Burman design is a well established statistical design which is a two level fractional factorial design used to identify the critical parameters influencing the fermentation process [18]. The design is orthogonal in nature and thus gives pure effect of each variable, not its confounded interaction with other variables.
Response surface methodology (RSM) is a mathematical and statistical tool, which is useful for modelling and analysing problems where the response of interest is influenced by many variables [19]. RSM has been utilized successfully to optimize various parameters related to the bioprocess industry, in producing significant yield of various metabolites [20-22]. In the current study, screening and optimization of variables for xylitol production by Debaryomyces nepalensis NCYC 3413 using Plackett-Burman and RSM is reported.
2. Materials and Methods
2.1. Maintenance Medium and Inoculum Preparation
Debaryomyces nepalensis NCYC 3413 was maintained on a solid YEPP medium containing yeast extract 10 g/l, peptone 20 g/l and pectin 5 g/l at pH 7.0 and incubated at 30˚C for 24 hours and later stored at 4˚C. The organism was subcultured every 4 days. A single colony was transferred from an overnight-grown culture plate into the YEPD medium (50 ml) containing yeast extract 10 g/l, peptone 20 g/l and dextrose 20 g/l and incubated for 12 h at 30˚C at 180 rpm.
2.2. Growth Medium and Culture Conditions
Semi-synthetic medium containing xylose, 100 g/l; (NH4)2SO4, 3 g/l; MgSO4, 0.1 g/l; K2HPO4, 6 g/l; Na2HPO4, 3 g/l; yeast extract, 1 g/l; CaCl2·2H2O, 147 mg/l; FeCl3, 10 mg/l; MnSO4·H2O, 3.4 mg/l; ZnSO4·7H2O, 4.3 mg/l; CuSO4·5H2O, 0.25 mg/l; citric acid, 6.9 mg/l, pH, 7.0 was adjusted using H3PO4 and NaOH. All the components are autoclaved separately and mixed subsequently so that the final medium volume was 50 ml in 250 ml Erlenmeyer flask. However, the composition of medium was varied according to the Plackett Burman design and central composite design (Tables 1 and 3) and was inoculated with 2% (v/v) of inoculum and incubated at 30˚C & 180 rpm for 120 h. Samples were collected at regular intervals to measure growth and the concentration of metabolites. All the samples were centrifuged at 8000 rpm for 5 minutes. The supernatant was used for analysis of xylitol production and the cell pellet was used to quantify growth. The growth was evaluated by measuring the optical density of culture at 600 nm (OD600). As standardized previously for D. nepalensis, absorbance 1.0 at 600 nm corresponds to 0.34 g cell dry weight per litre culture [9].
2.3. Analytical Methods
Samples that were collected at regular intervals were analysed for xylitol production. The cells were separated from culture medium and the supernatant was stored at 4˚C for further analysis. The concentration of xylose and other metabolites (xylitol and glycerol) are estimated by HPLC (Jasco) equipped with refractive index detector and Aminex HPX-87H column (Bio-Rad, Richmond, USA) at 45˚C with 0.01N H2SO4 solution as the mobile phase at a flow rate of 0.6 ml/min. Standard xylose (Hi-Media) at 10 g/l was used as the standard. The retention time of xylose was found to be 9.8 min and that of xylitol was 11.2 min at a flow rate of 0.6 ml/min. Detection of xylose and xylitol was done using the RI detector.
3. Experimental Designs and Data Analysis
3.1. Screening of Medium Components by Plackett-Burman Design
Plackett Burman design is a well established statistical technique for medium optimization [2,19,23-25] and was used for the screening of media components that would affect the production of xylitol by D. nepalensis NCYC 3413. The Plackett Burman method allows the evaluation of N-1 variables by N number of experiments. The experimental plan includes 16 runs and two levels of concentrations for each factor. The factors designated X1 - X14 represent medium constituents, X15 being a dummy variable. A total of fifteen components including one
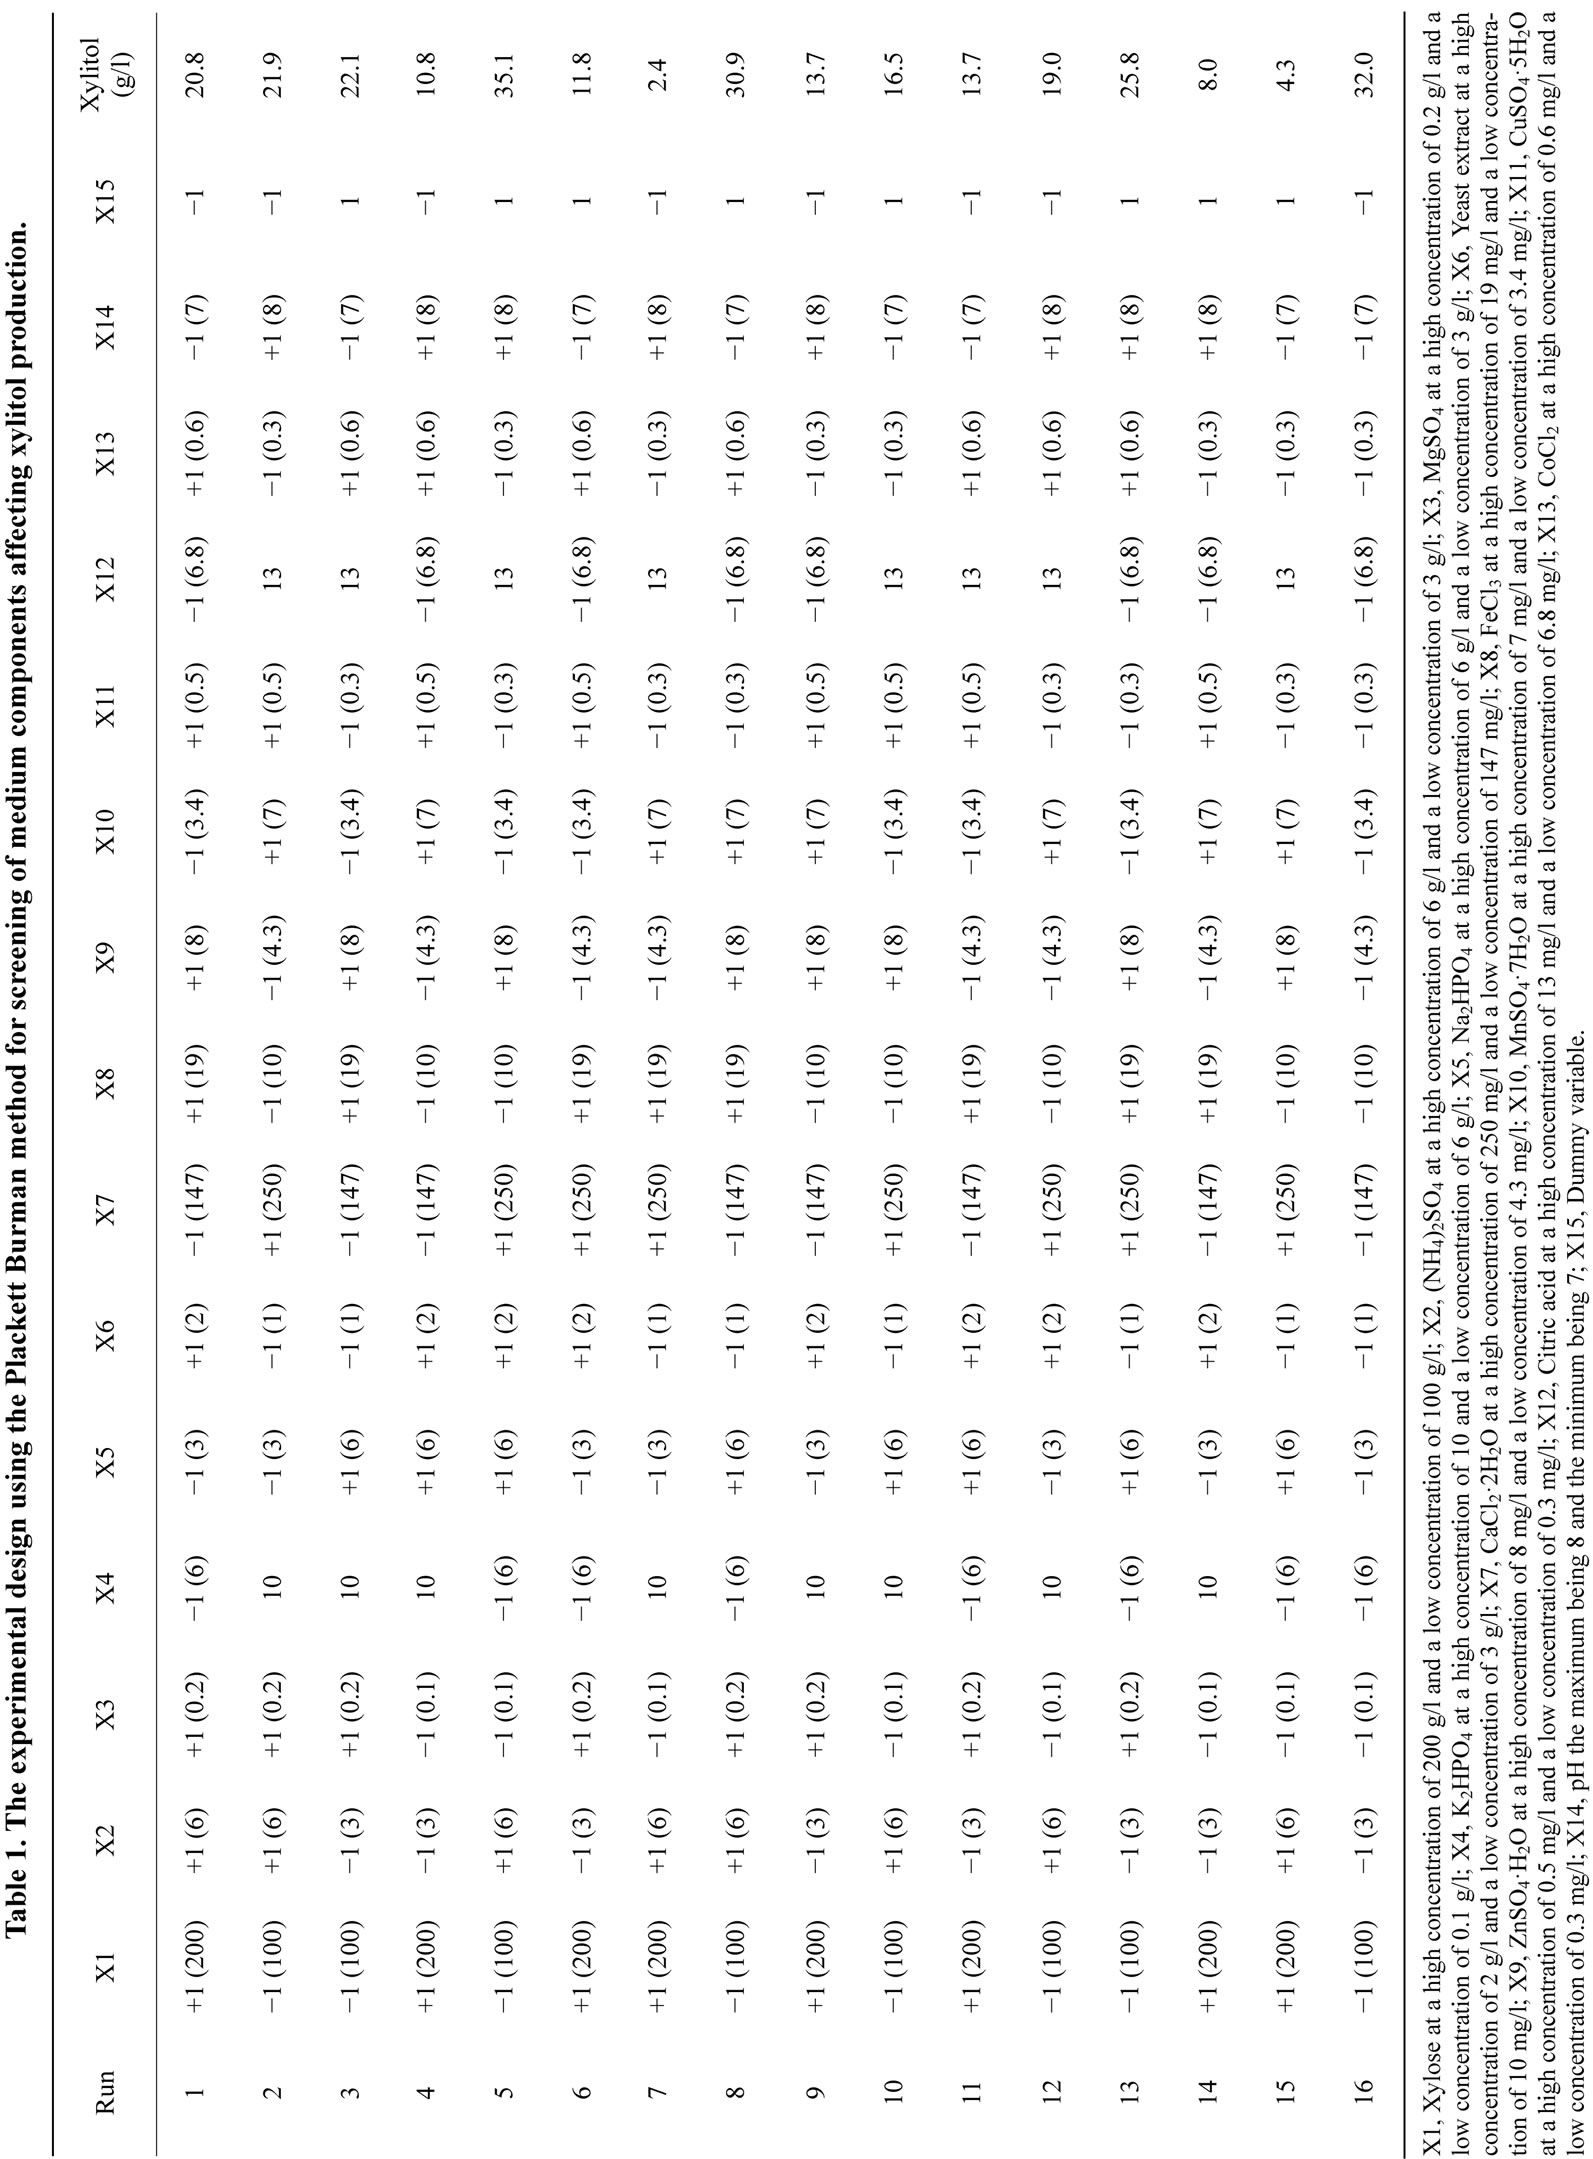
Table 1. The experimental design using the Plackett Burman method for screening of medium components affecting xylitol production.
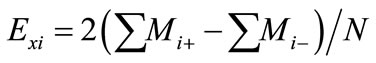
dummy variable [variables, k = 15] are selected for the study (Table 1). Each variable is represented at two levels, high concentration (+) and low concentration (−) in 16 trials. The number of positive signs and negative signs per trial are (k + 1)/2 and (k − 1)/2, respectively (Table 2). Each column should contain equal number of positive and negative signs. The effect of each variable is determined by the following equation:
 (1)
(1)
where  is the concentration effect of the tested variable. Mi+ and Mi− are the amount of xylitol produced from the trials where the variable (xi) measured was present at high and low concentrations, respectively; and N is the number of trials. Response was calculated as the concentration of xylitol produced in g/l. All experiments were performed in duplicates and the average xylitol produced was considered as the response. The coefficient and effect of each variable was calculated and the significant levels of the variables were estimated by t-test (Table 2).
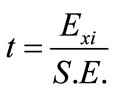
The standard error (S.E.) for the production of xylitol was the square root of the variance and the P value (significance level) of each concentration effect was determined using the Student’s t-test:
 (2)
(2)
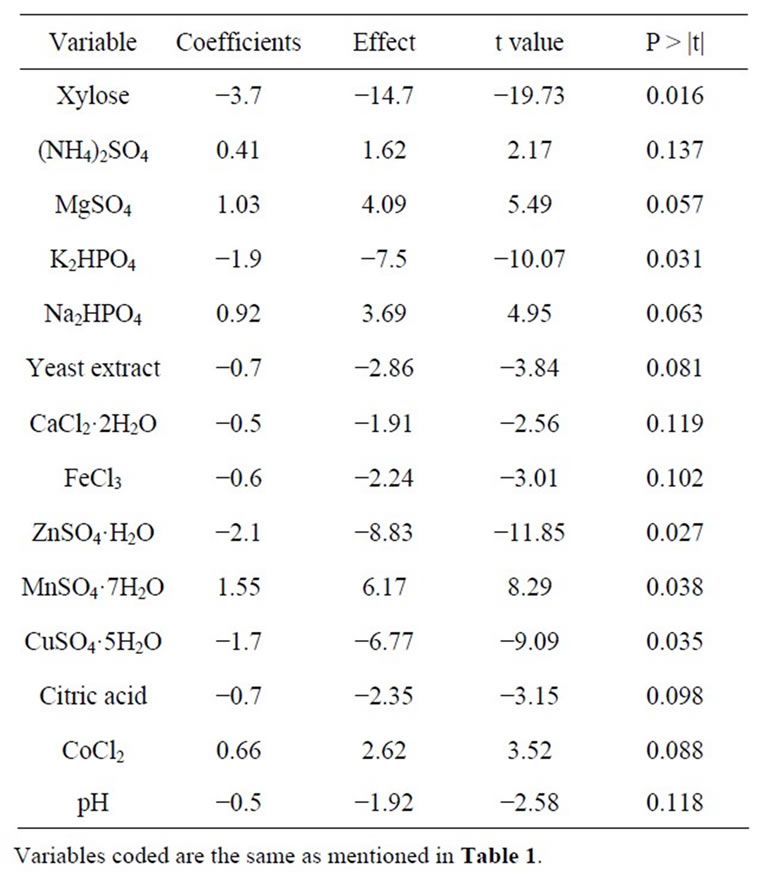
Table 2. Xylitol production as obtained and calculated effect, Coefficients, t values, probability and confidence level as per Plackett Burman design.
where  is the effect of the tested variable. The variables with higher confidence levels were considered to influence the response or output variable.
3.2. Optimization of Medium Components Using Central Composite Design
Optimization of the media constituents was done by central composite experimental design (CCD), where a 23 factorial design was employed with 20 experiments using different combinations of the 3 variables (Table 3). According to this design, the total number of treatment combinations is  where k is the number of independent variables and n0 the number of repetitions of the experiments at the center point. For statistical calculation, the variables Xi have been coded as xi according to the following transformation. The behaviour of the system was explained by the following quadratic equation:
 (3)
(3)
where Y is the predicted response, β0 the intercept term, βi the linear effect, βii the squared effect, and βij is the interaction effect.
4. Results and Discussion
4.1. Screening of Medium Constituents Affecting Xylitol Production
A total of 14 components were screened for their effect on xylitol production by D. nepalensis NCYC 3413 using the Plackett-Burman design. The experimental plan and corresponding responses (xylitol production) are shown in Table 1. Each row of the table represents experiments involving 14 independent variables and one dummy variable and two levels of concentration for each variable. Based on the obtained data the coefficient and effect of each variable was calculated and the significance of the variables was determined by the t-test. The t-values for 3 variables, xylose, K2HPO4 and ZnSO4 were found to have higher significant values and represented a confidence level of ≥97%. The analysis showed that xylose, K2HPO4 and ZnSO4 significantly affected xylitol production. Increase in the quantity of elements such as Na2HPO4, (NH4)2SO4, CaCl2·2H2O, FeCl3, CuSO4·5H2O, citric acid, CoCl2, and pH, did not augment the yield of xylitol and this was confirmed statistically. The influence of addition or depletion of trace elements like CuSO4, ZnSO4, MnSO4 and FeCl3 was studied initially (data not shown). It was observed that when the medium was supplemented with only CuSO4, much of the carbon source provided was converted to biomass with a very low yield of xylitol, which shows that xylitol biosynthesis requires other trace elements (Zn, Mn and Fe). Addition of copper stimulates growth, since it is required for the synthesis of
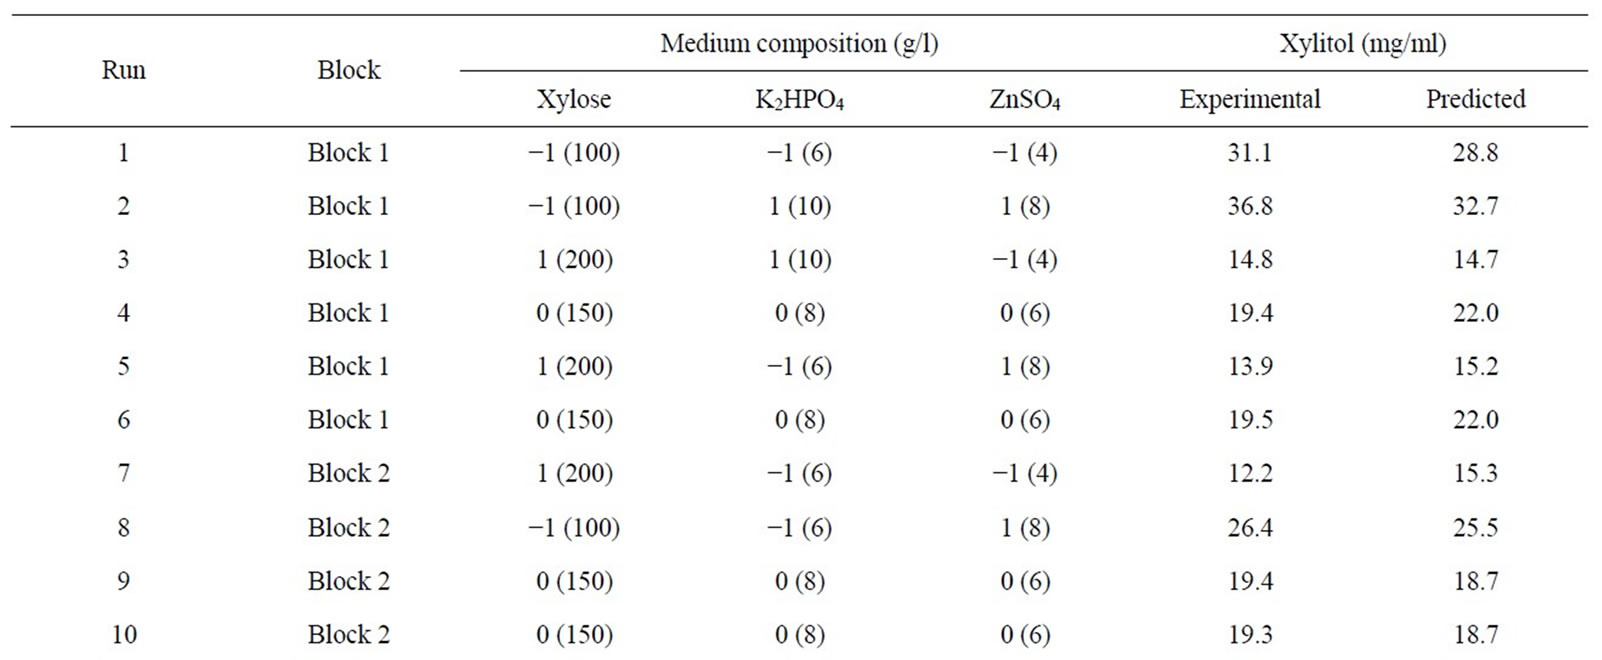
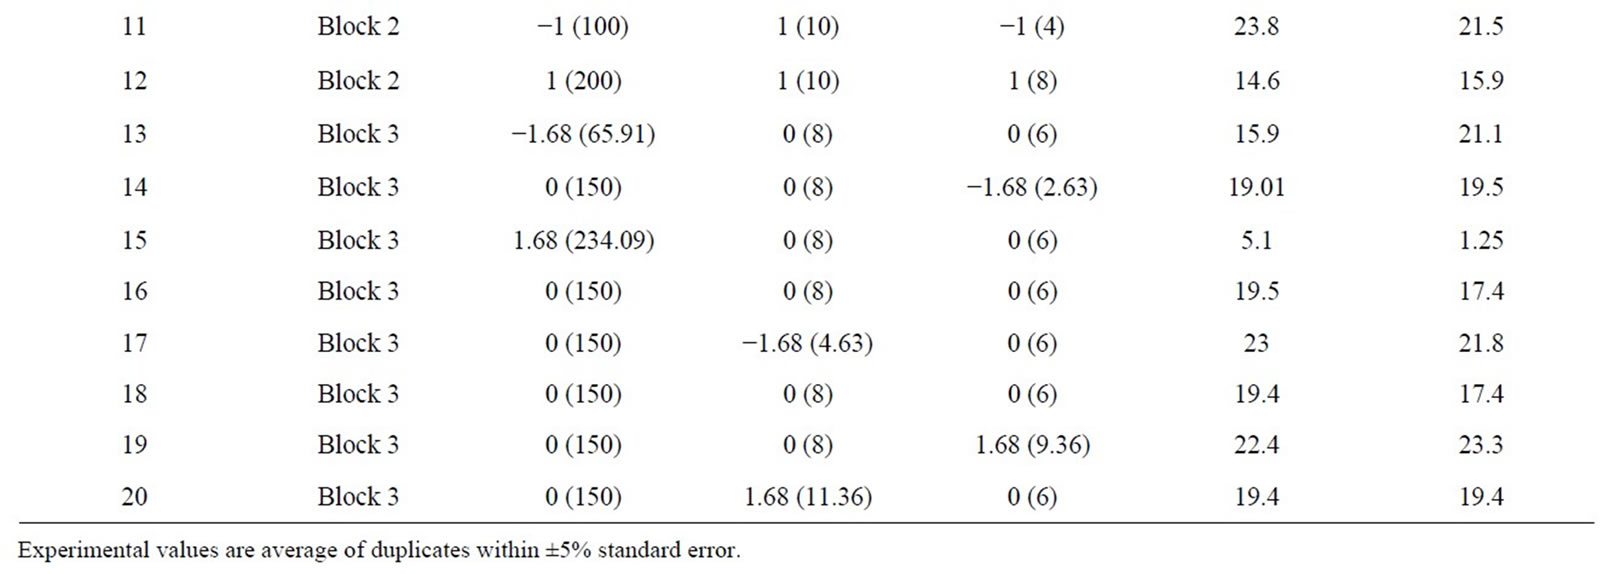
Table 3. Coded and actual values of medium components used for central composite design.
cytochromes, which are integral components of the respiratory chain. This was in agreement with the results obtained in the Plackett-Burman screening experiments. The amount of xylitol produced was very low in all the runs where CuSO4 concentration was higher. This could be because of the inhibitory effect of higher copper concentration. Analogously it was reported that addition of less than 0.24 mM of Cu2+ increased biomass growth by 34% in P. stipitis ATCC 58784, but the effect on volumetric ethanol production was not profound [26]. The positive effect of ZnSO4 on xylitol production was also concordant with the results obtained in the preliminary experiments. There have been many reports on supplementation of Zn, which enhances biomass production and rate of fermentation [18,27]. K2HPO4 is responsible for creating a suitable buffer system in the production medium along with Na2HPO4. By increasing its concentration to 10 g/l, it: resulted in a higher xylitol yield. It was also reported that increasing the concentration of K2HPO4 in the medium could enhance the buffering capacity of the medium [20,28,29]. The concentration of xylose in the media affected the metabolism of the organism, with increased concentration of xylose, it was observed that the organism did not utilize xylose completely and the byproducts of its metabolism i.e. yield of xylitol and glycerol were also affected. A similar effect was found with C. tropicalis. High concentrations of xylose inhibited the growth and xylitol yield of C. tropicalis. The highest xylitol yield was obtained at an initial xylose concentration of l00 g/1 [16]. This was in contrast to the other reported organisms. Increasing the initial xylose concentration from 20 to 150 g/l favoured xylitol production, the highest xylitol yield observed (0.47 g/g) being produced with 150 g/l xylose using Candida boidinii NRRL Y-17213 [30]. The rate of xylitol production increased linearly with increasing initial xylose concentration. A high concentration of xylose (279 g/L) was converted rapidly and efficiently to produce xylitol with a product concentration of 221 g/l by D. hansenii [3]. An increase in the initial xylose concentration from 10 g/1 to 300 g/1 led to enhancement of xylitol production by C. guilliermondii and there was an increase in the yield of xylitol. The highest value in xylitol yield reached 0.75 g/g when 300 g/l xylose was used but growth was inhibited at high sugar concentration [31]. The balance between the addition of elements such as K2HPO4 and ZnSO4, were also needed for improved xylitol production. Previous studies have shown that trace elements were also integral in response to the production of the metabolites and also affected the biomass. Since the organism is halotolerant, alteration of pH and salts in the range studied did not affect the growth profile of the organism (Table 1).
4.2. Optimization of the Medium Components Using Central Composite Design
The critical nutrients such as xylose, K2HPO4 and ZnSO4, affecting the xylitol yield were selected for further optimization by response surface methodology. A central composite design was used and considered for studying the interaction of these variables, within a range of +1.68 and −1.68 in relation to the increased yield of xylitol (Table 3). The xylitol production was high when xylose was at −1 and the other components at +1. Also alteration of K2HPO4 and ZnSO4 resulted in lower production of glycerol, which indicated that these components could be responsible for efficient conversion of substrate xylose to the desired metabolite xylitol. CCD also indicated that the xylitol yield for the centre points corresponded to a range between 14 g/l to 19 g/l (Run 4, 6, 9, 10, 16 & 18) and keeping the xylose at −1 and the other components at +1 resulted in nearly two fold increase in the xylitol production. Xylitol production is extremely low when the substrate i.e., xylose concentration was high as seen in the Run 7, 12 and 15. A lower yield of xylitol yield could be due to osmotic stress exerted on the cells or substrate inhibition of xylose-metabolising enzymes by high xylose concentration. Thus the value of responses indicates that the ranges of variables chosen were appropriate.
The results obtained from the central composite design were fitted to a second order polynomial equation to explain the dependence of xylitol production on the medium components.
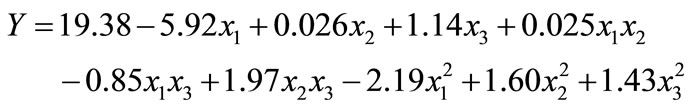 (4)
(4)
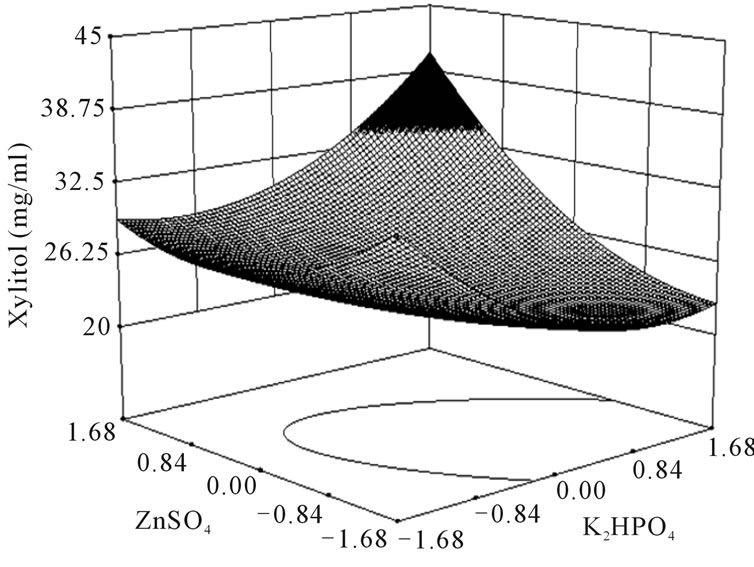
where Y is the predicted response, x1 the coded value of X1 (xylose), x2 the coded value for X2 (K2HPO4) and x3 the coded value of X3 (ZnSO4). The analysis of variance of the quadratic regression model suggested that the model is very significant as it is indicated by a low probability value [(Pmodel > F) = 0.05] by the Fisher’s statistical test for ANOVA (Table 4). According to Equation (4), a negative coefficient value of x1 indicates that increasing the concentration of xylose in the production medium lessens the yield of xylitol. This was given in evidence by low xylitol yield in runs 3, 5, 7 & 12, where xylose was kept at +1 level. The coefficient values for x2 and x3 were positive, which indicated that increasing the level of these variables positively affects the production xylitol. The result was apparent in run 2, where the amount of xylitol obtained was the highest (36 g/l) when both x2 and x3 were kept at +1 level. By comparing the coefficients in Equation (4) it can be found that the linear and quadratic effect of xylose (x1) and ZnSO4 (x3) is very significant when compared to other variables. Even though linear coefficient of x2 is low but the squared effect is very important for xylitol production. Interestingly, the interaction between the variables can be studied by comparing the coefficients. For e.g. the interaction between x2 and x3 (coefficient of x2 and x3) is much more than the linear effect of x2 (coefficient of x2). Similarly, the coefficient of x2 and x3 (interaction term) is much more than the linear effect of x2 and x3. These results clearly indicated that there exists strong interaction among the parameters influencing the xylitol production. The f value and the P value of the lack of fit were 4586.89 and 0.0001 which indicated that the lack of fit was significant. The determination coefficient (R2 = 0.86) and adjusted determination coefficient (Adj R2 = 0.7) were satisfactory to confirm the significance of the model. Figure 1 represents the response surface plots (RSP) showing the dependency of xylitol production on the variables under study while keeping one of them at optimal level. The optimum values of each variable were identified based on the elevation on the 3D plot or from the central points of the corresponding contour plot.
4.3. Statistical Verification
The Design Expert software version 8 (Stat-Ease, Inc.) presented the maximal numerical solution with the predicted xylitol production up to 36.8 g/l. Verification of the calculated optimum conditions for xylitol yield was done by performing the experiment at predicted optimized conditions (xylose 100 g/l, K2HPO4 10.6 g/l and ZnSO4 8.9 mg/l). Under optimal conditions, significant increase in the biomass and product yield was observed (Figure 2). The xylose uitlization was not affected under optimized and unoptimized conditions (Figure 2(a)). A marginal
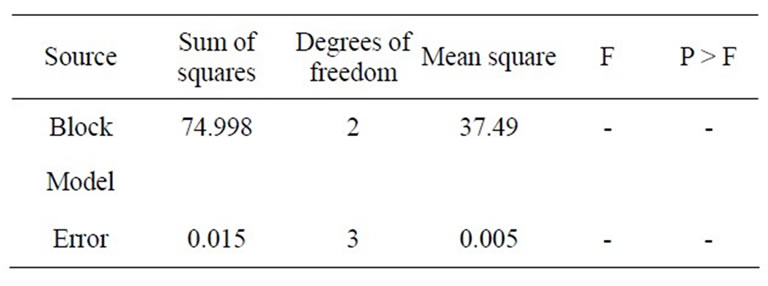
Table 4. ANOVA table for optimizing medium components for xylitol production by Debaryomyces nepalensis NCYC 3413.
 (a)
(a)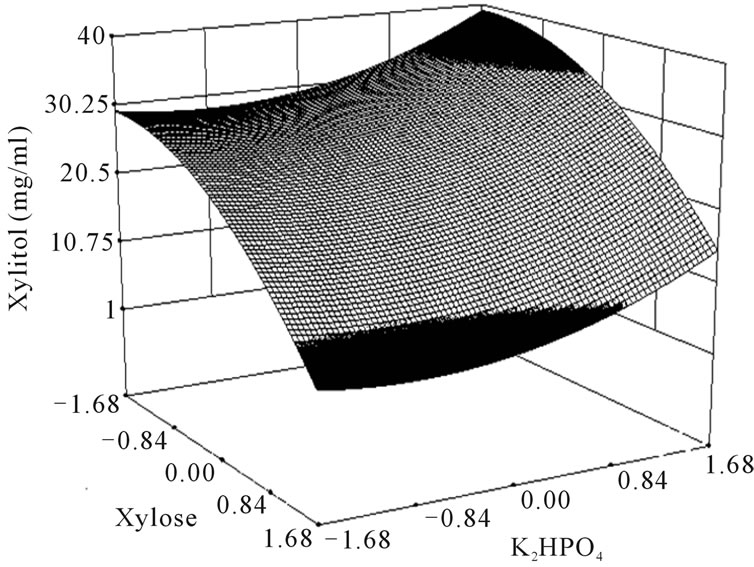 (b)
(b)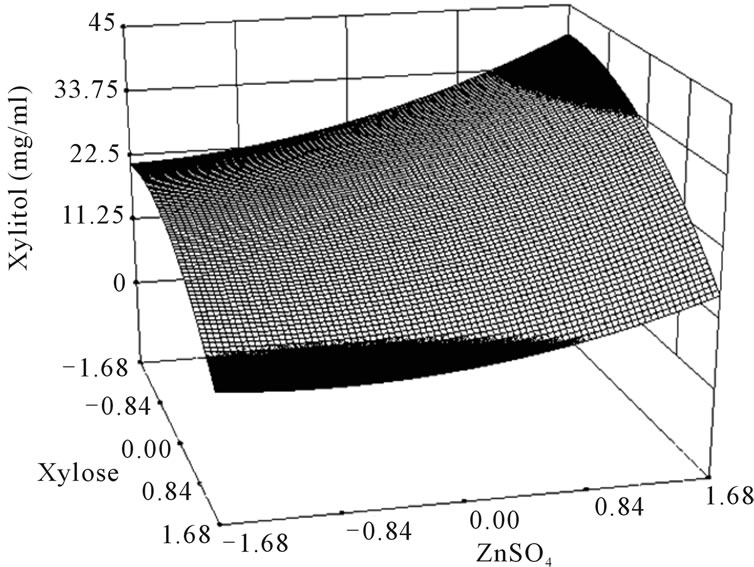 (c)
(c)
Figure 1. Response surface plot showing the effect of xylose, K2HPO4 and ZnSO4 on xylitol production. (a) Response surface plot showing the effect of ZnSO4 and K2HPO4 on xylitol production at xylose 100 g/l; (b) Response surface plot showing the effect of xylose and K2HPO4 on xylitol production at 8.9 mg/l of ZnSO4; (c) Response surface plot showing the effect of ZnSO4 and xylose on xylitol production at 10 g/l of K2HPO4.
increase in biomass was observed under optimized conditions (Figure 2(b)). Importantly, it has been found that glycerol (by-product) production was drastically reduced under optimized conditions than unoptimized conditions (Figure 2(d)), which resulted in higher production of xylitol (Figure 2(c)). This shows that the optimized composition favoured xylitol production instead of glycerol probably by indirectly controlling the glycerol biosynthetic pathway flux. Under these optimal conditions the xylitol production increased from 27 g/l to 36 g/l with a yield of 0.44 g/g (57% increase in yield). The mediumcomponents were altered in correlation to the Design Expert software version 8. Under these conditions the organism produced 35.8 g/l of xylitol which was close to value as predicted by the software (Figure 2).
4.4. Effect of Initial pH
pH is known to be one of the important factors affecting most fermentations and is important for secretion of cell wall degrading enzymes involved in fungal virulence in plant pathogenic fungi [32,33]. In general, the medium pH not only affects cell growth and rate of product formation, but also changes final product yield. It has been demonstrated that changing the initial pH of the medium affected the metabolism of xylose by Debaryomyces hansenii severely. It was reported that the optimum pH for xylitol production by D. hansenii NRRL Y-7426 was between 4.5 and 5.5 [3,34]. Screening experiments showed that pH 7.0 and 8.0 does not affect xylitol production. However to determine the optimum pH for xylitol production, the effect of broad range of pH from 5.0 to 7.0 was studied. At pH 5.0, the cell growth and xylose utilization was lower (Figures 3(a) and (b)). At pH 6.0 and 7.0, the cell growth and net xylose utilization was same but the xylose utilization rate was lower at pH 6.0 than 7.0 (Figures 3(a) and (b)). Similarly, xylitol production was lower at pH 5.0, but xylitol production rate was maximum at pH 6.0. This could be due to the effect of variation in extracellular pH and consequent changes in intracellular pH which might slow down the enzymatic conversion of xylose to xylitol [34]. However, the final xylitol concentration is not affected at pH 6.0 and 7.0 (Figure 3(c)). Importantly glycerol production (by product) was minimized at pH 6.0 when compared to pH 7.0. Considering all these results, it can be concluded that optimal pH for xylitol production was 6.0. By means of optimizing medium composition and culture conditions, the production of xylitol was enhanced from 27 g/l to 36 g/l with increase in product yield to 0.44 g/g (Figure 4).
5. Conclusion
Optimization of xylitol yield by Debaryomyces nepalensis NCYC 3413 using Plackett Burman and response surface
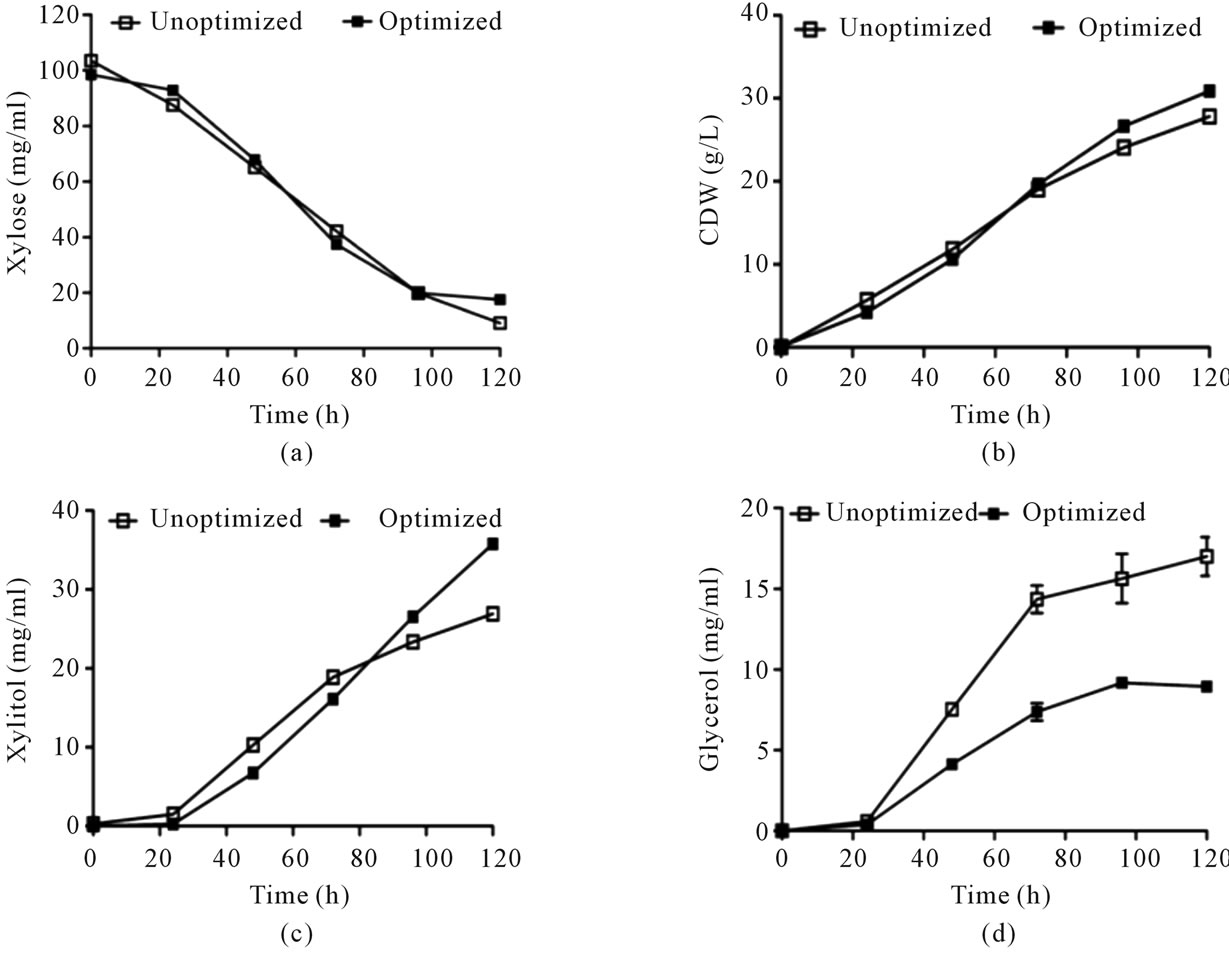
Figure 2. Kinetics of growth, xylose utilization and xylitol production under optimized and unoptimized conditions. (a) Cell growth profile; (b) Utilization of xylose and (c) Xylitol production and (d) Glycerol production. Error bars represent ± SD.
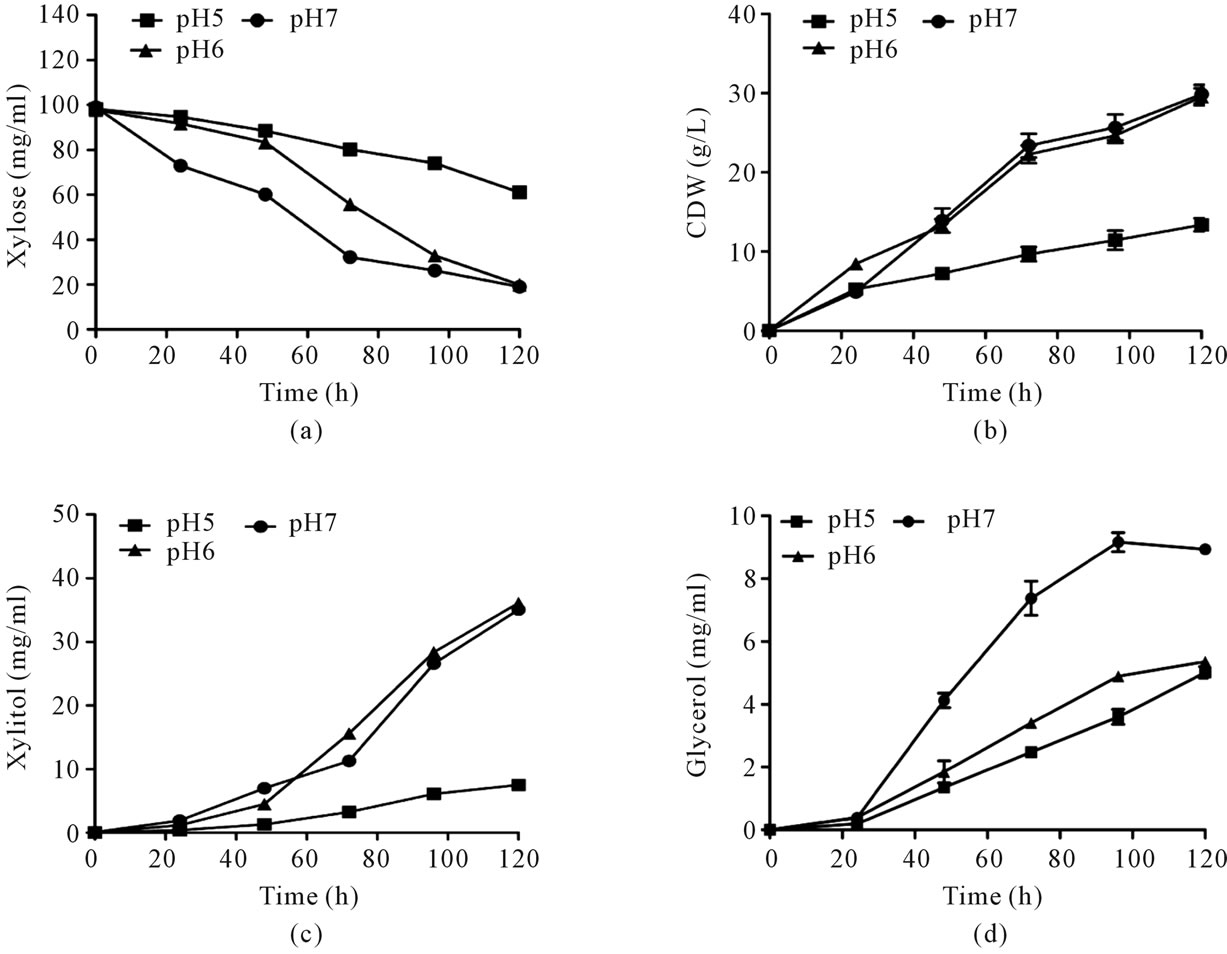
Figure 3. Effect of pH on xylose utilization and xylitol production by Debaryomyces nepalensis NCYC 3413. The organism was grown under various initial pHs. (a) Cell growth profile; (b) Substrate consumption profile; (c) Xylitol production and (d) Glycerol production. Error bars represent ± SD.
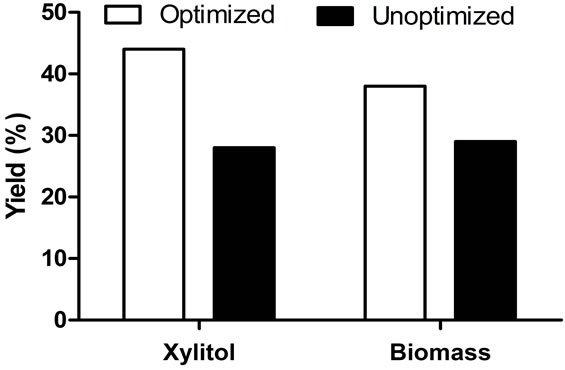
Figure 4. Comparison of xylitol and biomass yields under unoptimized and optimized conditions.
model was proved to be efficient. The significant parameters selected by Plackett burman screening experiments were xylose, K2HPO4 and ZnSO4. After optimization, the product concentration increased by 24.8% (increased from 27 to 36 g/l) when compared to the unoptimized medium. The interaction between these components was confirmed using response surface models. Therfore, it wasconcluded that the existing statistical models can successfully aid in the optimization of media components for increased xylitol production.
6. Acknowledgements
This work was supported by a research grant from the Department of Biotechnology, Government of India. KH and NS acknowledge CSIR and DBT for their fellowship.
REFERENCES
- X. Chen, “Microbial and Bioconversion Production of D-Xylitol and Its Detection and Application,” International Journal of Biological Sciences, Vol. 6, No. 7, 2010, pp. 834-844. doi:10.7150/ijbs.6.834
- R. L. Plackett and J. P. Burman, “The Design of Optimum Multifactorial Experiments,” Biometrika, Vol. 33, No. 4, 1946, pp. 305-325. doi:10.2307/2332195
- J. M. Dominguez, C. S. Gong and G. T. Tsao, “Production of Xylitol from D-Xylose by Debaryomyces hansenii,” Applied Biochemistry and Biotechnology, Vol. 63-65, 1997, pp. 117-127. doi:10.1007/BF02920418
- F. K. Agbogbo, G. Coward-Kelly, M. Torry-Smith and K. S. Wenger, “Fermentation of Glucose/Xylose Mixtures Using Pichia Stipitis,” Process Biochemistry, Vol. 41, No. 11, 2006, pp. 2333-2336. doi:10.1016/j.procbio.2006.05.004
- L. Preziosi-Belloy, V. Nolleau, and J. M. Navarro, “Fermentation of Hemicellulosic Sugars and Sugar Mixtures to Xylitol By Candida Parapsilosis,” Enzyme Microbial Technology, Vol. 21, 1997, pp. 124-129. doi:10.1016/S0141-0229(96)00247-5
- B. C. Saha “Hemicellulose Bioconversion,” Journal of Industrial Microbiology and Biotechnology, Vol. 30, 2003, pp. 279-291. doi:10.1007/s10295-003-0049-x
- S. Sanchez, V. Bravo, E. Castro, A. J. Moya and F. Camacho, “The Fermentation of Mixtures of D-Glucose and D-Xylose by Candida shehatae, Pichia stipitis and Pachysolen tannophilus to Produce Ethanol,” Journal of Chemical Technology and Biotechnology, Vol. 77, No. 6, 2002, pp. 641-648. doi:10.1002/jctb.622
- P. Nigam and D. Singh, “Processes of Fermentative Production of Xylitol—A Sugar Substitute,” Process Biochemistry, Vol. 30, No. 2, 1995, pp. 117-124. doi:10.1016/0032-9592(95)80001-8
- S. N. Gummadi and D. S. Kumar, “Pectin Lyase and Pectate Lyase from Debaryomyces nepalensis Isolated from Apple,” Research Journal of Microbiology, Vol. 1, No. 2, 2006, pp. 152-159. doi:10.3923/jm.2006.152.159
- S. Kumar and S. N. Gummadi, “Metabolism of Glucose and Xylose as Single and Mixed Feed in Debaryomyces nepalensis NCYC 3413: Production of Industrially Important Metabolites,” Applied Microbiology and Biotechnology, Vol. 89, No. 5, 2011, pp. 1405-1415. doi:10.1007/s00253-010-2997-1
- D. Kandelman and G. Gagnon, “A 24-Month Clinical Study of the Incidence and Progression of Dental Caries in Relation to Consumption of Chewing Gum Containing Xylitol in School Preventive Programs,” Journal of Dental Research, Vol. 69, No. 11, 1990, pp. 1771-1775. doi:10.1177/00220345900690111201
- P. T. Mattila, M. J. Svanberg, T. Jamsa and M. L. E. Knuuttila, “Improved Bone Biomechanical Properties in Xylitol-Fed Aged Rats,” Metabolism, Vol. 51, No. 1, 2002, pp. 92-96.
- P. T. Mattila, M. J. Svanberg, T. Jamsa and M. L. E. Knuuttila, “Increased Bone Volume and Bone Mineral Content in Xylitol Fed Rats,” Gerentology, Vol. 47, No. 6, 2001, pp. 300-305. doi: 10.1159/000052818
- S. Kumar and S. N. Gummadi, “Purification and Biochemical Characterization of a Moderately Halotolerant NADPH Dependent Xylose Reductase from Debaryomyces nepalensis NCYC 3413,” Bioresource Technology, Vol. 102, No. 20, 2011, pp. 9710-9717. doi:10.1016/j.biortech.2011.07.030
- A. Maguire and A. J. Rugg-Gunn, “Xylitol and Caries Prevention—Is It a Magic Bullet?” British Dental Journal, Vol. 194, No. 8, 2003, pp. 429-436. doi:10.1038/sj.bdj.4810022
- S. S. Silva and A. S. Afschar, “Microbial Production of Xylitol from D-Xylose Using Candida tropicalis,” Bioprocess Engineering, Vol. 11, 1994, pp. 129-134. doi:10.1007/BF00518734
- R. Ylikahri, “Metabolic and Nutritional Aspects of Xylitol,” In: C. O. Chicester, Ed., Advances in Food Research, Vol. 25, Academic Press, Inc., New York, 1979, pp. 159- 180.
- B. J. Naveena, M. Altaf, K. Bhadriah and G. Reddy, “Selection of Medium Components by Plackett-Burman Design for Production of l(+) Lactic Acid by Lactobacillus amylophilus GV6 in SSF Using Wheat Bran,” Bioresource Technology, Vol. 96, No. 4, 2005, pp. 485-490. doi:10.1016/j.biortech.2004.05.020
- T. Ayse and E. Mubeccel, “Use of Experimental Design Method to Investigate Metal Ion Effects in Yeast Fermentations,” Journal of Chemical Technology and Biotechnology, Vol. 82, No. 1, 2007, pp. 11-15. doi: 10.1002/jctb.1616
- S. S. Dash and S. N. Gummadi, “Enhanced Biodegradation of Caffeine by Pseudomonas sp. Using Response Surface Methodology,” Biochemical Engineering Journal, Vol. 36, No. 3, 2007, pp. 288-293. doi:10.1016/j.bej.2007.03.002
- S. N. Gummadi, K. B. Ganesh and D. Santhosh, “Enhanced Degradation of Caffeine by Immobilized Cells of Pseudomonas sp. in Agar-Agar Matrix Using Statistical Approach,” Biochemical Engineering Journal, Vol. 44, No. 2-3, 2009, pp. 136-141. doi:10.1016/j.bej.2008.11.010
- S. N. Gummadi and D. S. Kumar, “Optimization of Chemical and Physical Parameters Affecting the Activity of Pectin Lyase and Pectate Lyase from Debaryomyces nepalensis: A Statistical Approach,” Biochemical Engineering Journal, Vol. 30, 2006, pp. 130-137. doi:10.1016/j.bej.2006.02.014
- R. M. A. Abedin and H. M. Taha, “Antibacterial and Antifungal Activity of Cyanobacteria and Green Microalgae. Evaluation of Medium Components by PlacketBurman Design for Antimicrobial Activity of Spirulina platensis,” Global Journal of Biotechnology and Biochemistry, Vol. 7, No. 3, 2008, pp. 22-31.
- C. Xiong, C. Shouwen, S. Ming and Y. Ziniu, “Medium Optimization by Response Surface Methodology for Poly-g-Glutamic Acid Production Using Dairy Manure as the Basis of a Solid Substrate,” Applied Microbiology and Biotechnology, Vol. 69, 2005, pp. 390-396. doi:10.1007/s00253-005-1989-z
- S. Yeruva, S. Mantha, A. Tirumalaraju and S. R. Rokkam, “Screening of Medium Components for Polyribosyl Ribitol Phosphate Production by Haemophilus influenzae Type-B Using Plackett-Burman Design,” Cell and Tissue Research, Vol. 10, No. 3, 2010, pp. 2349-2352.
- Y. Li, Z. Zhang, Z. Lei, Y. Yang, M. Utsumi and N. Sugiura, “Influence of Metal Addition on Ethanol Production with Pichia stipitis ATCC 58784,” Journal of Industrial Microbiology and Biotechnology, Vol. 36, 2005, pp. 491-497. doi:10.1007/s10295-008-0518-3
- B. R. Gibson, “Improvement of Higher Gravity Brewery Fermentation via Wort Enrichment and Supplementation,” Journal of Institute of Brewing, Vol. 117, No. 3, 2011, pp. 268-284.
- H. Ling, K. Chen, J. Ge and W. Ping, “Statistical Optimization of Xylitol Production from Corncob Hemicellulose Hydrolysate by Candida tropicalis HDY-02,” New Biotechnology, Vol. 28, 2011, pp. 673-678. doi:10.1016/j.nbt.2010.05.004
- Y. Xiao-Binu, N. Joo-Heon, S. Y. Hyun and K. Yoon-Mo, “Optimization of Cellulase Production in Batch Fermentation by Trichoderma reesei,” Biotechnology and Bioprocess Engineering, Vol. 3, 1998, pp. 44-47.
- E. Vandeska, S. Amartey, S. Kuzmanova and T. Jeffries, “Effects of Environmental Conditions on Production of Xylitol by Candida boidinii,” World Journal of Microbiology and Biotechnology, Vol. 11, No. 2, 1995, pp. 213- 218. doi:10.1007/BF00704652
- V. Meyrial, J. P. Delgenes, R. Moletta and J. M. Navarro, “Xylitol Production from D-Xylose by Candida Guillermondii: Fermentation Behaviour,” Biotechnology Letters, Vol. 13, No. 4, 1991, pp. 281-286.
- W. M. Jurick II, I. Vico, V. L. Gaskins, K. A. Peter, E. Park, W. J. Janisiewicz and W. S. Conway, “Carbon, Nitrogen and pH Regulate the Production and Activity of a Polygalacturonase Isozyme Produced by Penicillium expansum,” Archives of Phytopathology and Plant Protection, Vol. 45, No. 9, 2012, pp. 1-14. doi:10.1080/03235408.2012.657893.
- J. A. Rollins and M. B. Dickman, “pH Signaling in Sclerotina sclerotiorum: Identification of a pacC/RIM1 Homolog,” Applied and Environmental Microbiology, Vol. 67, No. 1, 2001, pp. 75-81.
- A. Converti and J. M. Dominguez, “Influence of Temperature and pH on Xylitol Production from Xylose by Debaryomyces hansenii,” Biotechnology and Bioengineering, Vol. 75, No. 1, 2001, pp. 39-45. doi:10.1016/j.procbio.2005.08.019.
NOTES
*Corresponding author.