Graphene
Vol.3 No.1(2014), Article ID:42074,5 pages DOI:10.4236/graphene.2014.31001
Optimization of Micromechanical Cleavage Technique of Natural Graphite by Chemical Treatment
1Centro de Ciências Naturais e Humanas, Universidade Federal do ABC, São Paulo, Brazil
2Grupo de Óptica, Micro e Nanofabricação de Dispositivos (GOMNDI), Universidade Federal do Pampa, Rio Grande do Sul, Brazil
3Laboratório de Sistemas Integráveis do Departamento de Engenharia de Sistemas Eletrônicos da Escola Politécnica da USP (LSI-PSI/EPUSP), São Paulo, Brazil
Email: *l.torre.q@gmail.com
Copyright © 2014 Luis Torres et al. This is an open access article distributed under the Creative Commons Attribution License, which permits unrestricted use, distribution, and reproduction in any medium, provided the original work is properly cited. In accordance of the Creative Commons Attribution License all Copyrights © 2014 are reserved for SCIRP and the owner of the intellectual property Luis Torres et al. All Copyright © 2014 are guarded by law and by SCIRP as a guardian.
Received November 11, 2013; revised December 18, 2013; accepted January 8, 2014
KEYWORDS
Graphene; Micromechanical Cleavage; Raman Spectroscopy; Chemical Treatment
ABSTRACT
In this work, we report a method to improve the efficiency of the micromechanical cleavage technique to obtain few-layers graphene samples, from natural graphite flakes, which were previously submitted to two chemical treatment times with H2SO4 (17 and 25 hours). After the chemical treatment times, Raman spectroscopy reveals a hydrogenation of the few-layer graphene samples, which were obtained from the treated graphite flakes. To analyze the hydrogenation of the samples, the G and 2D bands of the Raman spectra of the treated and untreated samples were analyzed and compared, as well as the I(2D)/I(G) ratio, revealing a p-doping on the treated samples when compared with the untreated samples. Our studies could be of great importance to obtain larger and greater amount of few-layer graphene samples.
1. Introduction
Graphene, by its fabulous mechanical, electronic, thermal and optical properties, is one of the most promising candidates for the next generation of electronic materials [1]. However, for the study and application of graphene, the identification and characterization of this material are of vital importance. In this sense, Raman spectroscopy plays a very important role, since it is a non-destructive, fast and simple characterization technique. The Raman spectrum of graphene shows some characteristic bands that provide structural, electronic and vibrational information [2-5].
The G (~1582 cm−1) and 2D (~2700 cm−1) bands are the most prominent bands of the spectrum, whose position changes and full width half maximum (FWHM) can monitor the type of doping of the sample [4,6,7]. Additionally, the 2D band also presents significant changes in position, shape and FWHM for samples with different numbers of layers that make of the Raman spectroscopy a highly reliable technique for determining the number of layers of few-layer graphene samples [5,8,9].
It has recently attracted much attention to the resulting structure of the interaction between molecules of H2SO4 with few-layer graphene systems, due to their unusual properties. Theoretical studies between the interaction of H2SO4 and bilayer graphene systems (BLG) have reported the possibility of intercalating the individual molecules of H2SO4 between the graphene layers, given place to the charge transfer phenomena and increasing the distance between layers and variations of the electronic structure [10-13]. On the other hand, in a concentrated solution of H2SO4 (18M/98%) may also exist free H+ ions [11] that interact with the graphitic systems (graphite, graphene) and can form bonds with the π electrons of the carbon (C) atoms (C-H bonds), producing the hydrogenation of the system.
The hydrogenation has a surfactant effect on the process cleavage of graphite (reduction of the Van de Waals interaction between the adjacent layers) to obtain individual layers of graphene [14]. This effect can take advantage to increase the efficiency of the micromechanical cleavage technique in the preparation of few-layer graphene samples. Theoretical studies of hydrogenated graphene have shown that the hydrogen produces a p-doping on the graphene layers [15], as well as a significant structural change, and due to the hybridization, is no longer a purely trigonal planar (sp2) to acquire an intermediate character of the hybridization between sp2 and sp3 [16-19].
Additionally, the hydrogenated graphene was experimentally studied by Raman spectroscopy and the main reported characteristics were: 1) The G band position increases for increasing ǀEFǀ and saturates for high doping [4,7,19]; 2) Increasing of the 2D band position corresponds to p-doping, as predicted theoretically [4,7,15]; 3) The integrated intensity ratio I(2D)/I(G) decreases, because the doping generates an additional contribution on the electron scattering defect (increasing γ’), where the intensity of the 2D band is proportional to 1/γ’2 [15,20].
2. Experimental
First, 10.0 g of natural graphite (9950 GRAFLAKE of the National of Graphite—MG, Brazil) was immersed in 120 ml of concentrated H2SO4 (18M/98%) and mixture by magnetic stirring. Then, the graphite was extracted into two parts, the first (second) part was extracted after completing 17 (25) hours of magnetic stirring. Finally, the graphite was removed from H2SO4 and the two parts were filtered and rinsed with deionized water, and placed in a hot plate (approximately 50˚C) to eliminate the liquid wastes. Henceforward, the treated graphite samples were named G17 (G25) for 17 hours (25 hours) and the untreated graphite sample G0.
Few-layer graphene samples were obtained from graphite flakes G0, G17 and G25, by micromechanical cleavage, and placed on 30 substrates of Si/SiO2 (300 nm). In order to analyze the surfactant effect of the chemical treatment on graphite G0, which directly affects the number of samples obtained on each substrate, the number of layers (n) and type of doping on the samples were determined by Raman spectroscopy, using a spectrometer Jobin Yvon T64000 with a spectral resolution of 1 cm−1, in a simple mode with a grid of 1800 lines. The used solid-state laser was of 532 nm wavelength (2.33 eV), with a power output maintained at around 2 mW to avoid heating effect.
3. Results and Discussion
Mapping the 30 substrates, where the exfoliated graphite were deposited, it was found that: in the 10 substrates of the G0 graphite flake only ~5 few-layer graphene samples with an average size ≤ 10 μm. For the treated graphite flakes (G17 and G25) were obtained between 15 and 20 samples with an average size ≥ 10 μm. From these observations, we conclude that the chemical treatment of graphite flakes with H2SO4 produces a significant improvement on the micromechanical cleavage method, increasing considerably the efficiency to obtain few-layer graphene samples (above 300%).
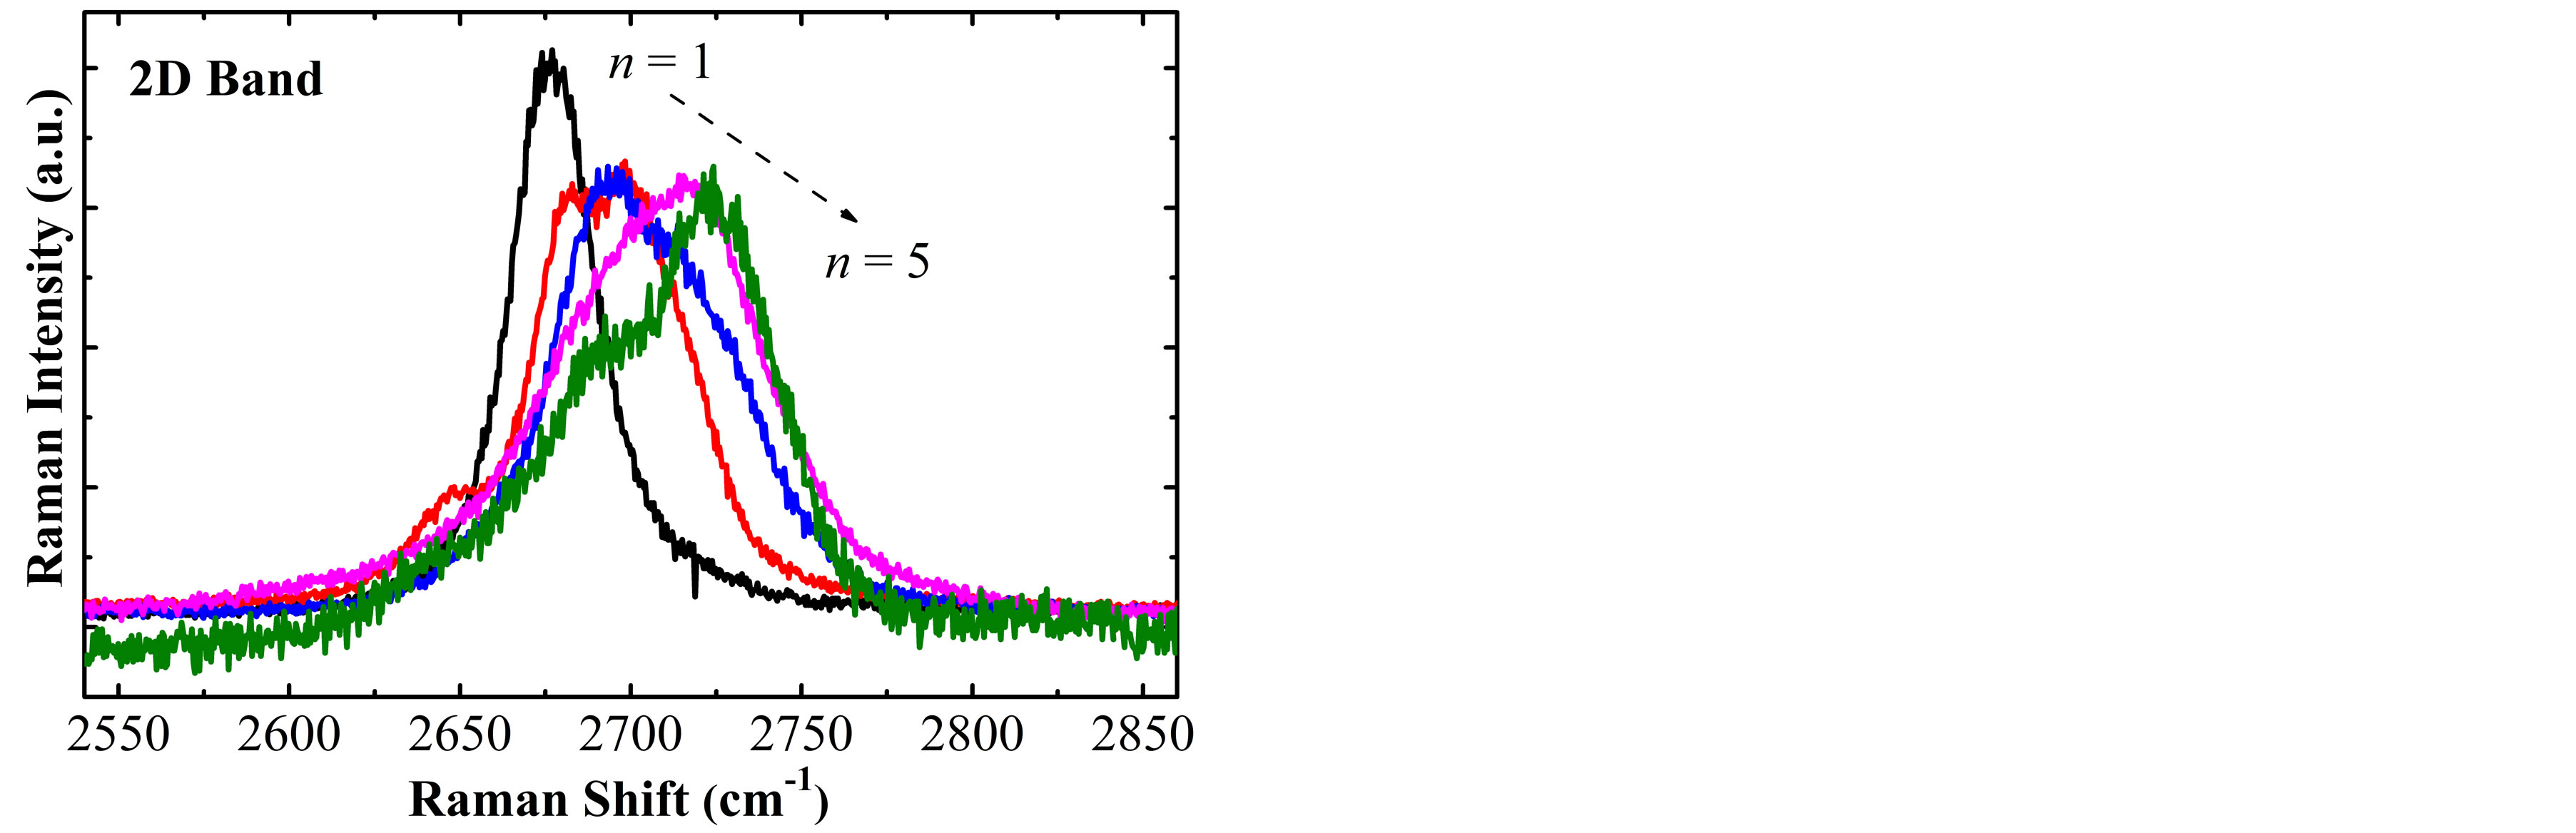
The number of layers (n) of the obtained samples have been determined analyzing the FWHM of the 2D band (FWHM2D), by Raman spectroscopy [9], it has seen that the FWHM2D has minimal changes after the chemical treatment and it is possible to identify samples from n = 1 to 5 layers. Figure 1(a) shows representative spectra from n = 1 to 5 of the obtained samples after exfoliation of the graphite G17, where one can see that as the number of layers increase, the 2D band is deformed as its FWHM increase, besides presenting a upshift. In order to quantify the FWHM2D and the upshift of the 2D band, this band was adjusted taking into account one Lorentzian function, as in [9], for each spectrum. The results are shown in Figure 1(b), by triangular (square) symbols, where we can see a variation of the FWHM2D (shift of the 2D band position) from 25.8 cm−1 (2675 cm−1) for n = 1 to 64.9 cm−1 (2711 cm−1) for n = 5.
Figure 2 shows the Raman spectra of monolayer graphene (SLG) samples obtained from the exfoliation of G0, G17 and G25 graphite flakes, called respectively M-0, M-17 and M-25, in which we can see that the G and 2D bands are respectively located at ~1586 cm−1 and ~2676 cm−1. On the other hand, Figure 3 shows the Raman spectra of bilayer graphene (BLG) samples B-0, B-17 and B-25, in which the G and 2D bands are respectively located at ~1584 cm−1 and ~2693 cm−1, where evidently the shape of the 2D band (contribution of 4 Lorentzian functions [3,5,21]) corresponds to BLG samples. The upper right inset in Figure 3 shows fitting of the 2D band for one spectrum.
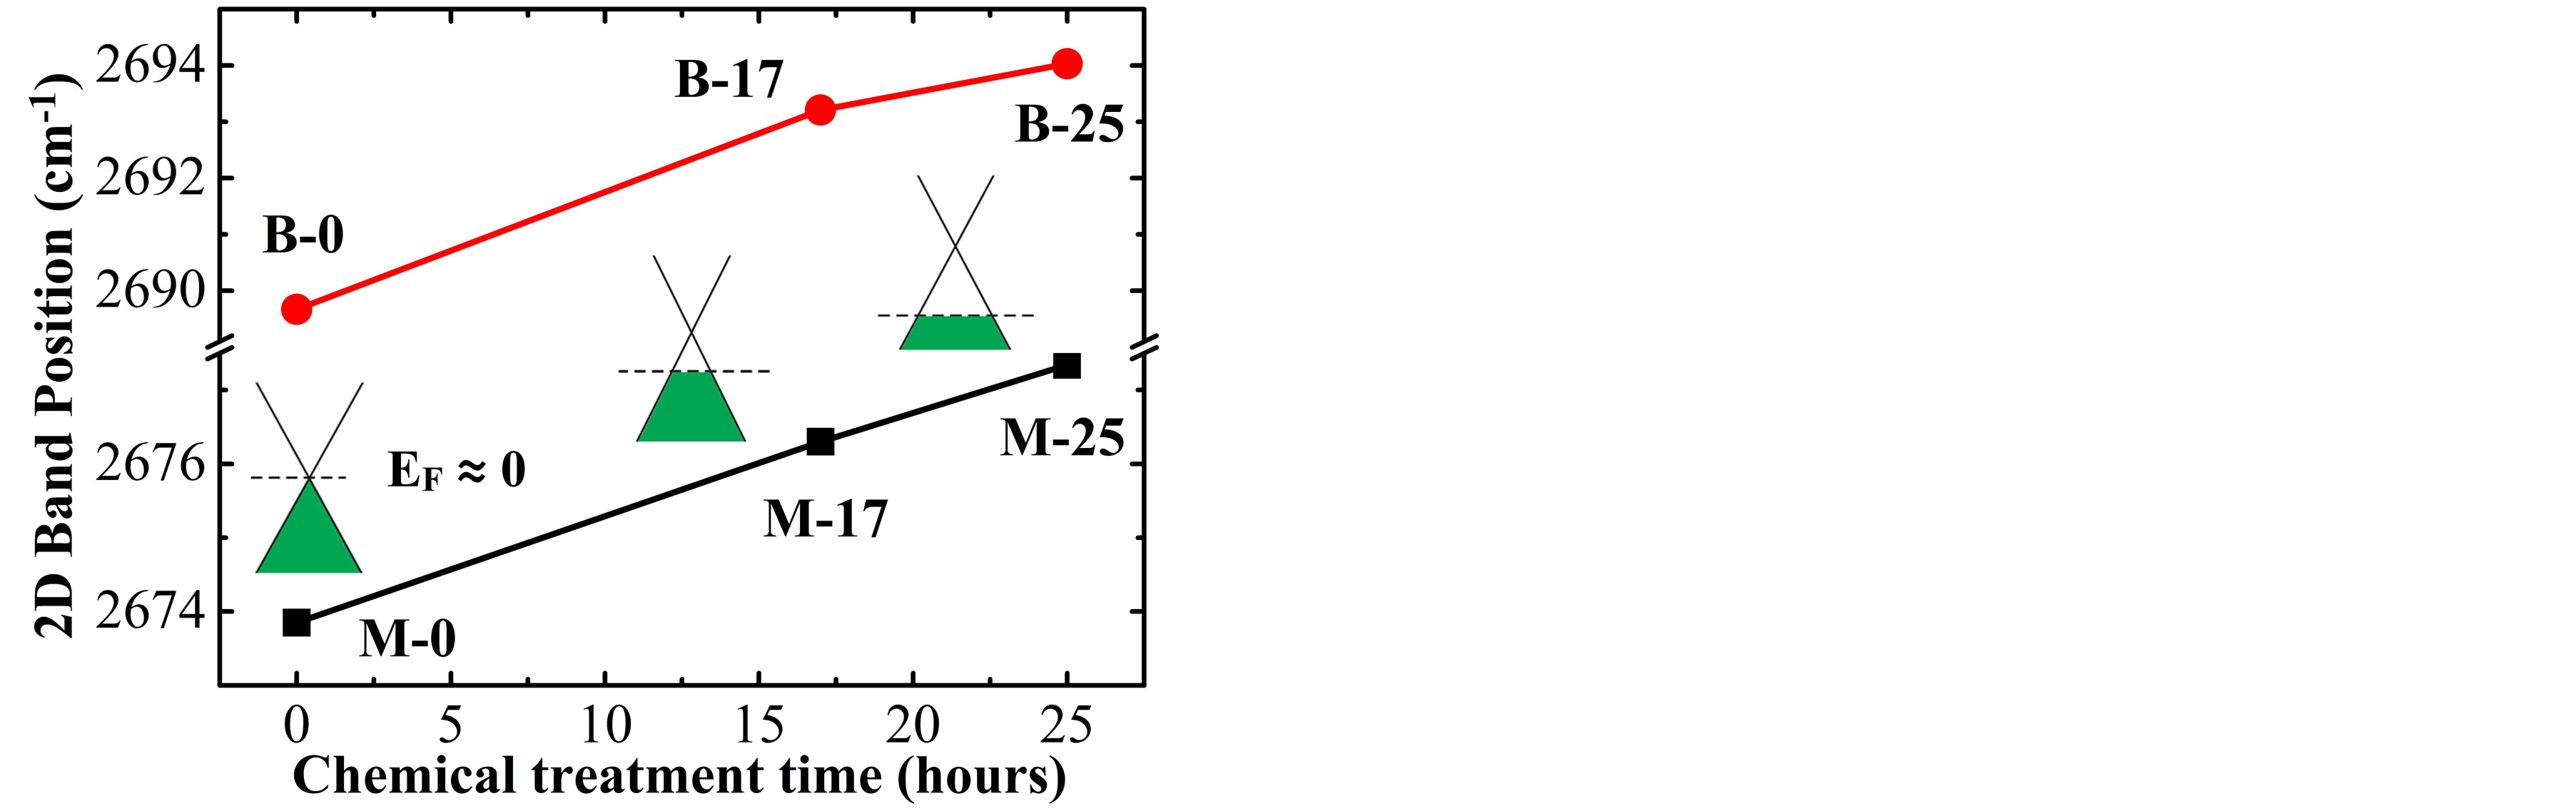
In order to have a better information of the effect of H2SO4 solution on the treated samples, the doping effect on the 2D band was analyzed in more detail on the Raman spectra of SLG and BLG. This band on the SLG (BLG) samples was fitted with a single Lorentzian function to obtain its center position, founding that for the higher treatment time, the 2D band undergoes a upshift of 3.5 cm−1 (4.4 cm−1), as shown in Figure 4(a). According to the literature [6,7], this kind of behavior corresponds to a p-doping, and is in accordance with the hydrogenation effect of graphite flakes [15], leaving therefore, a small concentration of H adsorbed atoms (inset in Figure 4(b)) in the samples after the exfoliation.
Another feature that indicates the doping effect is manifested by reduction of the integrated intensity ratio I(2D)/I(G) as the doping increase. Therefore, this ratio
 (a)
(a)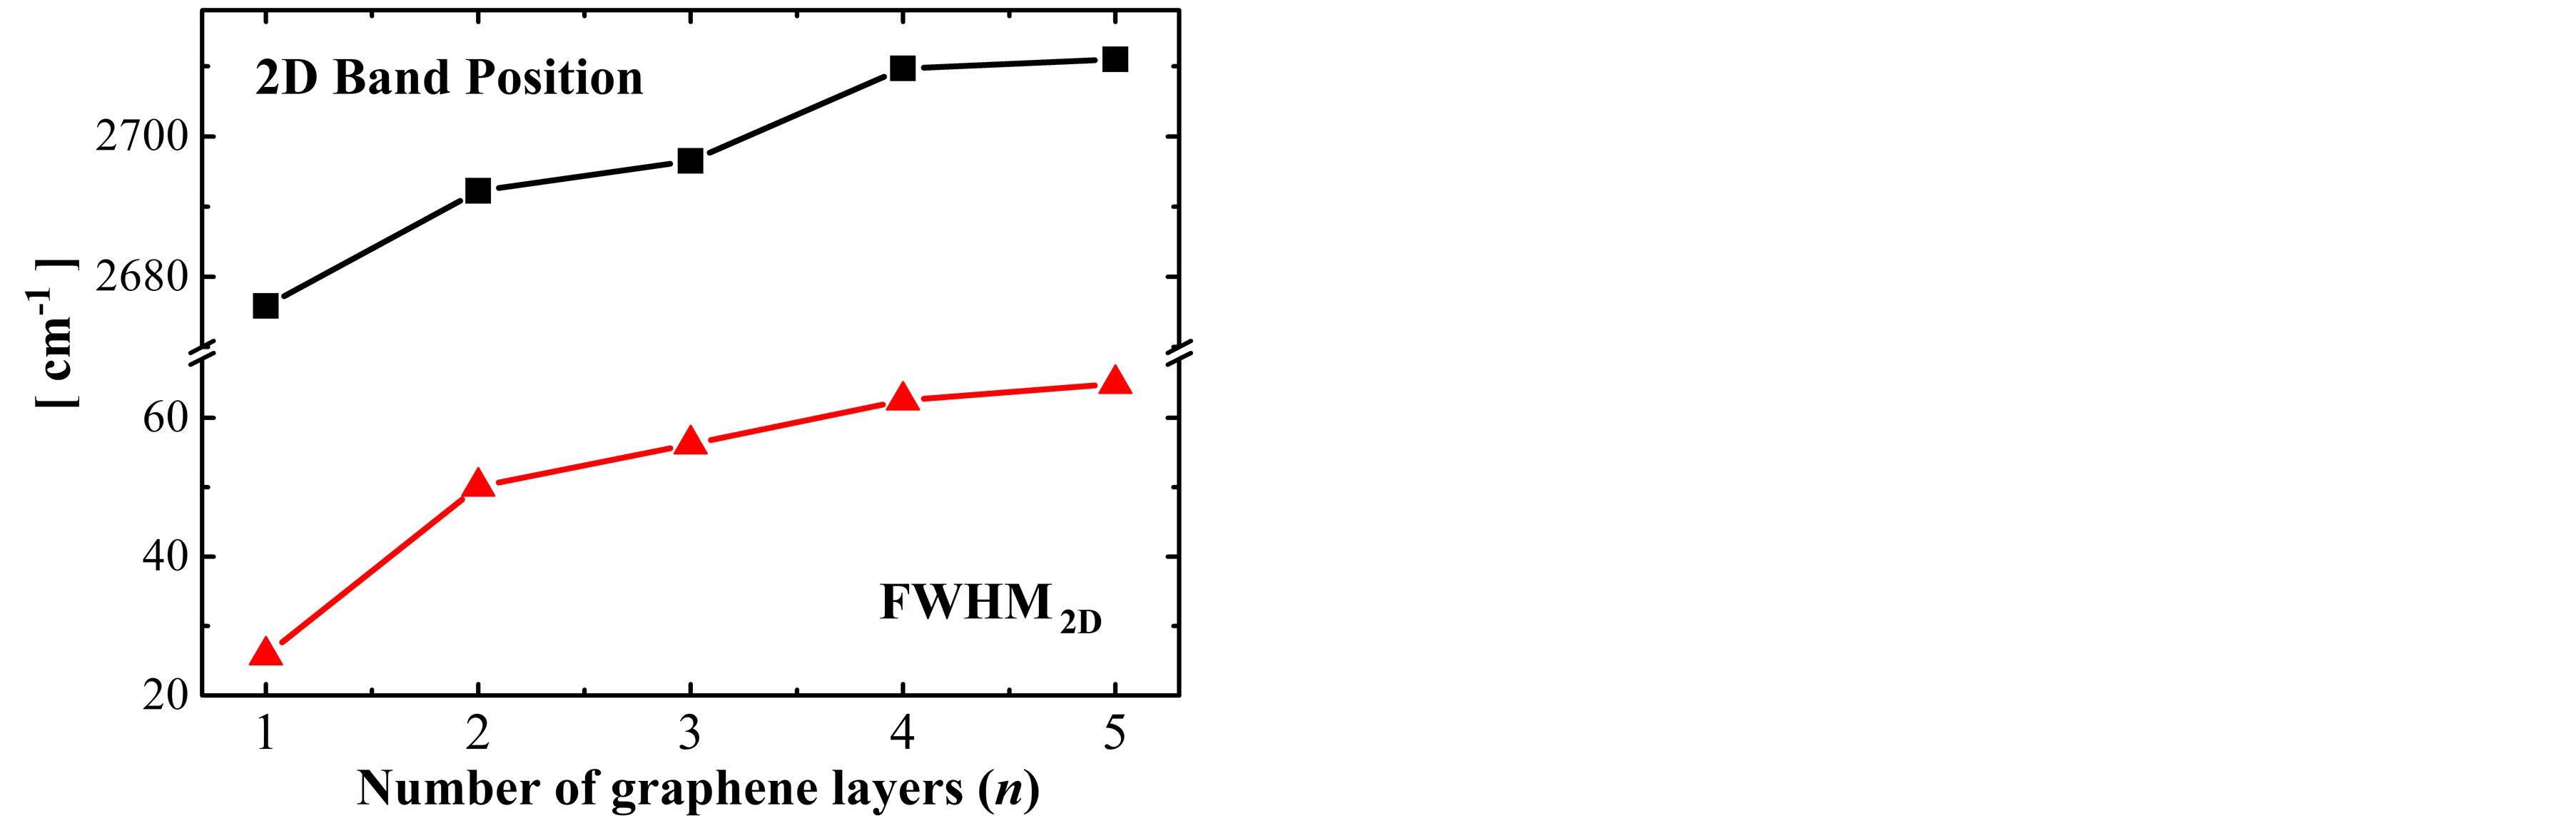 (b)
(b)
Figure 1. (a) 2D Band Raman spectra of samples with n = 1 to 5 graphene layers. The intensities of the Raman spectra have been modified for better viewing; (b) Dependence of the 2D band position and FWHM2D with the number of graphene layers.
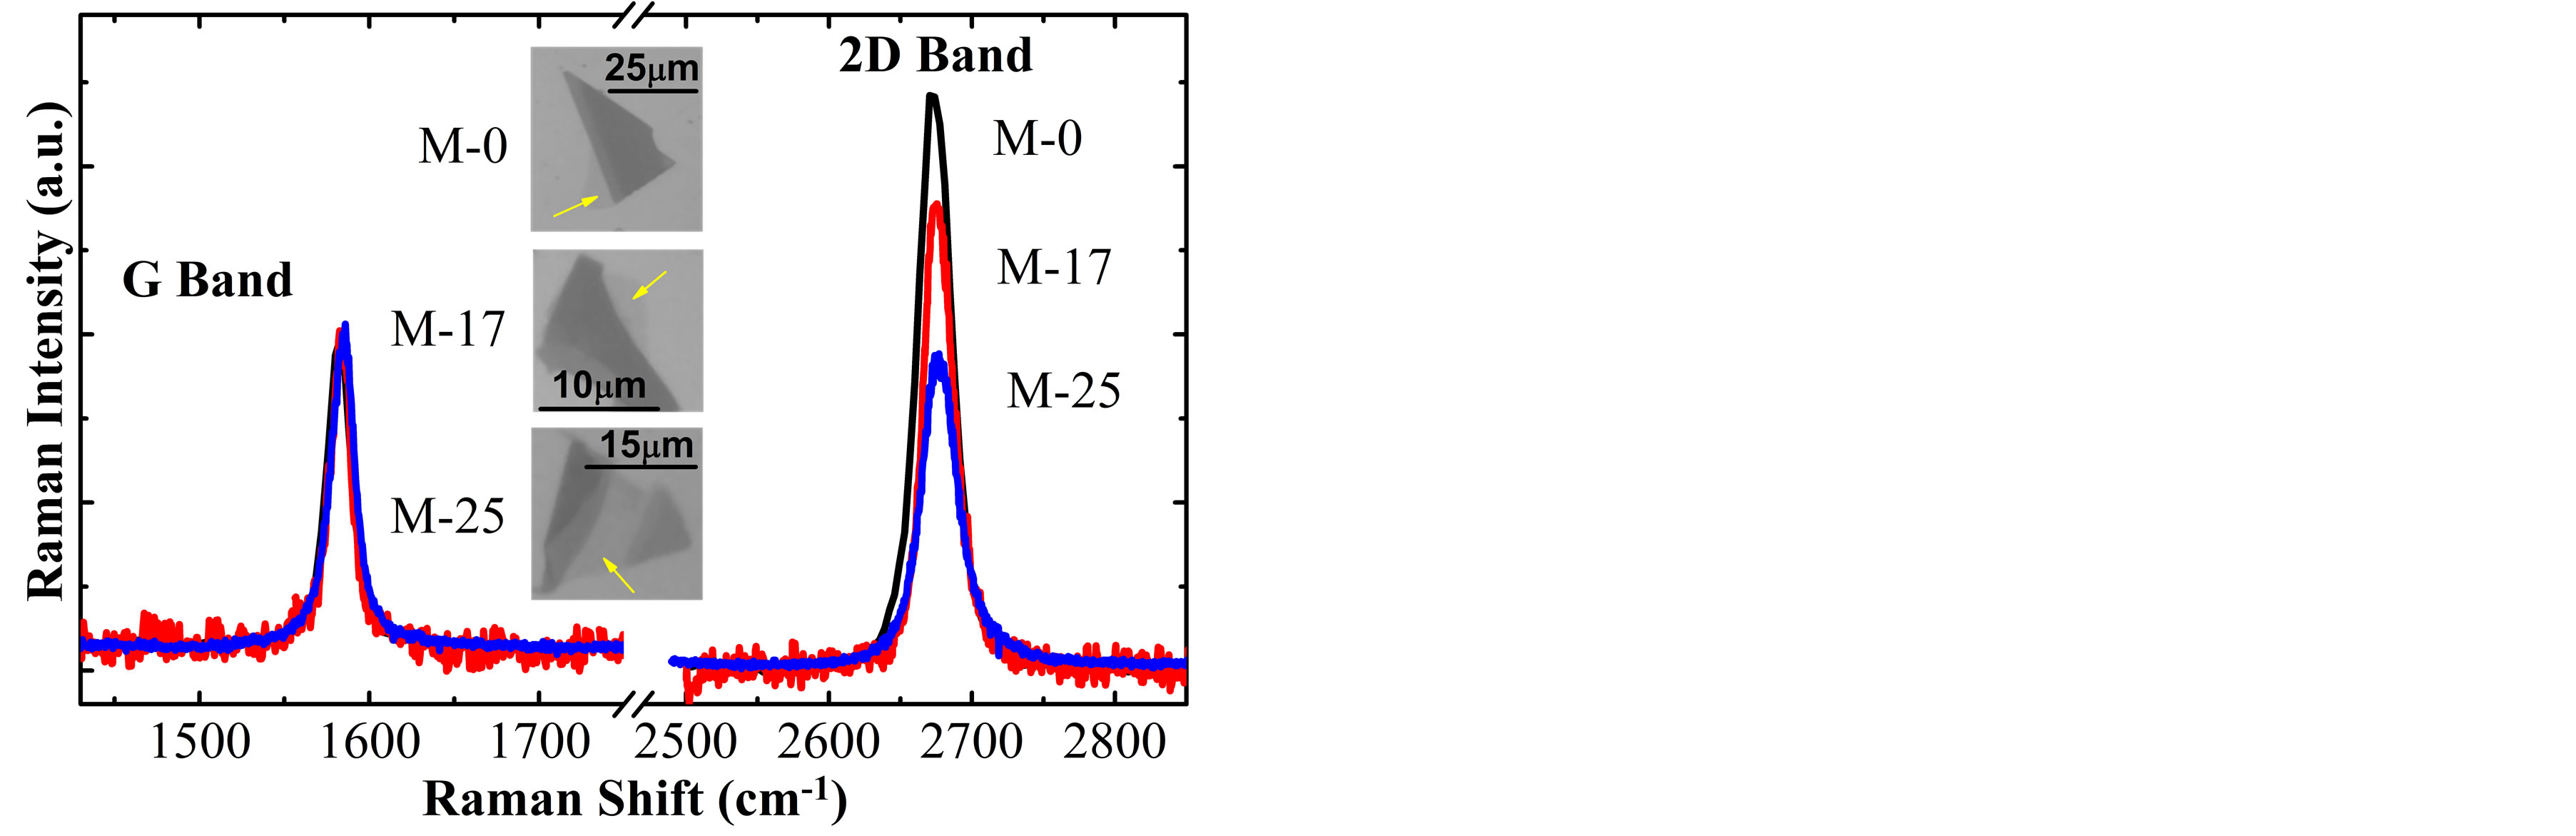
Figure 2. Raman spectra of SLG samples obtained by micromechanical cleavage technique of the graphite flakes G0, G17 and G25. The intensities of the G bands were normalized. The arrows on the optical image indicate the SLG samples.
was analyzed on the spectra of all samples, estimating the variation of the Fermi energy using a relation reported at the literature [7]. For the M-0 sample the I(2D)/I(G) ratio is ~3.12, which is approximately to the value reported by A. Das et al. [7] for EF ≈ 0 (null
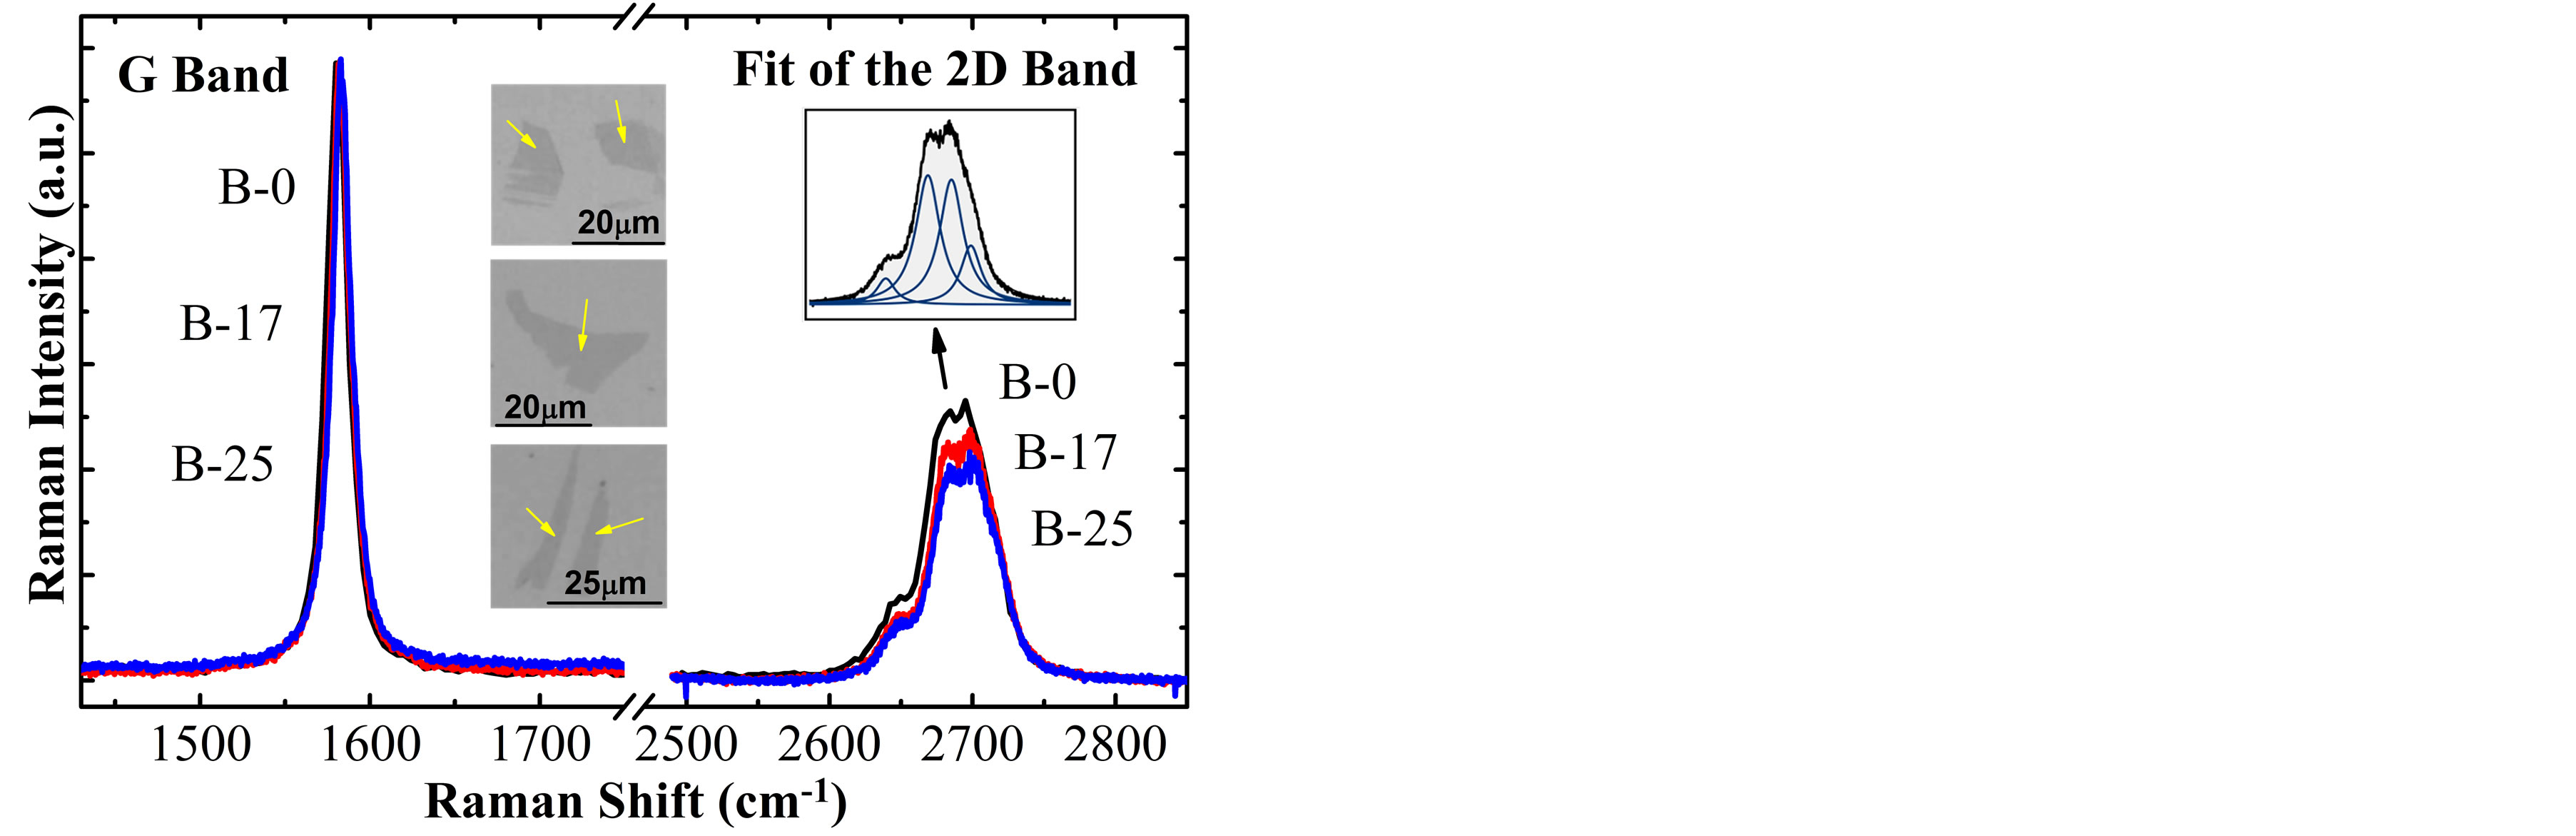
Figure 3. Raman spectra of BLG samples obtained by micromechanical cleavage technique of the graphite flakes G0, G17 and G25. The intensities of the G bands were normalized. The arrows on the optical image indicate the BLG samples.
 (a)
(a)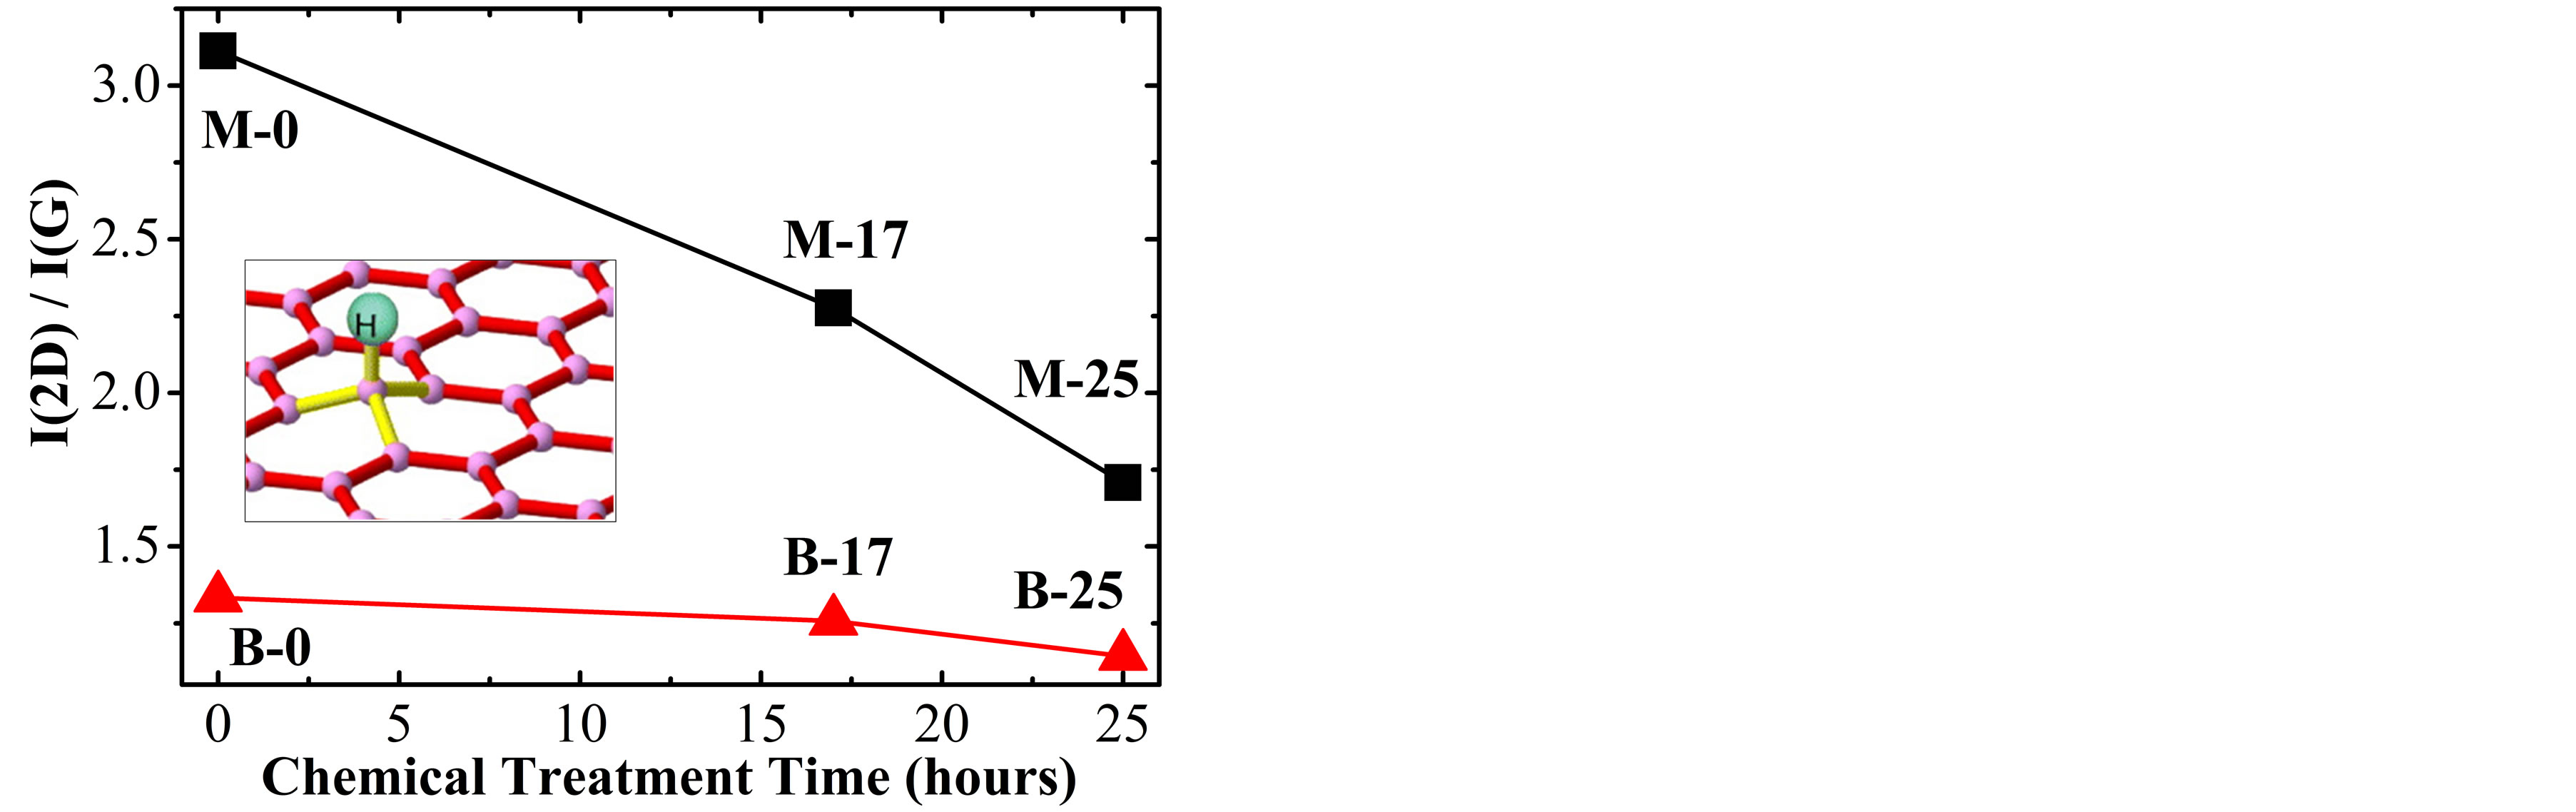 (b)
(b)
Figure 4. (a) Dependence of the 2D band position and (b) Integrated intensity ratio I(2D)/I(G) for SLG (M-0, M-17 and M-25) and BLG (B-0, B-17 and B-25) samples with the treatment time in H2SO4. Insets in (a) show changes of the Fermi energy for the p-doping effect on SLG samples. The inset in (b) shows a schematic representation of the twodimensional structure deformation of graphene when a hydrogen atom (H) is adsorbed on the network.
electron concentration); for sample M-17 (M-25) this ratio is ~2.28 (~1.17), as shown by the square symbols in Figure 4(b). According to the work of A. Das et al. [7], these results correspond to Fermi energy of about −110 meV for M-17 and −410 meV for M-25. In the insets of Figure 4(a) is schematically represented, changing of the Fermi energy with the chemical treatment time for the three monolayer samples (M-0, M-17 and M-25).
Similar analyses were done for BLG samples, obtaining a small decrease of the I(2D)/I(G) parameter with the chemical treatment time. For instance, the values for B-0, B-17 and B-25 samples were respectively 1.33, 1.25 and 1.14 as shown by the triangular symbols in Figure 4(b). These values are also very close to that reported in another studies of A. Das et al., doping the bilayer system using an electrochemically top-gated transistor [4].
4. Conclusion
We report a chemical method to optimize the micromechanical cleavage technique to obtain a larger and greater amount of few-layer graphene samples, taking advantage of the surfactant effect of the treatment of graphite with H2SO4. Studies by Raman spectroscopy revealed that the SLG and BLG samples obtained from the treated graphite exhibit a p-doping, and characteristics of the Raman spectra reinforce the idea of certain concentration of H atoms adsorbed on the surface of the SLG and BLG samples. Additional measurements, such as infrared spectroscopy and DRX, would be necessary to be sure of the hydrogenation in our samples.
Acknowledgements
We thank Professors C. Rettori and A. Champi for their initial contributions to this research. Universidade Federal do ABC (UFABC), FAPESP and CAPES agencies for the financial support.
REFERENCES
- K. S. Novoselov, A. K. Geim, S. V. Morozov, D. Jiang, Y. Zhang, S. V. Dubonos, I. V. Grigorieva and A. A. Firsov, “Electric Field Effect in Atomically Thin Carbon Films,” Science, Vol. 306, No. 5696, 2004, pp. 666-669. http://dx.doi.org/10.1126/science.1102896
- F. Banhart, J. Kotakoski and A. V. Krasheninnikov, “Structural Defects in Graphene,” ACS Nano, Vol. 5, No. 26, 2011, pp. 26-41. http://dx.doi.org/10.1021/nn102598m
- M. Begliarbekov, O. Sul, S. Kalliakos, E.-H. Yang and S. Strauf, “Determination of Edge Purity in Bilayer Graphene Using μ-Raman Spectroscopy,” Applied Physics Letters, Vol. 97, No. 3, 2010, Article ID: 031908. http://dx.doi.org/10.1063/1.3464972
- A. Das, B. Chakraborty, S. Piscanec, S. Pisana, A. K. Sood and A. C. Ferrari, “Phonon Renormalization in Doped Bilayer Graphene,” Physical Review B, Vol. 79, No. 15, 2009, Article ID: 155417. http://dx.doi.org/10.1103/PhysRevB.79.155417
- A. C. Ferrari, J. C. Meyer, V. Scardaci, C. Casiraghi, M. Lazzeri, F. Mauri, S. Piscanec, D. Jiang, K. S. Novoselov, S. Roth and A. K. Geim, “Raman Spectrum of Graphene and Graphene Layers,” Physical Review Letters, Vol. 97, No. 18, 2006, Article ID: 187401. http://dx.doi.org/10.1103/PhysRevLett.97.187401
- S. Pisana, M. Lazzeri, C. Casiraghi, K. S. Novoselov, A. K. Geim, A. C. Ferrari and F. Mauri, “Breakdown of the Adiabatic Born-Oppenheimer Approximation in Graphene,” Nature Materials, Vol. 6, No. 3, 2007, pp. 198-201. http://dx.doi.org/10.1038/nmat1846
- A. Das, S. Pisana, B. Chakraborty, S. Piscanec, S. K. Saha, U. V. Waghmare, W. S. Novoselov, H. R. Krishnamurthy, A. K. Geim, A. C. Ferrari and A. K. Sood, “Monitoring Dopants by Raman Scattering in an Electrochemically Top-Gated Graphene Transistor,” Nature Nanotechnology, Vol. 3, No. 4, 2008, pp. 210-215. http://dx.doi.org/10.1038/nnano.2008.67
- A. Gupta, G. Chen, P. Joshi, S. Tadigadapa and P. C. Eklund, “Raman Scattering from High-Frequency Phonons in Supported n-Graphene Layer Films,” Nano Letters, Vol. 6, No. 12, 2006, pp. 2667-2673. http://dx.doi.org/10.1021/nl061420a
- Y. F. Hao, Y. Y. Wang, L. Wang, Z. H. Ni, Z. Q. Wang, R. Wang, C. K. Koo, Z. X. Shen and J. T. L. Thong, “Probing Layer Number and Stacking Order of Few-Layer Graphene by Raman Spectroscopy,” Small, Vol. 6, No. 2, 2010, pp. 195-200. http://dx.doi.org/10.1002/smll.200901173
- N. A. Cordero and J. A. Alonso, “The Interaction of Sulfuric Acid with Graphene and Formation of Adsorbed Crystals,” Nanotechnology, Vol. 18, No. 48, 2007. http://dx.doi.org/10.1088/0957-4484/18/48/485705
- I. G. Ayala, N. A. Cordero and J. A. Alonso, “Surfactant Effect of Sulfuric Acid on the Exfoliation of Bilayer Graphene,” Physical Review B, Vol. 84, No. 16, 2011, Article ID: 165424 . http://dx.doi.org/10.1103/PhysRevB.84.165424
- K. S. Novoselov, D. Jiang, F. Schedin, T. J. Booth, V. V. Khotkevich, S. V. Morozov and A. K. Geim, “Two-Dimensional Atomic Crystals,” Proceedings of the National Academy of Sciences of the USA, Vol. 102, No. 30, 2005, pp. 10451-10453. http://dx.doi.org/10.1073/pnas.0502848102
- S. Stankovich, D. A. Dikin, G. H. Dommett, K. M. Kohlhaas, E. J. Zimney, E. A. Stach, R. D. Piner, S. T. Nguyen and R. S. Ruoff, “Graphene-Based Composite Materials,” Nature, Vol. 442, 2006, pp. 282-286. http://dx.doi.org/10.1038/nature04969
- M. Boström and B. E. Sernelius, “Repulsive van der Waals Forces Due to Hydrogen Exposure on Bilayer Graphene,” Physical Review A, Vol. 85, No. 1, 2012, Article ID: 012508.http://dx.doi.org/10.1103/PhysRevA.85.012508
- D. C. Elias, R. R. Nair, T. M. G. Mohiuddin, S. V. Morozov, P. Blake, M. P. Halsall, A. C. Ferrari, D. W. Boukhvalov, M. I. Katsnelson, A. K. Geim and K. S. Novoselov, “Control of Graphene’s Properties by Reversible Hydrogenation,” Science, Vol. 323, No. 5914, 2009, pp. 610-613. http://dx.doi.org/10.1126/science.1167130
- Z. Q. Luo, T. Yu, K.-J. Kim, Z. H. Ni, Y. M. You, S. Lim, Z. X. Shen, S. Z. Wang and J. Y. Lin, “Thickness-Dependent Reversible Hydrogenation of Graphene Layers,” ACS Nano, Vol. 3, No. 7, 2009, pp. 1781-1788. http://dx.doi.org/10.1021/nn900371t
- A. Castellanos-Gomez, M. Wojtaszek, Arramel, N. Tombros and B. J. van Wees, “Reversible Hydrogenation and Bandgap Opening of Graphene and Graphite Surfaces Probed by Scanning Tunneling Spectroscopy,” Small, Vol. 8, No. 10, 2012, pp. 1607-1613. http://dx.doi.org/10.1002/smll.201101908
- D. W. Boukhvalov, “Hydrogen on Graphene: Electronic Structure, Total Energy, Structural Distortions and Magnetism from First-Principles Calculations,” Physical Review B, Vol. 77, No. 3, 2008, Article ID: 035427. http://dx.doi.org/10.1103/PhysRevB.77.035427
- C. Casiraghi, “Raman Intensity of Graphene,” Status Solidi B, Vol. 248, No. 11, 2011, pp. 2593-2597. http://dx.doi.org/10.1002/pssb.201100040
- Z. Q. Luo, T. Yu, Z. H. Ni, S. H. Lim, H. L. Hu, J. Z. Shang, L. Liu, Z. X. Shen and J. Y. Lin, “Electronic Structures and Structural Evolution of Hydrogenated Graphene Probed by Raman Spectroscopy,” The Journal of Physical Chemistry C, Vol. 115, No. 5, 2011, pp. 1422-1427. http://dx.doi.org/10.1021/jp107109h
- L. M. Malard, J. Nilsson, D. C. Elias, J. C. Brant, F. Plentz, E. S. Alves, A. H. Castro Neto and M. A. Pimenta, “Probing the Electronic Structure of Bilayer Graphene by Raman Scattering,” Physical Review B, Vol. 76, No. 20, 2007, pp. 201401-201404. http://dx.doi.org/10.1103/PhysRevB.76.201401
NOTES
*Corresponding author.