Graphene
Vol. 1 No. 2 (2012) , Article ID: 23935 , 6 pages DOI:10.4236/graphene.2012.12002
Morphological, Vibrational and Thermal Properties of Confined Graphene Nanosheets in an Individual Polymeric Nanochannel by Electrospinning
1Group of Polymers and nanomaterials, Laboratory of Solid state Physics, Faculty of Sciences Dhar el Mahraz, University Sidi Mohamed Ben Abdellah, Atlas Fez, Morocco
2iThemba LABS-National Research Foundation of South Africa, Somerset West, South Africa
Email: *khenfouch@yahoo.fr, baitoul@yahoo.fr
Received July 5, 2012; revised August 7, 2012; accepted September 25, 2012
Keywords: Graphene; PEO; Nanocomposites; Confinement; Electrospinning; Nanofiber
ABSTRACT
Graphene is a single layer of carbon atoms arranged in a two dimension hexagonal lattice. It appeared very quickly that this exceptional material had truly outstanding electronic, mechanical, thermal and optical properties. The main goal of this work is the confinement of graphene nanosheets in an individual polymeric nanofiber and the study of their vibrational and thermal properties in one dimension. After their preparation, graphene sheets were mixed with Polyethylene oxide (PEO) solution to be electrospinned. The synthesized nanofibers were systematically investigated by Fourier transform infrared spectroscopy (FTIR) and Raman spectroscopy measurements and their morphology and structure were characterized by atomic force microscopy (AFM), optical microscope and Scanning Electron Microscope (SEM) and finally thermogravimetric analysis (TGA) to check G/PEO mass ratio and interactions to prove the capability of PEO to be a good envelope for the confinement and the alignment of graphene nanosheets in a one dimensional system.
1. Introduction
Graphene, which has been considered a “rising star” material, has attracted considerable attention from both the experimental and theoretical scientific communities [1]. Because of their novel properties [2,3], such as exceptional thermal, mechanical properties and high electrical conductivity, graphene sheets have been extensively used in synthesizing nanocomposites and fabricating various microelectrical devices like field-effect transistors [4] ultrasensitive sensors [5], transparent conductors [6], electromechanical resonators [7], energy storage and photovoltaic devices [8,9].
One of the best ways for producing graphene suspendsion is overcoming the enormous Van der Waals-like forces between graphite layers to yield a complete exfoliation of graphite flakes and dispersing the resultant graphene sheets solution [10]. To accelerate the use of graphene and tailor its properties, various processing techniques such as film and paper depositions, surface modifications are well istablished and moreover the edge’s functionalization chemistry is known [10].
In this work we have used Electrospinning, the method of producing fibers with diameters in the range of 10 nm to 10 µm by accelerating a charged polymer jet in an electric field [11,12]. This method has attracted much attention due to the ease with which such nanofibers can be produced from either natural or synthetic polymers. Such fibers have numerous and diverse applications including filtration and as composite materials. The large surface area to volume ratio of nanofibers makes them attractive as catalyst supports, sensors, drug delivery application and in tissue engineering [13]. Poly (ethylene oxide) (PEO) is used in this work due its low ionic conductivity (10−8 S/cm) and thermal stability. Our presented project may open the way for many applications by employing the confinement of graphene sheets in one dimensional nanochannel via a polymeric envelope removable by heat treatment or Ultra-Violet lithography.
2. Experimental
We have synthesized graphene solutions using our modified hummer’s method [14], starting with graphite oxidation, followed by the reduction with hydrazine hydrate of the produced graphene oxide and washing with distilled water. The chemically modified graphene was dispersed in water after its filtration. The resulting dispersions were homogeneous and stable, having a dark ink like appearance. The required amount of PEO was added to the graphene dispersion and stirred using magnetic stirrer for approximately 6 hours. The polymer concentration in water was maintained in 10% (wt) so that the solution can be easily electrospuned to obtain nanofibers with small size and good morphology. Solutions with the loading of graphene sheets, 1%, 3%, 5% and 7% were prepared by adding different PEO weight in graphene dispersion. The electrospinning process was carried out at room temperature. The solution was loaded into a syringe with needle of 0.5 mm in diameter, at electric field strength of 1 KV/cm, applied for only one second to separate the individual fibers obtained on different substrates (aluminum foil, glass slide) placed on the grounded plate. The average PEO fiber diameter was found to be between 500 and 1000 nm.
To analyse our prepared samples we used Bruker Sentarra RAMAN spectrometer, Bruker Vertex 70 Fourier transform infrared (FTIR) Spectrometer, Nanosurf Atomic Force Microscopy (AFM), Nova NanoSEM Scanning Eelectron Microscope, a high resolution Optical Microscope and SETARAM Thermogravimetric Analyzer (TGA).
3. Results and Discussion
3.1. Morphology Analysis
The morphology of the electrospun fibers was investigated using AFM and SEM, as indicated in Figures (1) and (2). The isolated fibers found to be smooth and moreover aligned. The length (L) furthermore the diameter (d) of each nanofiber was measured using an atomic force microscopy, scanning electron microscopy (SEM) and optical microscopy to determine the optimum process parameters as well as confirming the existence of graphene nanosheets into the nanofibers (Figure 3). All measurements were performed at room temperature. The average diameter distributions are shown in Figure 3.
3.1.1. AFM Images
The atomic force microscopy (AFM) was used to further observe the surface structures of the composite nanofibers. Scanning was carried out in tapping mode. All images were obtained at ambient conditions. Figure 1 confirms the isolation of the individual nanofiber synthesized by electrospinning, also revealed that the electrospun nanofiber is smooth with the absence of beads, proving that PEO was dissolved completely and the solution was homogenous enough to electrospinning. On the other hand, AFM image confirm that the electrospinning parameters used were suitable for generating smooth and highly aligned nanofibers.
3.1.2. SEM Images
Typical SEM image of G/PEO composite fiber is shown in Figure 2. No defects in the form of beads are observed in the fibers and their diameters range from 100 nm to 1.2 µm. SEM Image depict both good morphology and
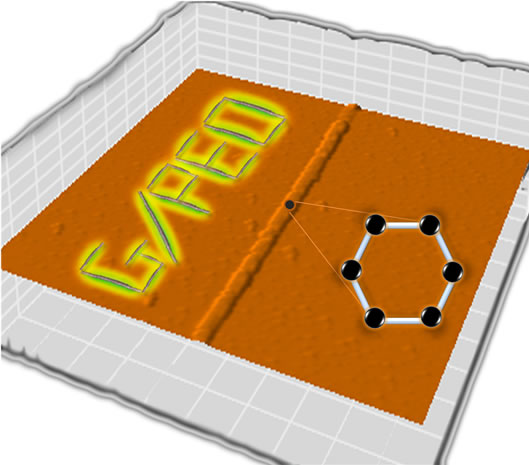
Graphical abstract
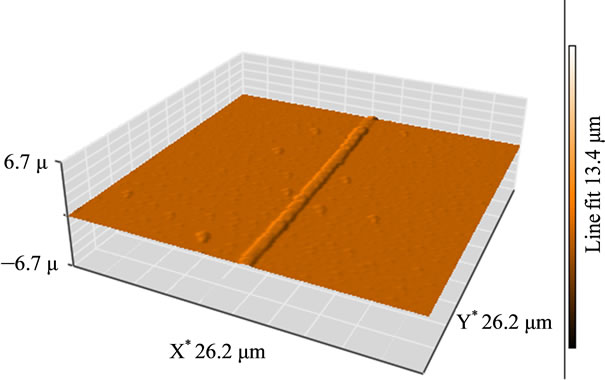
Figure 1. AFM image shows an individual G/PEO nanofiber.
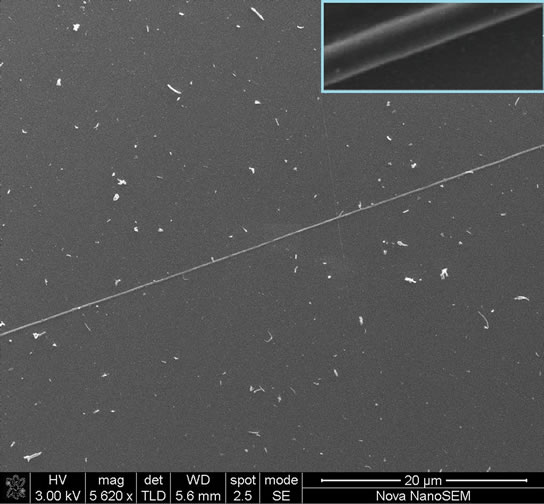
Figure 2. SEM image shows one isolated G/PEO nanofiber in large free space.
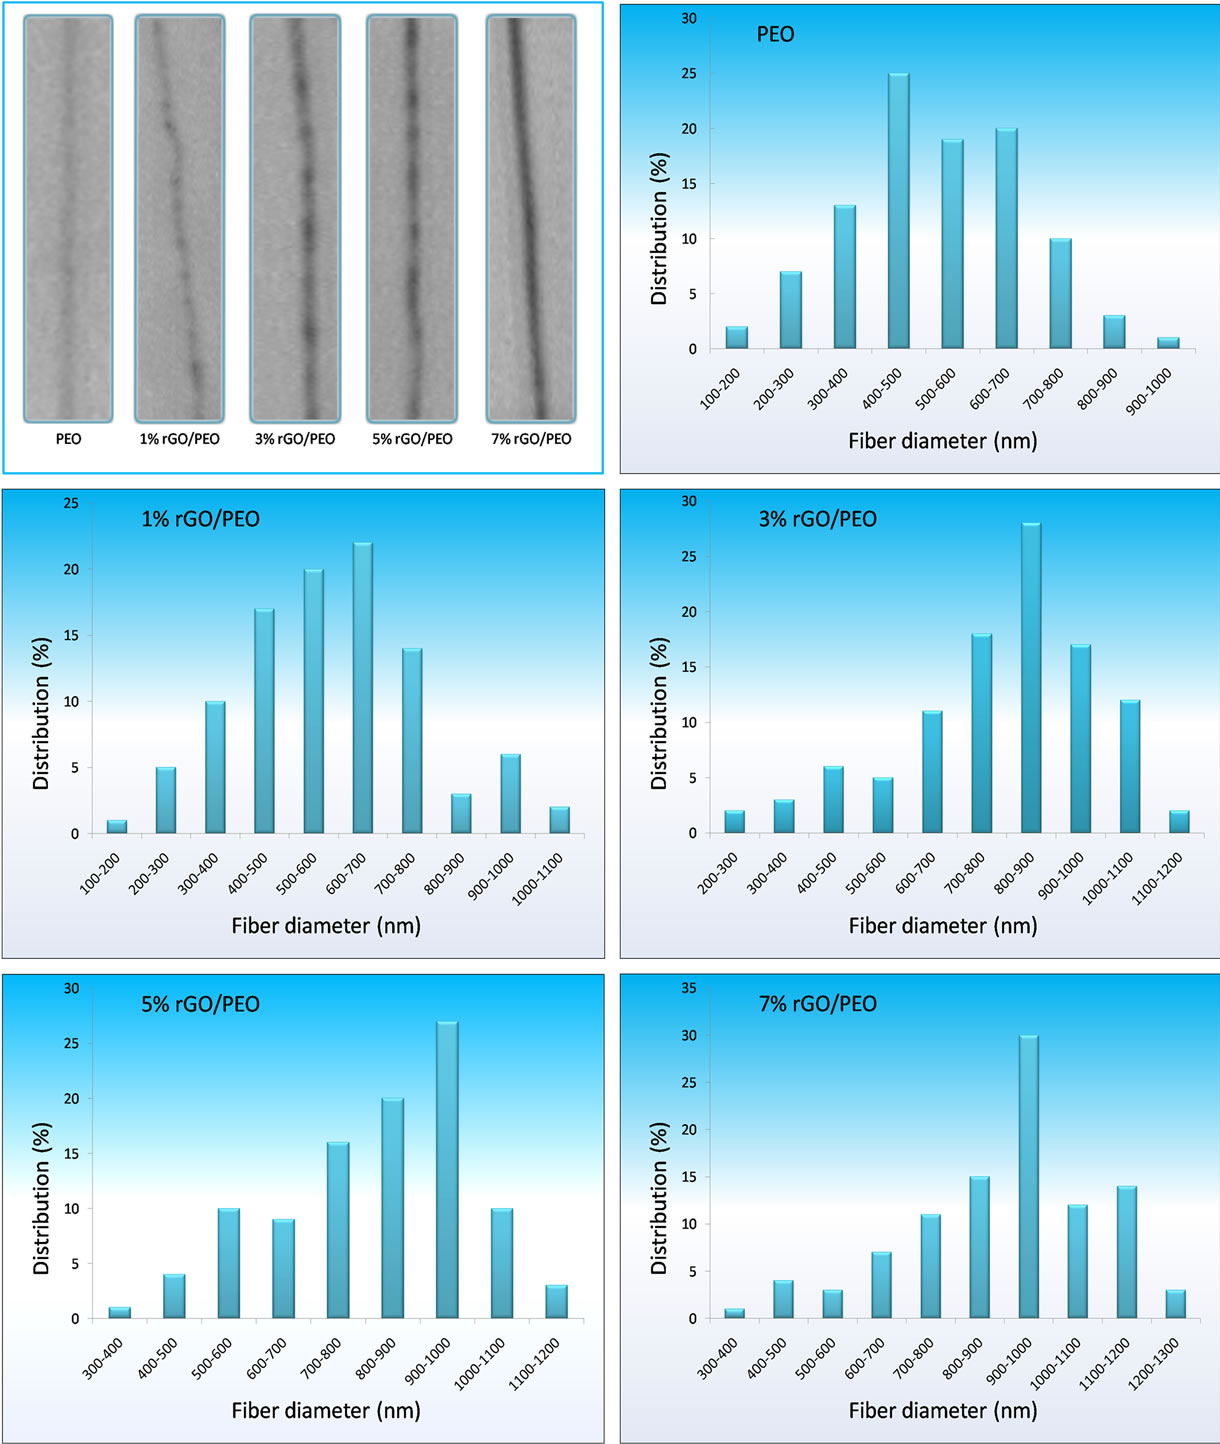
Figure 3. High resolution optical microscope (200×) image shows graphene nanosheets confined into individual PEO nanofibers, this insertion is confirmed by the appearence of black zones in fibers. The average diameter distribution is shown on the graphs for different concentrations of graphene in PEO nanofibers.
good orientation due to the best choice of used parameters. It is difficult to confirm the presence of graphene sheets in the nanofibers from SEM and AFM images. In order to do that and check the dispersion of graphene, we have used high resolution optical microscopy.
3.1.3. High Resolution Optical Microscope Images
The Optical Microscope was used to observe the alignment of the nanofibers to determine the optimum parameters and to further demonstrate the insertion of graphene nanosheets into polymer nanfibers by the appearence of black zones in fibers. Figure 3 shows images of such fibers. Here we observe black particles inside polymer matrix. These black particles are the graphene nanosheets which were found to be well dispersed and the fibers were relatively homogeneous in diameter. Further no beads formation is apparent, corfirming SEM results.
Using image analysis software, the diameters of the G/PEO nanofibers with 0, 1, 3, 5 and 7 wt% of graphene were 542.72, 602.84, 738.56, 817.57 and 913.76 nm, respectively. Graphene nanosheets had a clear effect on the formation of those nanofibers as reflects the average diameter of G/PEO nanofibers dependence on the amount of graphene sheets. We have found that this average increases with the loading of graphene nanosheets, and nanofibers in our samples have a minimum diameter of 100 nm and a maximum diameter of 1200 nm and the shorted measured length was 20 µm.
3.2. Vibrational Spectroscopy
To confirm the insertion of graphene nanosheets into our polymer nanfibers and the absence of interactions between PEO and graphene nanosheets, RAMAN scattering with an excitation wavelength of 514 nm and FTIR spectroscopies were investigated.
3.2.1. RAMAN Spectroscopy
During graphite powder oxidation process in the concentrated acids using Hummer’s method, the original extended conjugated-orbital system of the graphite was destroyed and oxygen-containing functional groups were inserted into the carbon skeleton. After reduction with hydrazine, oxygen groups were then replaced with nitrogen ones. However, after a purification treatment, these functional groups derived from the intensive oxidation and hydrazine hydrate were eliminated, which may be proved by the existence of D, G and 2D bands only (Figure 4), reflecting the skeletal vibration of graphene sheets [15]. The G band that originates from in-plane vibration of sp2 carbon atoms is doubly degenerate (TO and LO) phonon mode (E2g symmetry) at the Brillouin zone center. The 2D band originates from a two phonon double resonance Raman process (Figure 4). The D band is attributed to defects in reduced graphene oxide nanosheets. On the other hand, relatively complex bands of typical polymeric materials were observed such as strong C-OH vibrations at 1150 cm−1. As shown in the Raman spectra (Figure 5), there is no appearance of a new peaks or modification in the ratio of IG/ID intensities on the G/PEO nanofibers spectrum and the narrowing of PEO ray indicates a better alignment in the presence of graphene. These results indicate that the graphite oxide has been successfully exfoliated to graphene sheets, and also there are no interactions between graphene and PEO fibers. To confirm these results, we have also studied FTIR active vibrations.
3.2.2. FTIR Spectroscopy
FTIR spectrum of graphene solution is shown in Figure 4. The absence of graphite and graphene oxide peaks is a strong indication of the obtaining of graphene sheets. These peaks are: at 3400 cm−1 (O-H stretching vibrations), at 1720 cm−1 (stretching vibrations from C = O), at 1600 cm−1 (skeletal vibrations from unoxidized graphitic domains), at 1220 cm−1 (C-OH stretching vibrations), at 1060 cm−1 (C-O stretching vibrations) [16], and stretching vibrations from C = O at 1720 cm−1 due to the remaining of carboxyl groups even after hydrazine reduction the vibration modes of epoxide (C-O-C) (1230 - 1320 cm−1, asymmetric stretching at 850 cm−1, bending motion) [17]. The spectra in Figure 6 show a large broad band at 3320 cm−1 due to PEO hydration. It was observed that the PEO is highly hydrophilic, thus it absorbs water and gets hydrated. Pure PEO shows many peaks, at 2924
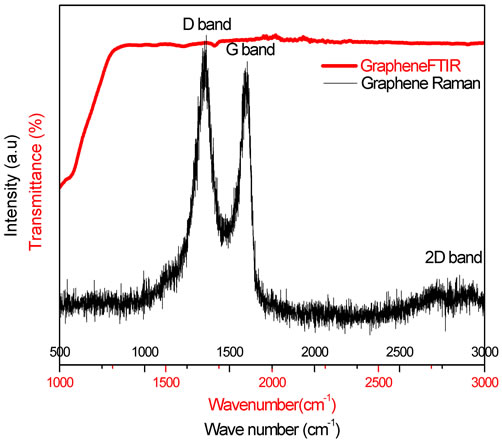
Figure 4. Raman and FTIR spectra of graphene nanosheets.
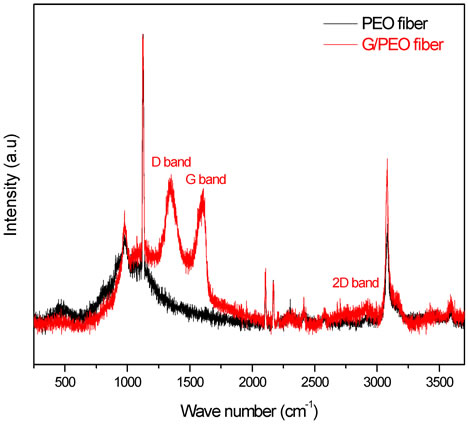
Figure 5. Raman spectra of PEO and G/PEO nanofibers. The comparison of these spectra with graphene spectrum confirms the absence of interactions between the nanosheets and PEO.
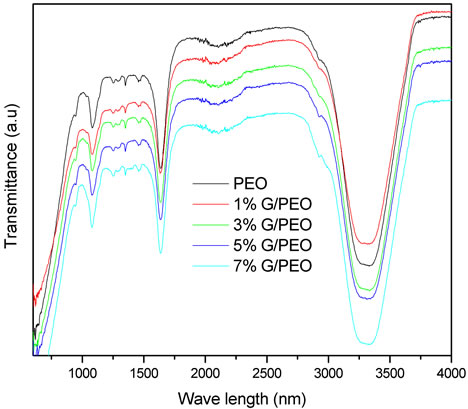
Figure 6. FTIR spectra of G/PEO nanofibres with different graphene concentrations. The non modification of these spectra after the insertion of graphene nanosheets confirms the absence of interactions between them and PEO chains.
cm−1 corresponding to asymmetric CH2, two CH2 vibrational modes appear in PEO at 1460 cm−1 which, correspond to asymmetric CH2 bending (δ(CH2)a) and 1350 cm−1 which, corresponds to symmetric CH2 wagging and some C-C stretching (w(CH2)s + ν(CC)) [18], at 1640 cm−1 attributed to ν(C-O) band, the two bands at 1294 cm−1 and 1250 cm−1 are related to twisting vibration t(CH2)a also for stretching vibratio ν(C-O-C)a [19] and at 107 cm−1 that corresponds to the ν(C-O-C)a vibration mode. It has been reported in a previous study that the presence of a band at 942 cm−1 is characteristic peak in supporting the gauche conformations of -CH2-CH2- groups, as needed for a pure PEO’s helical conformation [20]. The non serious modification of PEO FTIR spectrum after the inseration of graphene nanosheets confirms those derived from raman spectroscopy.
3.3. Thermal Analysis
In order to confirm the loading of graphene in composite fibers, the non interaction between graphene and PEO and syuding their thermal properties, Thermograviametric analysis (TGA) and Differential thermogravimetric (DTG) were done. The dynamic weight loss tests were conducted on a TA Instrument Thermogravimetric Analyzer SETARAM, using Al2O3 100 μl crucible in a N2 purge with an average of sample weights of 14 mg over a temperature range 20˚C - 700˚C at a scan rate of 5˚C/min.
3.3.1. Thermograviametric Analysis (TGA)
The TGA plot of composite fibers with different loading of graphene is shown in Figure 7. As expected, graphene was highly stable up to 600˚C. Reduced graphene showed an enhanced thermal stability due to the removal of oxygen-containing functional groups by reduction with hydrazine [21]. The major mass reduction started at ~350˚C leads to the decomposition of polymer in the samples which was completely decomposed at a temperature of ~425˚C. The weight percentage of the residue matches closely the graphene initial weight percentage during the preparation of the solution. The thermal stability of G/PEO was slightly improved by the presence of graphene, but this effect still negligible, which confirms again the absence of interactions between graphene and PEO.
3.3.2. Differential Thermogravimetric (DTG)
Differential thermogravimetric (DTG) curves of these samples were shown in Figure 8. The temperature of the fastest weight loss rate (Tfl) of PEO were 396˚C, the Tfl of G/PEO (1%, wt/wt), G/PEO (3%, wt/wt), G/PEO (5%, wt/wt) and G/PEO (7%, wt/wt) were 400˚C, 401˚C, 409˚C and 412˚C, respectively. Obviously, this low shifting depending to rapheme loading may be attributed to the pressure of rapheme on PEO nanfibers and confirms the non functionalization of its nanosheets with PEO chains and absence of other interactions.
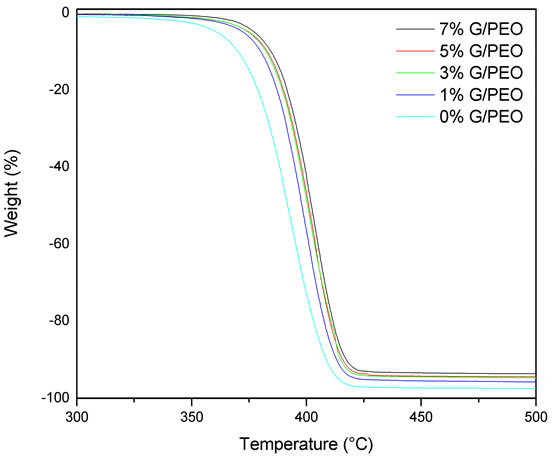
Figure 7. TGA plots of G/PEO nanofibres with different loading of graphene show a low shift to high temperature.
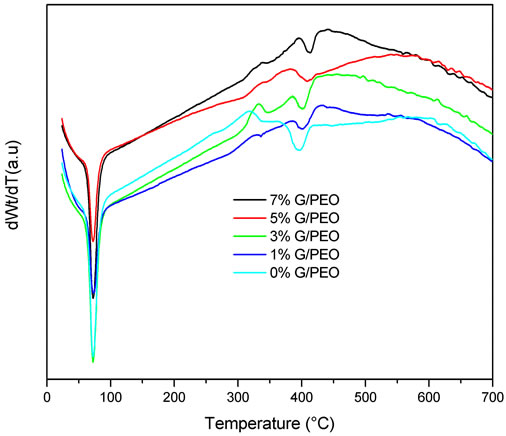
Figure 8. DTG plots of G/PEO nanofibres with different loading of grapheme.
4. Conclusion
To the best of our knowledge, this work demonstrates, for the first time, the confinement of graphene nanosheets in an individual polymeric nanochannel via an electrospinning process. Also worth noting, is the choice of polymer which can’t interact with graphene nanosheets as confirmed by our analysis which makes it a very good envelope of those nanostructures. This is one of the important results in the case of electrospun fibers and opens the way to integrate graphene into a larger area in optoelectronic applications.
5. Acknowledgements
This work was supported by USMBA, NanoAfNet and Technologia University.
REFERENCES
- A. K. Geim and K. S. Novoselov, “The Rise of Graphene,” Nature Materials, Vol. 6, No. 3, 2007, pp. 183- 191.doi:10.1038/nmat1849
- Y. B. Zhang, Y. W. Tan, H. L. Stormer and P. Kim, “Experimental Observation of the Quantum Hall Effect and Berry’s Phase in Graphene,” Nature, Vol. 438, No. 7065, 2005, pp. 201-204. doi:10.1038/nature04235
- X. L. Li, G. Y. Zhang, X. D. Bai, X. M. Sun, X. R. Wang, E. Wang and H. J. Dai, “Highly Conducting Graphene Sheets and Langmuir-Blodgett Films,” Nature Nanotechnology, Vol. 3, No. 9, 2008, pp. 538-542. doi:10.1038/nnano.2008.210
- S. Gilje, S. Han, M. Wang, K. L. Wang and R. B. Kaner, “A Chemical Route to Graphene for Device Applications,” Nano Letters, Vol. 7, No. 11, 2007, pp. 3394-3398. doi:10.1021/nl0717715
- M. Khenfouch, M. Baitoul and M. Maaza, “Synthesis and Gas Sensing Properties of Graphene-ZnO Nanorods,” Global Journal of Physical Chemistry, Vol. 2, No. 2, 2011, pp. 165-169.
- G. Eda, G. Fanchini and M. Chhowalla, “Large-Area Ultrathin Films of Reduced Graphene Oxide as a TransParent and Flexible Electronic Material,” Nature Nanotechnology, Vol. 3, No. 5, 2008, pp. 270-274. doi:10.1038/nnano.2008.83
- J. S. Bunch, A. M. van der Zande, S. S. Verbridge, I. W. Frank, D. M. Tanenbaum, J. M. Parpia, H. G. Craighead and P. L. McEuen, “Electromechanical Resonators from Graphene Sheets,” Science, Vol. 315, No. 5811, 2007, pp. 490-493. doi:10.1126/science.1136836
- M. D. Stoller, Y. S. Park, J. A. Zhu and R. S. Ruo, “Graphene-Based Ultracapacitors,” Nano Letters, Vol. 8, No. 10, 2008, pp. 3498-3502. doi:10.1021/nl802558y
- Z. Liu, Q. Liu, Y. Huang, et al., “Organic Photovoltaic Devices Based on a Novel Acceptor Material: Graphene,” Advanced Materials, Vol. 20, No. 20, 2008, pp. 3924- 3930. doi:10.1002/adma.200800366
- W. Zhao, W. Furong, W. Hang and C. Guohua, “Preparation of Colloidal Dispersions of Graphene Sheets in Organic Solvents by Using Ball Milling,” Journal of Nanomaterials, Vol. 10, No. 1155, 2010, pp. 1-5. doi:10.1155/2010/528235
- J. Doshi and D. H. Reneker, “Electrospinning Process Moreover Applications of Electrospun Fibers,” Journal of Electrostatics, Vol. 35, No. 2-3, 1995, pp. 151-160. doi:10.1016/0304-3886(95)00041-8
- S. N. Thandavamoorthy, S. N. Gopinath and S. S. Ramkumar, “Self-Assembled Honeycomb Polyurethane Nanofibers,” Journal of Applied Polymer Science, Vol. 101, No. 5, 2006, pp. 3121-3124. doi:10.1002/app.24333
- B. Sundaray, V. J. Babu, V. Subramanian and T. S. Natarajan, “Preparation and Characterization of Electrospun Fibers of Poly (Methyl Methacrylate)-Single Walled Carbon Nanotube Nanocomposites,” Journal of Engineered Fibers and Fabrics, Vol. 3, No. 4, 2008, pp. 39-45.
- F. T. Thema, M. J. Moloto, E. D. Dikio, N. N. Nyangiwe, L. Kotsedi, M. Maaza and M. Khenfouch, “Synthesis and Characterization of Graphene Thin Films by Chemical Reduction of Exfoliated and Intercalated Graphite Oxide,” Journal of Chemistry, Vol. 2013, No. 2013, 2013, pp. 1-6.
- P. Guo, H. Song and X. Chen, “Electrochemical Performance of Graphene Nanosheets as a Node Material for Lithiumion Batteries,” Electrochemistry Communications, Vol. 11, No. 6, 2009, pp. 1320-1324. doi:10.1016/j.elecom.2009.04.036
- Y. X. Xu, H. Bai, G. W. Lu, C. Li and G. Q. Shi, “Flexible Graphene Films via the Filtration of Water Soluble Noncovalent Functionalized Graphene Sheets,” Journal of the American Chemical Society, Vol. 130, No. 18, 2008, pp. 5856-5857. doi:10.1021/ja800745y
- D. Li, M. B. Muller, S. Gilje, R. B. Kaner and G. G. Wallace, “Processable Aqueous Dispersions of Graphene Nanosheets,” Nature Nanotechnology, Vol. 3, No. 2, 2008, pp. 101-105. doi:10.1038/nnano.2007.451
- P. A. R. D. Jayathilaka, M. A. K. L. Dissanayake, I. Albinsson and B. E. Mellander, “Effect of Nano-Porous Al2O3 on Thermal, Dielectric and Transport Properties of the (PEO)9LiTFSI Polymer Electrolyte System,” Electrochimica Acta, Vol. 47, No. 20, 2002, pp.3257-3268. doi:10.1016/S0013-4686(02)00243-8
- R. M. Silverstein and G. C. Bassler, “Spectrometric Identification of Organic Compounds,” John Wily & Sons Inc., New York, 1964.
- Z. Shen, G. P. Simon and Y. B. Cheng, “Comparison of Solution Intercalation and Melt Intercalation of Polymer-Clay Nancomposites,” Polymer, Vol. 43, No. 15, 2002, pp. 4251-4260. doi:10.1016/S0032-3861(02)00230-6
- S. Stankovich, D. Dikin, R. Piner, K. Kohlhaas, A. Kleinhammes, Y. Jia, Y. Wu, S. Nguyen and R. Ruoff, “Synthesis of Graphene-Based Nanosheets via Chemical Reduction of Exfoliated Graphite Oxide,” Carbon, Vol. 45, No. 7, pp. 1558-1565. doi:10.1016/j.carbon.2007.02.034
NOTES
*Corresponding author.