Open Journal of Accounting
Vol.2 No.3(2013), Article ID:34758,26 pages DOI:10.4236/ojacct.2013.23009
Efficacy Assessments of Z-Score and Operating Cash Flow Insolvency Predictive Models
1School of Business & Entrepreneurship, American University of Nigeria, Yola, Nigeria;
2Accountancy Department, University of Maiduguri, Maiduguri, Nigeria
Email: *unegbu4@yahoo.com
Copyright © 2013 Angus Unegbu, James Adefila. This is an open access article distributed under the Creative Commons Attribution License, which permits unrestricted use, distribution, and reproduction in any medium, provided the original work is properly cited.
Received October 22, 2012; revised January 4, 2013; accepted January 15, 2013
Keywords: Insolvency Prediction; Operating Cash Flow; Z-Score; Developing Economy; Efficacy Assessment of Prediction Models
ABSTRACT
This study examines the efficacy of Z-Score and operating cash flow as Corporate Insolvency prediction models in developing cash economy. The research specific objectives are to determine the predictive efficacy of Z-Score and operating cash flow in discriminating between would fail and going concern companies, identify more effective model for predicting Corporate Insolvency between Z-Score and operating cash flow and assess the predictive ability across industries of the two models. Sixty-two corporate financial statements possessing flow-based insolvency symptoms were tested. Tools of analyses employed are ANOVA, Loglinear Analysis, Fredman ANOVA and Percentages. Z-Score predictive ability across Services and Merchandising sectors is found to be very poor but very strong on Manufacturing and Oil Services, while Operating Cash Flow model is found to be more effective in predicting accurately Service and Merchandising Sectors. The predictive efficacy of the two models significantly varies as the year becomes closer to the year of corporate failure. It is recommended that across industrial sectors, Z-Score model should be used for testing business failures in Manufacturing and Oil Services while Operating Cash Flow model is better employed in solvency stress test for Merchandising, Transport & Aviation and Service industrial sectors.
1. Introduction
1.1. Background to the Study
Working capital is vital for business survival. Accounting and finance practitioners presume working capital as the differences of current assets over current liabilities. Working capital is the effective blood of any business. It is the amount of money that the firm must obtain from non-free sources to carry its current operating assets thus it is the life wire of any business. Lack of working capital or its inadequacy is termed “insolvency”, although insolvency has other conceptualizations. To many authorities, working capital is a state of inability to meet with demand for debt repayments as and when due. Prolonged insolvency leads to corporate liquidation and winding up. Corporate liquidation brings with economic losses to Corporate managers, Shareholders, Employees, Investors and other Corporate Stakeholders. Although before the advent of global economic meltdown, the rate at which companies become financially distressed is alarming and the “global economic meltdown” has added impetus to the deteriorating situation of Nigerian companies. Entrepreneurship development and enhancement require a healthy environment. Incorporated companies are expected to grow and be sustained for a foreseeable future but these expectations are usually cut short by Corporate Insolvency. Corporate failures exert negative pressures on the economy. It dries up household feeding hands and breeds social crimes, thus the need to undertake a study of Nigerian Corporate Insolvency becomes more expedite. An assessment of the efficacy of insolvency predictive models that will generate early warning signals of Corporate Insolvency to Entrepreneurs, Policy makers, Business Owners and Professionals in developing economies has become greater.
1.2. Statement of the Problem
Nigeria since coming into being as a state operates “Cash Economy”. Cash economy is akin to developing economies in all aspects. Nigeria was one of the prospering economies of the world during the 1970s, thus [1] classified her as an “emerging economy” with great large territories, consumer markets and growing populations. Nigeria helped by the oil boom of 1970s was undertaking extraordinary developmental projects that called for new infrastructure, such as power-generating plants, huge electrifications of the entire country, construction of large networks of roads, provision of improved educational facilities, harbouring flourishing corporate bodies and carrying our massive investment in telecommunications. These developments caused increased demand for consumer goods, social goods and capital equipments. Nigeria pursued vigorously economic policies leading to faster growth and expanding trade and investment with the rest of the world. The International Trade Administration cited Nigeria, South Africa, Brazil, Turkey, India, and Malaysia as emerging economies/markets but by the year 2000 and thereafter, things were not the same anymore. Between 1995 to 1998, [2] had it that number of Commercial Banks had declined from 64 to 51, while Merchant Banks also declined from 54 in 1991 to 38 in 1998. It is known that over two thousand companies have been delisted and many products or services of existing companies have disappeared in the markets thus prompting Nigerians to ask for the reasons for such disappearances. Consumers are alarmed as to what has happened. Policy makers and Professionals are deeply concerned about the increasing corporate failures in recent years. Investors are worried of the efficacy of tools of future and early warning signals of insolvency in the affairs of corporate bodies in the country. These have made it necessary to investigate the efficacy of Z-Score and Operating Cash Flow models as tools for assessing early warning signals of corporate liquidation in Nigeria. It is also pertinent that there is increasing economic meltdown in many “Credit” economies where the efficacy of Z-Score and Operating Cash Flow Insolvency models have been tested to enhance the need to examine their efficacy in a “Cash” economy. Furthermore as Nigeria is speculating to transit into “Credit” economy, scholars and researchers with profound interest in the affairs of the country need to investigate and document the efficacy of Z-Score Insolvency prediction model adapted for “Credit” economies and compare it with Operating Cash Flow Insolvency prediction model which is adapted to “Cash” economies, in readiness to analysis corporate dynamics when the transition to credit economics is completed.
1.3. Objectives of the Study
The main objective of this research is to assess the efficacy of Z-Score and Operating Cash Flow models in prediction of Corporate Insolvency in a developing economy anchored on “flow-based” insolvency measurements using Nigeria as a study case. Specific objectives are to:
1) determine the predictive efficacy of Z-Score and operating cash flow in discriminating between would fail and going concern companies2) identify more effective model for predicting corporate insolvency between Z-Score and operating cash flow and examine and assess the predictive ability across industries of Z-Score and operating cash flow.
1.4. Research Hypotheses
In order to address the research specific objectives, the following null hypotheses are formulated:
Ho1: The predictive efficacy of Z-Score and Operating Cash Flow models is not significantly different in discriminating between would fail and going concern companies in developing economy.
Ho2: The predictive ability across industries in developing economy between Z-Score and Operating Cash Flow models are not significantly different.
Ho3: Predictive efficacy of the two models does not change significantly as the year increases prior to Corporate failure in developing Economy.
1.5. Significance of the Study
This study will not only highlight the symptoms of insolvency in “cash” economy such as Nigerian economy but also will test the predictive ability of Z-Score insolvency model, compared with that of Operating Cash Flow model. The outcome of the research will produce a working base for financial analysts, insolvency practitioners, managers of corporate bodies and the academia to grasp and understand insolvency symptoms, manifestations and predictions in a cash economy for further decisions. The outcome will also afford researchers the opportunity to compare the efficacies of these insolvency prediction models both in a cash economy and credit economy based on the same geographical and human nature. The research is also necessary as it will capture and document relevant data concerning corporate insolvency dynamics during Nigerian Cash Economy before transiting fully to a credit economy.
1.6. Scope of the Study
Legally induced insolvency and Stock Market Value inflicted insolvency are not covered in this study but flow-based insolvency measurement. The research covered sixty two financial statements of thirty one companies in Nigeria. It is limited to the analysis of events that appear in the financial statements. Two consecutive years of financial statements of companies with any or combinations of flow based Corporate Insolvency symptoms were variously selected between years 1990 to 2009.
1.7. Justification for the Choice of 1990 to 2009 Cut-Off Period
Nigerian economy started suffering from critical negative pressures in 1980s when austerity policies were introduced and its adverse measures were implemented. The effect of this macroeconomic indicator of depressed and declining economic indices impacted heavily on corporate bodies in the 1990s leading to more and increasing corporate failures. By the end of 1990s and thereafter there had been rampant corporate failures and delisting of dormant corporate bodies in the country. In the 2000s, global economic meltdown had increased the tempo of corporate failures throughout the world thus the choice of 1990 to 2009 as a cut-off period for the study of efficacy of Z-Score and Operating Cash Flow models as tools for assessing early warning signals of corporate liquidation is justified.
2. Literature Review
2.1. Causes of Corporate Insolvency
It is the assertion of [3] that incompetent management, downturn in economic conditions, inflation, new inventions, fraud, and negligence are the causes of Corporate Insolvency. Incompetent management relates to lack of the Directors’ foresight in planning, control, directing, organizing and “deaf” management. Downturn in economic conditions comprises of prolonged losses, change of laws, economic depressions and sudden natural disaster negatively affecting the firm. New inventions and changes in technology can cause the existing products to become obsolete and lack of demands, leading to insolvency. Financial fraud in an organization may send a fund shock into the Organization, thus resulting to the firm becoming insolvent. Accounting fraud, which is accounting distortions or accounting engineering aimed at covering misstatements to show that the firm is healthy when it is otherwise, thus the act cannot be managed any longer, insolvency sets in.
2.2. Indicators of Insolvency in Cash Economy
A study was carried out by [4] on what influences the number of bankruptcies in Norwegian enterprises. Their study concentrated on external influences (macroeconomic variables) that influences bankruptcies or prevents firms from becoming bankrupt. The cut-off period of the research was 1991 to 2004. The research of [4] focused on the macroeconomic indicators/causes of Corporate Insolvency though very significant but it is different from current research which focuses on flow-based indicators of Corporate Insolvency.
2.3. Efficacy of Z-Score Corporate Insolvency Prediction Model in Cash Economy
Both [5] and [6] compared the results of Z-Score against the neural network approach and their results suggested that the Neural Networks approach is more effective than Z-Score model in classifying distressed and non-distressed firms, whereas [7], after comparing two Neural Networks techniques to Z-Score using Probit and Logit prediction models, it was found that the two Neural Networks techniques did not provide superior classification rates.
A study on predicting corporate failure, using United Kingdom firms was carried by [8]. Their main objective is the development and validation of a failure classification model for UK public industrial companies using logit analysis and Neural Networks techniques. Their dataset consists of 51 matched-pairs of failed and non-failed UK public industrial firms over the period 1988- 1997. Their results indicate that a parsimonious model that includes three financial variables, profitability, an operating cash flow and a financial leverage variable can yield an overall correct classification accuracy of 83% one year prior to failure. These researchers selected financial ratios as predictor variables mainly because of their popularity and predictive success in previous research. They tend to forget that organizations in developing economies cannot survive without generating cash from their normal everyday operations, thus the need for operating cash flow related models’ usefulness in predicting corporate failure.
2.4. Comparative Efficacy of Z-Score and Operating Cash Flow Models
A research on Corporate bankruptcy prediction models applied to emerging economies, using Argentina was done by [9] with a cut-off period of 1991 to 1998 as a case study. The research specific objectives are to investigate the applicability of Z-Score to predict Corporate Insolvency in emerging economies and to compare the efficacy of Z-Score with profitability ratios in predicting Corporate Insolvency. This study was based on flow-based insolvency indicators. Eleven bankrupt and eleven healthy companies were sampled by [9] during the research. The research findings is that Z-Score model can be used in predicting Corporate Insolvency in emerging economics because it pays attention to solvency indicators but in a rapid changing environment, profitability ratios should be better used.
On the forms of Corporate Insolvency, [10] asserted that there are two forms of insolvency investigations; those concerned with ability to pay maturing debts (Cash flow test) and those on the entire value of the enterprise (Balance sheet test from where Z-Score drew its variables). The research study sampled three thousand, six hundred firms between the periods of 2005 to 2009 on the premises of understanding how recession has affected the solvency of companies. The research findings is that though the two models showed significant results but that nonfinancial indicators must be taken into consideration as financial indicators alone are inconclusive indicators of distress. This conclusion was made because his analyses of nonfinancial indicators, as opposed to financial ones, show a clear trend of increasing distress. This [10] assertion on the important forms of insolvency investigations is very significant to the present research.
Using cash flow ratios to predict business failures and comparing the outcomes of these ratios with outcome of Z-Score tests was a research carried out by [11]. This research is very significant to current research because there is resemblance. The present research is different because it is not concerned with comparing the efficacy of Z-Score with individual cash flow ratios.
[12] conducted a study to assess whether operating cash flow data and related measures lead to more accurate predictions of bankrupt and non-bankrupt firms in the United Kingdom. Their statement of problem is most accounting and finance studies of corporate financial distress define “Cash Flow” as net income plus nonworking capital expenses, so they omit items such as changes in current assets and current liabilities which may have a significant impact on a company’s actual cash flow from operations and more worrisome is that past empirical research on the relationship between cash flow operating activities and financial distress where carried out without having hold-out samples. In their research, cash flow from operating activities was redefined to mean as net income plus nonworking capital expenses divided by current liabilities. The research of [12] went further to compare the relative efficacy of their cash flow model with Z-Score model. The study sample includes hold-out samples. Their findings showed that both Operating Cash Flow model and the Z-Score were statistically significant for the first three years prior to bankruptcy. The research of [12] is very significant to the current study although it was conducted on a developed economy.
While agreeing on the relevance of operating cash flow in corporate failure predictions, [13] was concerned with the conceptualizations of operating cash flows. The study highlighted fifteen studies where operating cash flow was differently conceived with each showing varied efficacy of the model in predicting corporate failure.
In contrast to [12], current research centers on examining the efficacy of Operating Cash Flow and Z-Score models in cash/developing economy. In reference to the work of [13], the current research is not concerned with comparative conceptualizations validity of the construct “Operating Cash Flow”. The study of [9] is very material to use, as it has found Z-Score usable with financial data from developing economies, of which Nigeria is an example.
A research on the efficacy of liquidation and bankruptcy prediction models for assessing going concern was carried out by [14]. The purpose of the study is to examine the efficacy of statistical corporate liquidation prediction models for assessing client going concern status. Previous researches show that statistical bankruptcy prediction models consistently outperform auditors’ going concern judgment in discriminating between bankrupt and non-bankrupt companies. The [14] research worry is that in countries such as the US where the insolvency laws are debtor oriented, corporate bankruptcy procedures encourage companies in financial difficulty to continue as going concerns. This concern was shared by [15]. Therefore it is possible for companies that file for bankruptcy to reorganize and emerge from bankruptcy, or to merge with another entity as a going concern. [16] also concords. This is in contrast to the insolvency procedures in creditor oriented countries such as the UK, Germany, Australia, Nigeria and New Zealand where liquidation is the most common outcome of Corporate Insolvency [15,17].
The argument of [14] is that given the differences in debtor and creditor oriented insolvency frameworks. The research aimed at finding ways and procedures that can assist auditors in choosing appropriate business failure prediction models as an analytical technique for assessing going concern. The findings of their study raised the issue of the appropriateness of using bankruptcy prediction models in countries where the insolvency code is essentially creditor oriented. In countries such as the UK, Nigeria, Australia and New Zealand, a liquidation prediction model is likely to be more appropriate because the majority of insolvent companies are liquidated, and not given the opportunity of remaining as a going concern as encouraged by the US Chapter 11 insolvency procedures.
The study of [15], though carried out in a credit economy and operating cash flow was not one of the prediction models compared, however, it will be highly relevant to current research as it showed that Z-Score model has high efficacy for predicting corporate failures but less in predicting concern firms in a creditor oriented insolvency economy which is akin to Nigeria’s economy. The study also raised a crucial issue in the use of Z-Score prediction model for assessing going concern financial stress in a creditor oriented economies which is relevant in the current Nigerian investigation.
3. Research Methods
3.1. Study Area and Sources of Data
This study is designed to focus on corporate bodies operating and those that had operated in Nigeria, an example of countries that operate “cash” economy. It is the assertion of [18] that there are more than two million registered businesses in Nigeria as at 31st December 2011. This is made up of 896,095 companies, 1,917,670 business names and 47,421 incorporated trustees. The study area of this research is on the incorporated companies. It was further asserted by [18] that out of the incorporated companies, 59,000 of them were dormant, Liquidated or had been delisted from the Corporate Affairs Register. Available data from The Nigerian Stock Exchange as at 06/08/2012 and from Corporate Affairs Commission showed out of the remaining 837,095 companies, 398 of them are quoted while a total of 836,697 companies were registered as unquoted companies.
The data for this study were drawn from secondary sources. Published financial statements of selected corporate bodies from 1990 to 2009 were analyzed. These published financial statements of companies in Nigeria were collected from Corporate Affairs Commission and the Nigerian Stock Exchange. The cut-off period was chosen because of increasing wave of corporate liquidation within the period and rising global economic meltdown.
3.2. Population of the Study
The population of this study comprises 896,095 existing and liquidated companies that is operating or had operated in Nigeria (Table 1).
Corporate bodies were stratified by names as obtained from Corporate Affairs Commission and the Nigerian Stock Exchange, ranging from A to Z. Forty firms were randomly generated from each alphabet, thus giving a total of one thousand and forty entities as the research theoretical population (i.e. a population to generalize to). Out of the theoretical population, six hundred and ten companies were found to have one or combination of flow based Corporate Insolvency symptoms, hence the study accessible population (i.e. population that is available).
Basis of financial year selections: Two consecutive years of financial statements of companies with any or combinations of the listed insolvency symptoms were variously selected between years 1990 to 2009 thus;
1) Failed Companies: Financial statements with inherent Corporate Insolvency symptoms 3rd and 2nd year prior to failure were selected for examination. A year’s gap prior to failure is given for strategic decisions and implementations of re-organization, refinancing and other necessary measures that should have helped the enterprise to avert the looming liquidation on identifying that the company is moving towards failure three to two years earlier.
2) Going Concern Companies: Financial statements with material Corporate Insolvency symptoms persisting for two financial years consecutively but not later than December 2010 were selected for study. The year 2010 is selected as a cut-off date. The period covered by the study is 20 years of 1990 to 2009.
3.3. Sample Size Determination
Having identified accessible population to be made up 610, Banking and Financial sectors were excluded for information sensitivity and ongoing consolidation exercise in the sector. Other industries excluded as a result of capital adequacy and other special requirements are Mining, Shipping, Oil Explorations and Ammunitions. The industries concentrated on for availability of financial statements, uniformity in accounting and lacks of capital adequacy requirements were:
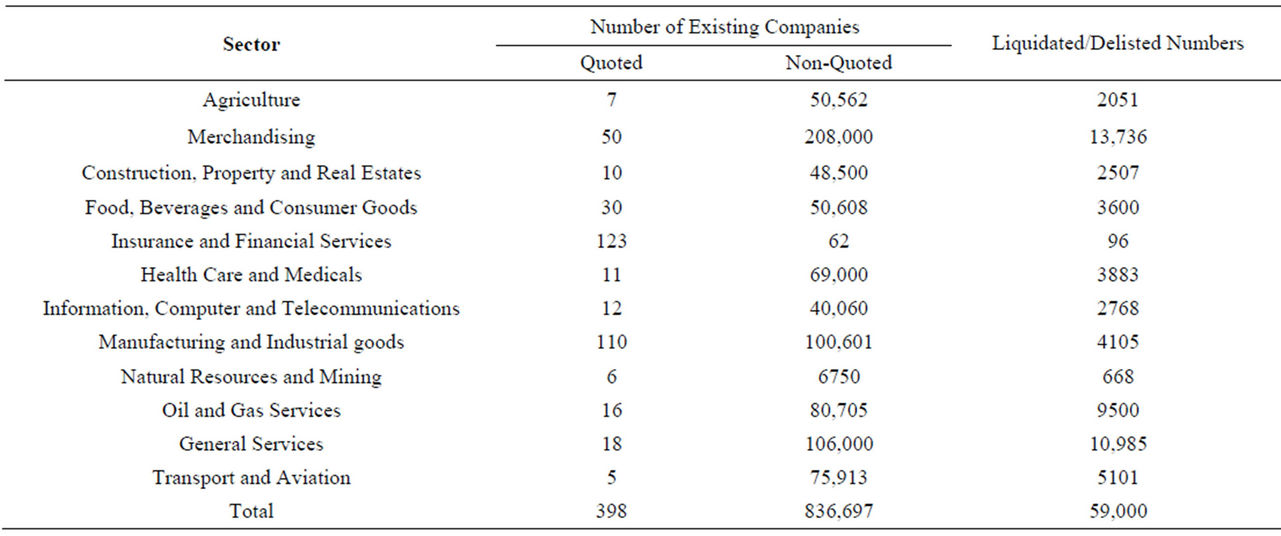
Table 1. The detailed industrial sectors that made up the population as at date based were as follows.
• Service Industry
• Transport and Aviation (Nigerian based)
• Oil Services
• Merchandising
• Manufacturing.
Seventy Corporate bodies were found from the industrial focus, and using [19] equation:
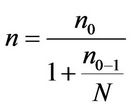
where;
n = required sample size (Number of Financial statements to be analyzed).
n0 = concerned (valid) sample size (Available and Relevant Financial statements to draw sample from).
N = Population size (To generated/identified relevant financial statement from stratification sampling).
The required sample sizes were generated by SPSS based Cochran equation thus;
1) 62 Financial Statements as required sample for investigation. 45 Financial statements out of the 62 are to be reserved for failed companies, while the remaining 17 financial statements is generated as a good sample size from going concern financial statements. Across industrial sectors, the same sizes were generated using SPSS based Cochran equation thus:
• Service 10;
• Transport and Aviation 6;
• Oil Services 8;
• Merchandising 14;
• Manufacturing 24.
3.4. Method of Data Collection
Certified True Copies of the generated financial statements via stratified sampling technique were collected from the Head Office of the Nigerian Corporate Affairs. Each of the financial statement was professional analyzed to extract the relevant Z-Score and operating cash flow prediction data.
3.5. Techniques of Data Analysis
Reliability and validity of the effectiveness of Z-Score model and Operating Cash Flow were confirmed variously by the use of ANOVA (Analysis of Variance), Fredman ANOVA, and Loglinear at 5% significant level. A comparative analysis of test outcomes employed the use of Percentages (Cross tabulations). Computations of these test statistics were carried out and decision criteria based on SPSS statistical software processing.
3.6. Theoretical Frameworks Adopted
The conception of operating cash flow and measurement for the purposes of this research is as defined by [20] as earnings before interest and depreciation minus taxes. The solvency decision criterion using operating cash flow is that it has to be positive. A firm having negative operating cash flow shows a strong symptom of insolvency.
Z-Score Insolvency Prediction model adopted for this research is as stipulated by [21] thus;
Equation: Z-Score model for quoted companies Z = 0.717X1 + 0.847X2 + 3.107X3 + 0.420X4 + 0.998X5
Given that:
X1 = Net Working capital/Total assets X2 = Accumulated retained earnings/Total assets X3 = EBIT/Total assets X4 = Market Value of equity/Book value of debt X5 = Sales/Total assets.
The decision criterion is thus:
If Z is between 1.23 and 1.81, the firm is bankrupt.
If Z is greater than 1.81 but equal to or lower than 2.90, the firm is in a gray area.
If the firm has Z-Score greater than 2.90, the firm is None-bankrupt.
Equation: Z-Score model for non-quoted companies Z= 6.56X1 + 3.26X2 + 6.72X3 + 1.05X4
Given that:
X1 = Net working capital/Total assets X2 = Accumulated retained earnings/Total assets X3 = EBIT/Total assets X4 = Book value of equity/Total liabilities.
The decision criteria are:
If Z is <1.21, the firm is bankrupt.
If Z is between 1.22 and 2.90, the firm is in a gray area.
If Z is >2.90, the firm is Non-bankrupt.
4. Data Presentation, Analysis, Findings & Recommendations
4.1. Data Presentation
4.1.1. Discussion of Table 2
Out of the ten sampled financial statements from General Service Industrial, Z-Score model predicted seven of them as heading towards failure while two financial statements were confirmed as going concern from available indicators and one was predicted as being within gray area. On the other hand, Operating Cash Flow model using variables from the same corporate bodies predicted four sampled service sectors as heading towards failure and six of them were certified as possessing the indicators of going concern.
4.1.2. Discussion of Transport and Aviation Industrial Data
Table 3 contains data from sampled Transport and Av-


Table 2. Variables used for computation of Z-Score and operating cash flow predictions of service industrial sampled companies.
iation Industrial sector. It shows that Z-Score model predictions had inverse relationship with that of operating cash flow predictions. Out of the six sampled companies, Z-Score predicted five for failure and one company for continuation in business. On the other hand, operating cash flow predicted one company to be heading for failure, while five companies were predicted as having clean sheets to continue in business.
4.1.3. Discussion of Table 4 Data
Oil Service Industrial sector sampled financial statements were eight in number. Z-Score and Operating Cash Flow models predicted in like directions on this sector. Both models predicted five of the financial statements as possessing indicators of failure while three of them were given clean bills of failure indicators thus they were adjudicated of having the ability of continuing in business.
4.1.4. Discussion of Table 5 Data
This table captured the relevant data on sampled merchandising industrial sector. In total, fourteen financial statements were investigated. Z-Score model predicted twelve of the financial statements of having inherent indicators of failure while two of them had indicators of healthy companies. On the other hand, investigation conducted with Operating Cash Flow model using same sampled financial statements showed that eleven financial statements possess all the indicators of healthy corporate bodies while three financial statements possess symptoms of corporate failure.
4.1.5. Discussion of Table 6 Data
Twenty four corporate bodies from manufacturing industrial sector were sampled. Z-Score model predicted twenty of the sampled companies of having inherent failure symptoms and four of possessing healthy continuing indicators. Sample corporate bodies were tested with Operating Cash Flow model where ten financial statements were adjudicated of heading towards failure while fourteen were predicted of healthy enough to continue in business.
4.2. Analyses of Data and Testing of Hypotheses
The relevant data as presented in Tables 2 to Table 7 are analyzed hereafter according to each stated hypothesis using relevant statistical SPSS based statistical techniques.
4.2.1. Testing of Hypothesis 1
Ho1: The predictive efficacy of Z-Score and Operating Cash Flow models is not significantly different in discriminating between would fail and going concern companies in cash/developing economy.
This hypothesis is concerned with the comparative efficacy of Z-Score model against Operating Cash Flow model in predicting business failures. Here also the research is profoundly concerned with the predictive efficacy of both models to discriminate in their predictions accurately or wrongly between would fail and going concern companies. This explains the need for capturing against each model, the number of times it accurately or
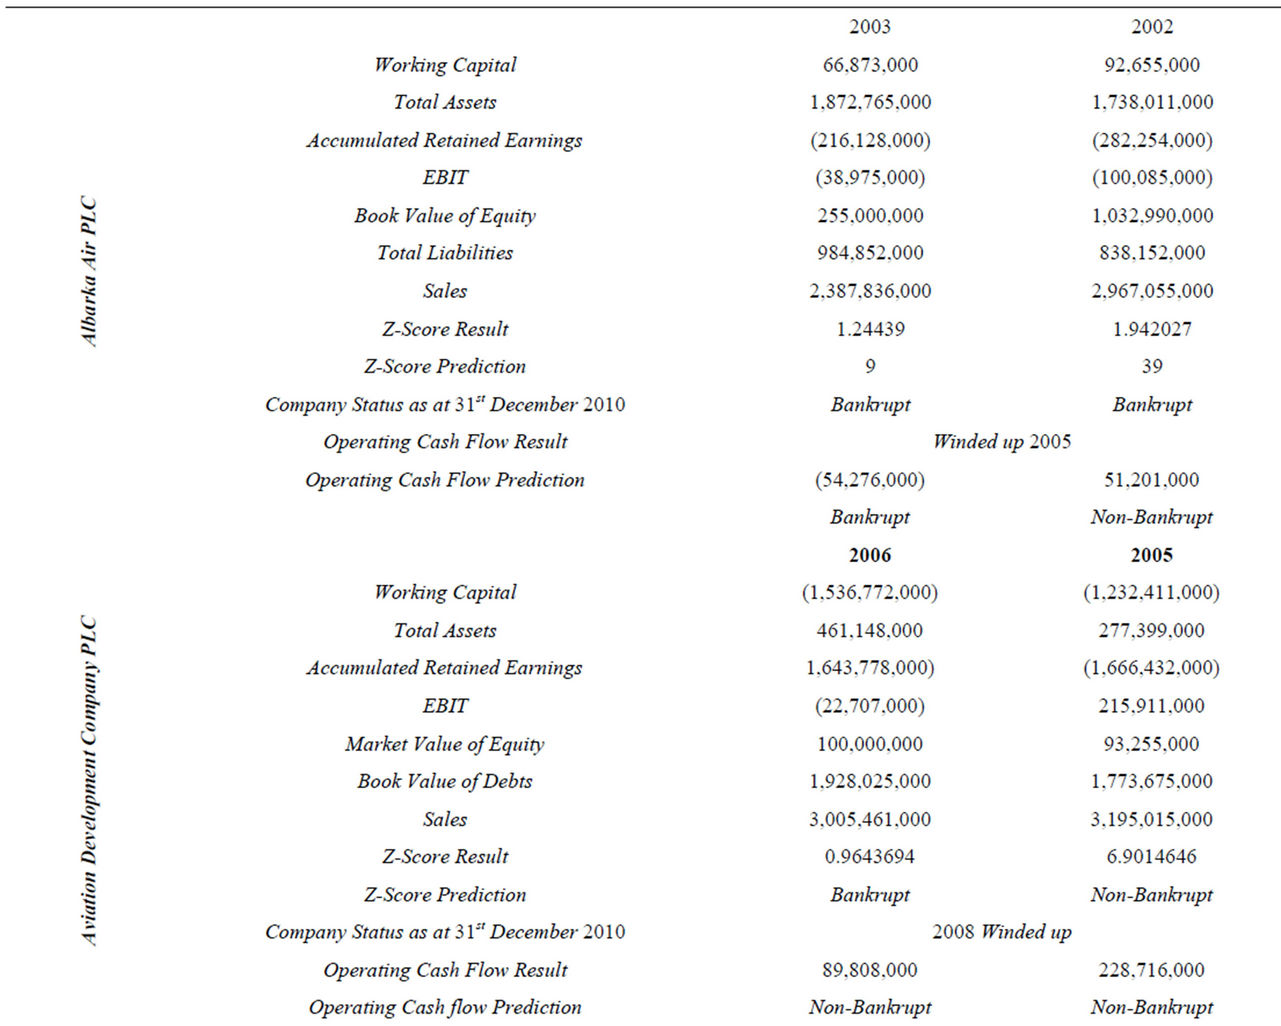
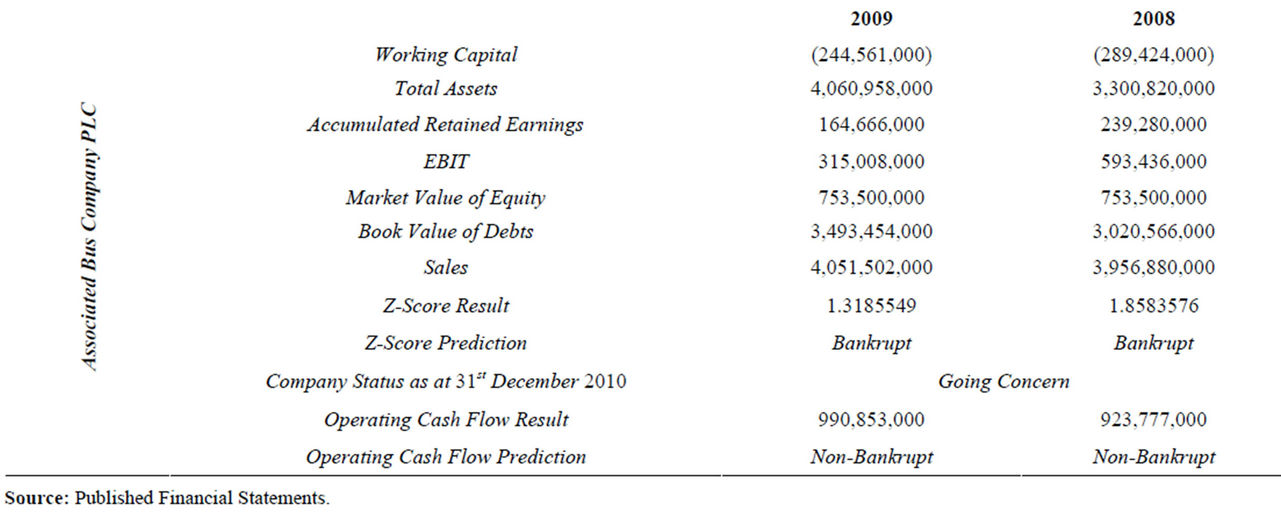
Table 3. Variables used for computation of Z-Score and operating cash flow predictions of transport & aviation industrial sampled companies.
wrongly predicted the future outcomes of corporate entities with material insolvency symptoms. From Tables 2 to Table 5, the predictions of the two models in these respects were extracted. The information is as seen in Table 7.
A good statistical tool to use in analyzing the informa
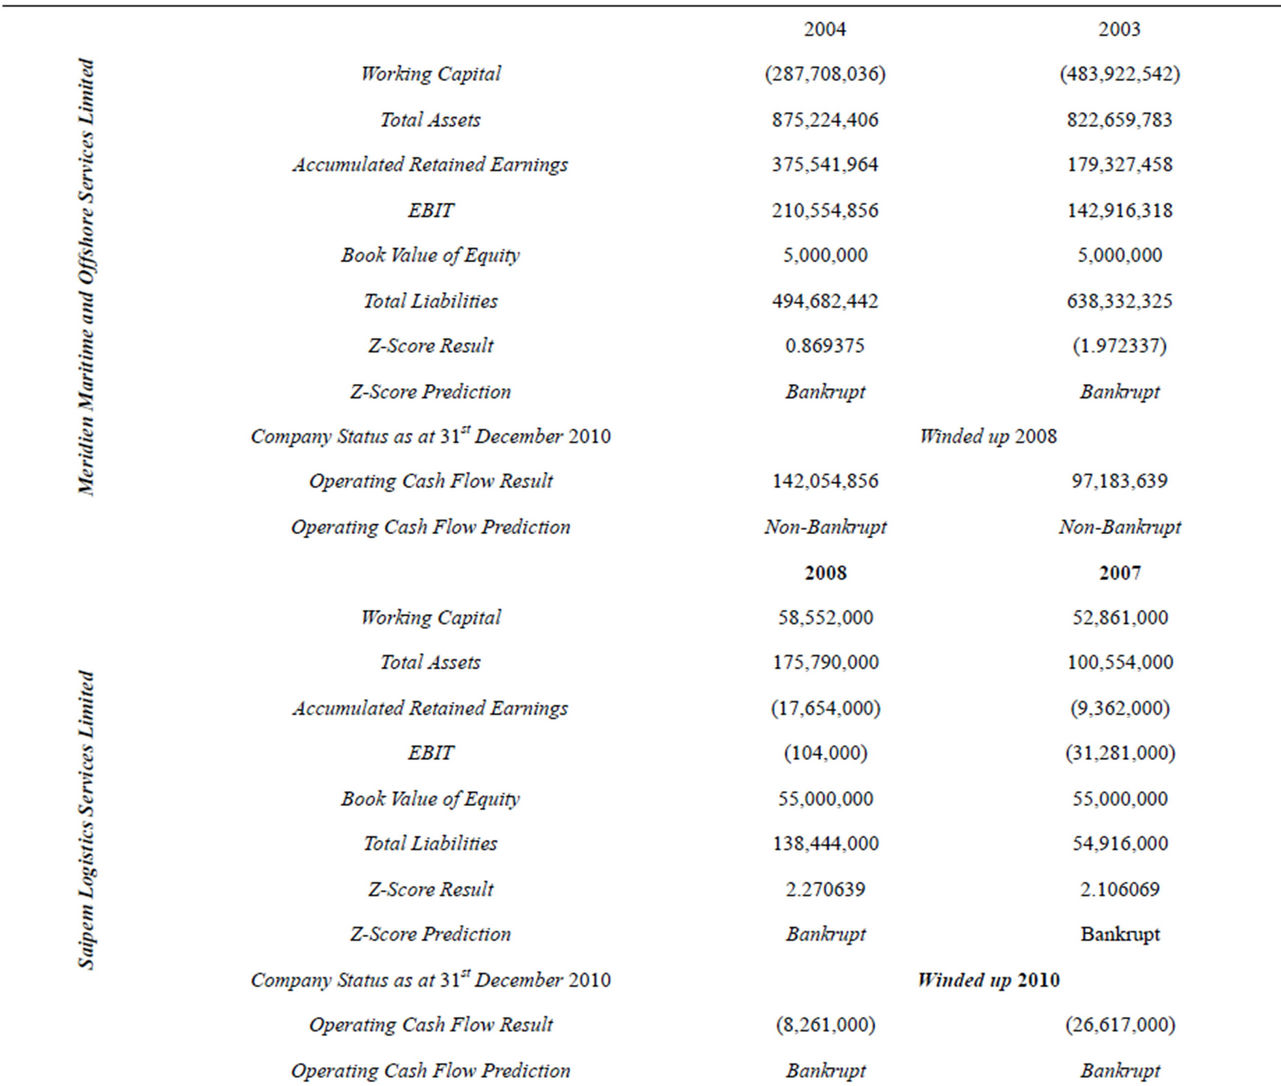
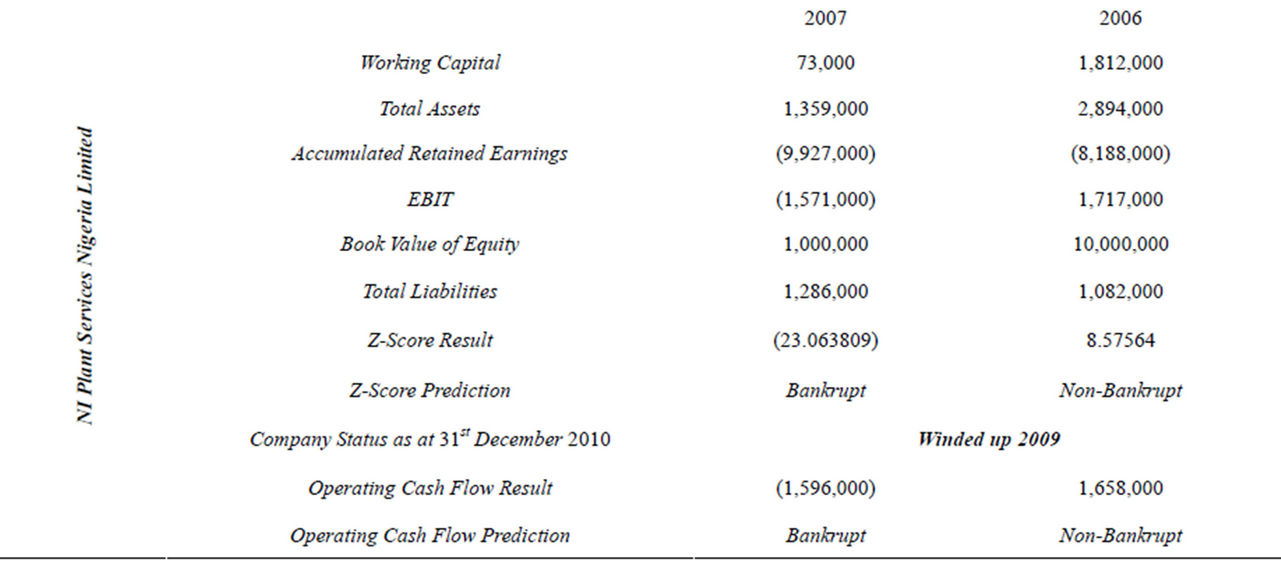
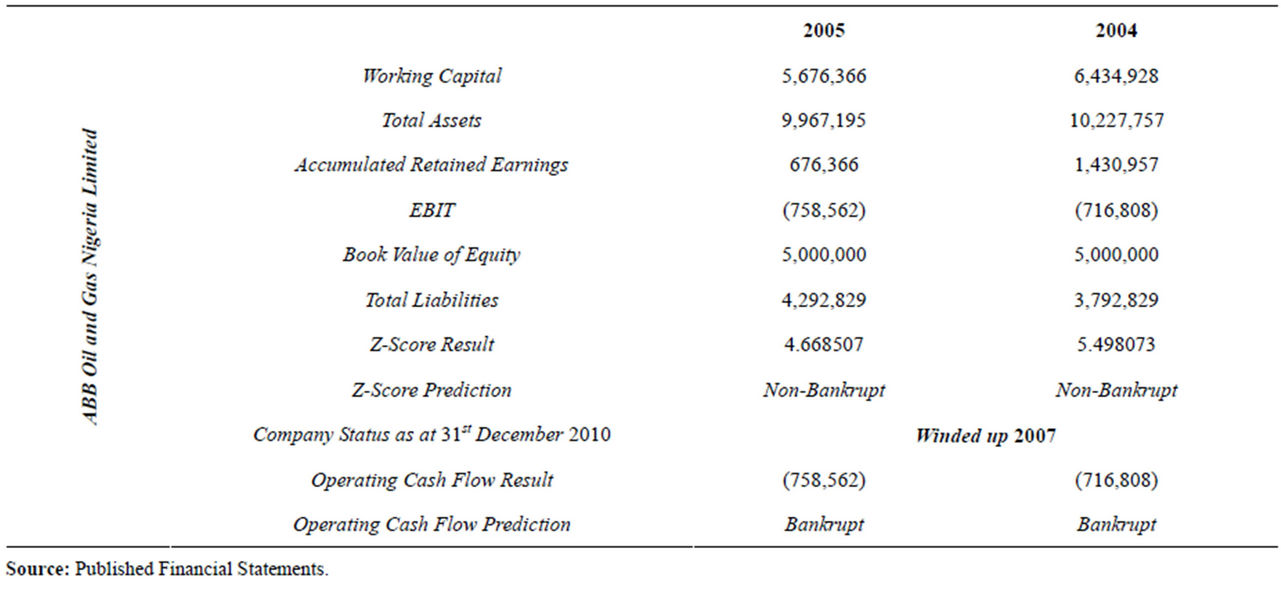
Table 4. Variables used for computation of Z-Score and operating cash flow predictions of Oil Service industrial sampled companies.
tion contained in Tables 4 and 6 is Analysis of Variance (ANOVA). Using the data from Table 7, weighting with Frequency of predictions and running both Z-Score and Operating Cash aspects in ANOVA thus;
4.2.2. Interpretations and Discussion of Outcomes of Hypothesis One Tests
The result as captured in Table 8 showed that the frequencies of outcomes between the two models are significant as p < 0.05 with F value as large as 8.47 thus, the null hypothesis which states that the predictive efficacy of Z-Score and Operating Cash Flow models is not significantly different in discriminating between would fail and going concern companies in cash economy is rejected. Though the result showed that there are very significant differences between the discriminatory efficacies of the two models, it did not tell us vividly the areas of these differences. To understand the focus of these differences, it is necessary that further analyzes of the outcomes using cross tabulation percentages be carried out. The outcome of this further analysis is captured in Table 9.
Further analysis of the result as seen in Table 9, showed that Z-Score model had 56.5% of the failed companies rightly predicted as such. On individual predictions of “right” and “wrong”, this represents 79.5% of accurate predictions of would fail companies before they failed. On the other hand, Z-Score model wrongly predicted 14.5% on combined basis representing 20.5% of the predictions of would fail companies as at 31st December 2010. In the same vein, the Z-Score Model only predicted correctly 3.2% representing 11.1% of going concern companies. The model wrongly predicted 25.8% representing 88.9% of going concern companies as at the date under consideration.
Other facts leading to the rejection of the null hypothesis which states that the predictive efficacy of Z-Score and Operating Cash Flow models is not significantly different in discriminating between would fail and going concern companies in cash economy is 40.3% representing 55.6% of failed companies which were rightly predicted by Operating Cash Flow model, while 32.3% representing 44.4% of such companies were wrongly predicted using Operating Cash Flow model. The model in summary effectively predicted 94.1% of going concern companies rightly with a slight error prediction of 5.9% of such companies as at 31st December 2010.
A look at Table 9 showed that Z-Score Model was able to predict 79.5% of failed companies accurately but could predict only 11.1% of going concern companies accurately. On the other hand, Operating Cash Flow model was able to predict 94.1% of going concern companies rightly and 55.6% of failed companies accurately as seen from Table 9.
4.2.3. Testing of Hypothesis 2
Ho2: The predictive ability across industries in developing economy between Z-Score and Operating Cash Flow models is not significantly different.
To test this hypothesis, the results of prediction of Z-Score and Operating Cash Flow models across the different industrial sectors were extracted from sampled companies. In order to test the stated hypothesis, Loglinear analysis is made use of so as to extract the nature of partial associations between the models used and outcome of predictions. Data contained in Tables 2 to 6 were extracted and captured as seen in Table 4, 9 information.

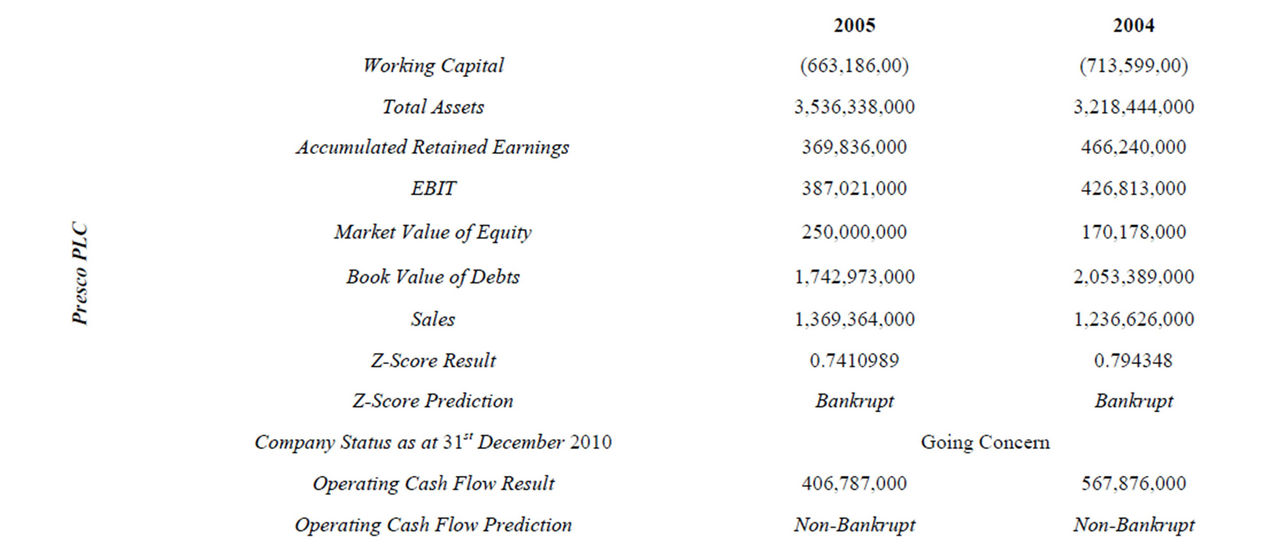

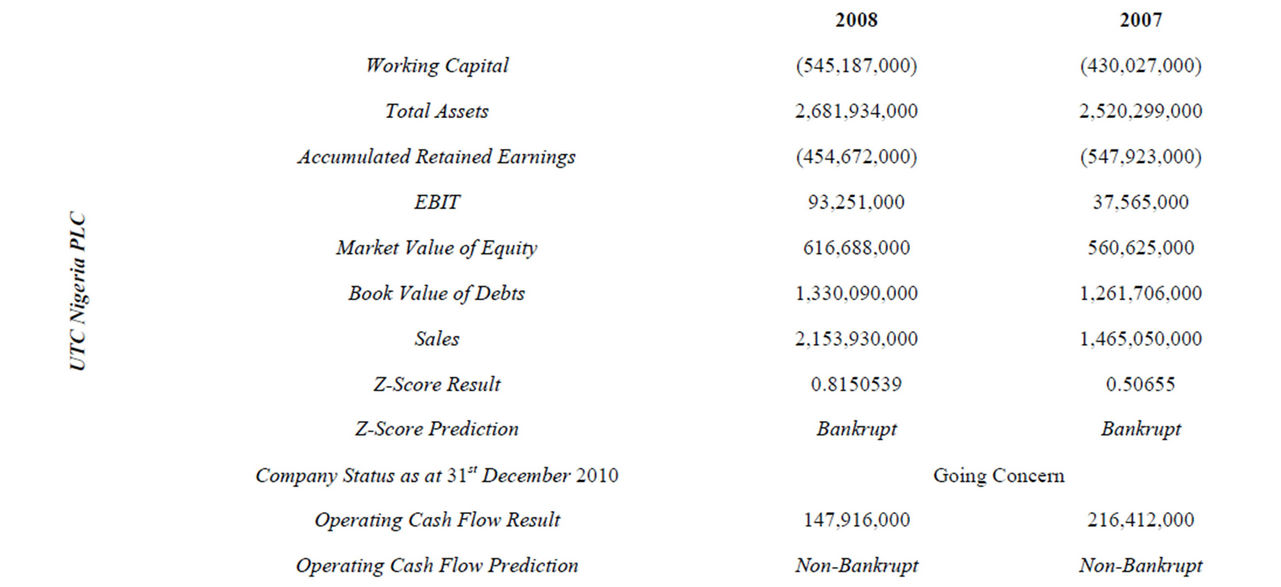
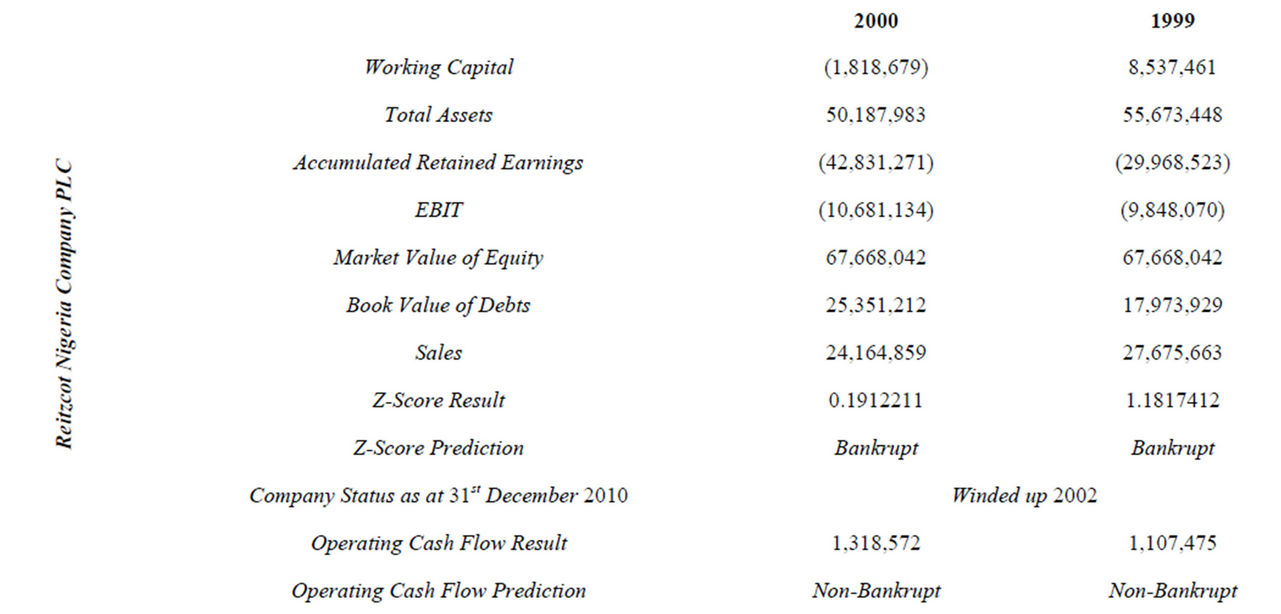
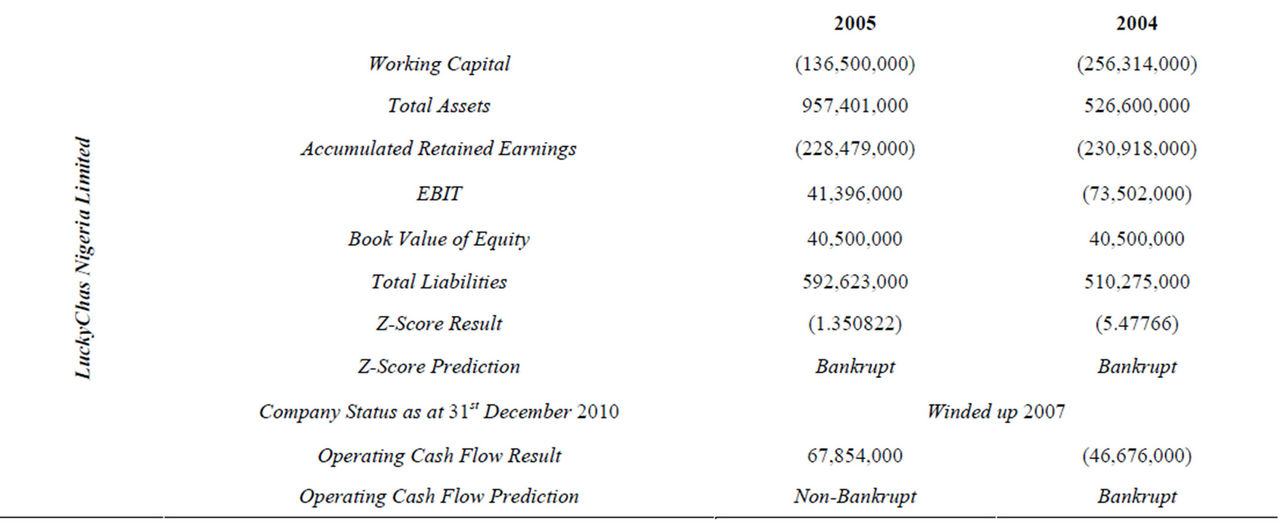

Table 5. Variables used for computation of Z-Score and operating cash flow predictions of merchandising industrial sampled companies.
The outcome of the analysis using Loglinear analysis is as seen in Tables 11 and 12.
4.2.4. Interpretations and Discussion of Outcomes of Hypothesis Two Tests
The results as shown by Table 11, indicates that the effect associated with Sectors and Models used, Sector and Predictions and Models and Predictions are all in-significant. This result therefore confirms the null hypothesis which stated that predictive ability across industries in developing economy between Z-Score and Operating Cash Flow models is not significantly different. Each model effect on each of the sampled sectors is shown in Table 12. The results as captured by Table 12 also showed that both Z-Score and Operating Cash Flow models is not significantly different. However both Tables 11 and 12 did indicate that each of the models on individual bases is significantly effective on the sectors and frequency of predictions. To identify the skewness of these significant differences; a further analysis is carried out, using the same Table 10 data to running a cross tabulation percentages of these efficacies across industrial sectors. This is vividly seen as provided in Table 13.
Z-Score right predictive efficacy on manufacturing sector is about 97.1% as can be seen from Table 13. It is the sector that has highest right prediction efficacy when Z-Score model is used in predicting business failures. In contrast, Z-Score is very poor in predicting accurately would fail enterprises in Service industrial sectors. The model predicted rightly only 20% of would fail service corporate bodies while 80% of firms in service sector were wrongly predicted. At the Transport & Aviation industry, the predictive efficacy is 50% each. Oil Services got 62.5% rightly predicted by Z-Score. In the merchandising industry, Z-Score model was found to have poor predictive efficacy as it rightly produced 42.9% of its prediction. In summary, Z-Score predictive efficacy across industrial sectors is very strong in accurately predicting the future status of insolvency vermin ridding corporate bodies in the manufacturing, and Oil Services sectors. However its predictive ability across Services and Merchandising sectors were found to be very poor. Z-Score predictive ability on Transport and Aviation industry is only accurate by half.
In conclusion, Z-Score predictive efficacy across industrial sectors is accurate within the range of 91.7% for manufacturing, 62.5% for Oil Services, 50% for Transport & Aviation, 42.9% for Merchandising and 20% for Services. The outcomes of predictive ability of operating cash flow across industrial sectors were found to be very significant for both rightly and wrongly predictions. The model predicted accurately the future outcomes of Service sector industries at 77.8%, Merchandising 64.3%, Manufacturing 62.5%, Oil Services 62.5% while Transport & Aviation centered around 40%.
4.2.5. Testing of Hypothesis 3
Ho3: Predictive efficacy of the two models does not change significantly as the year increases prior to Corporate failure.
The compilations from Tables 2 to 6 in this regard are as seen in Tables 14 and 15 for Z-Score and Operating Cash Flow models respectively.
In order to carry out the test for Z-Score model, Table 14 is made use of, comparing right predictions for two years prior to failure with right predictions of same model three years prior to failure, verse visa. Processing each of the aspects for Z-Score model using Friedman’s

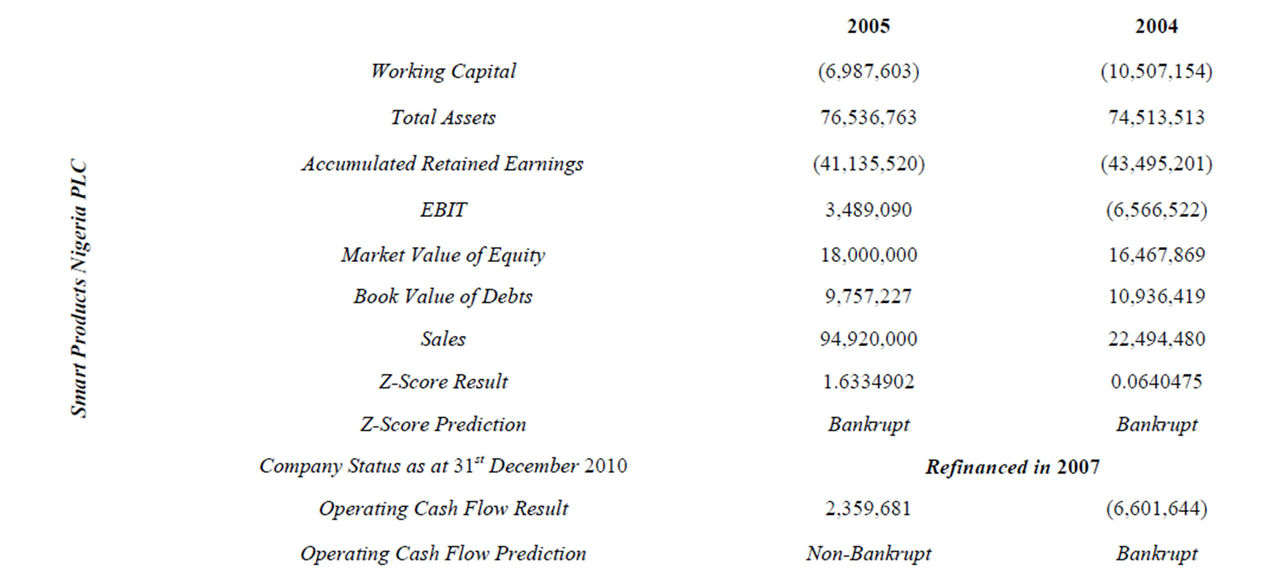
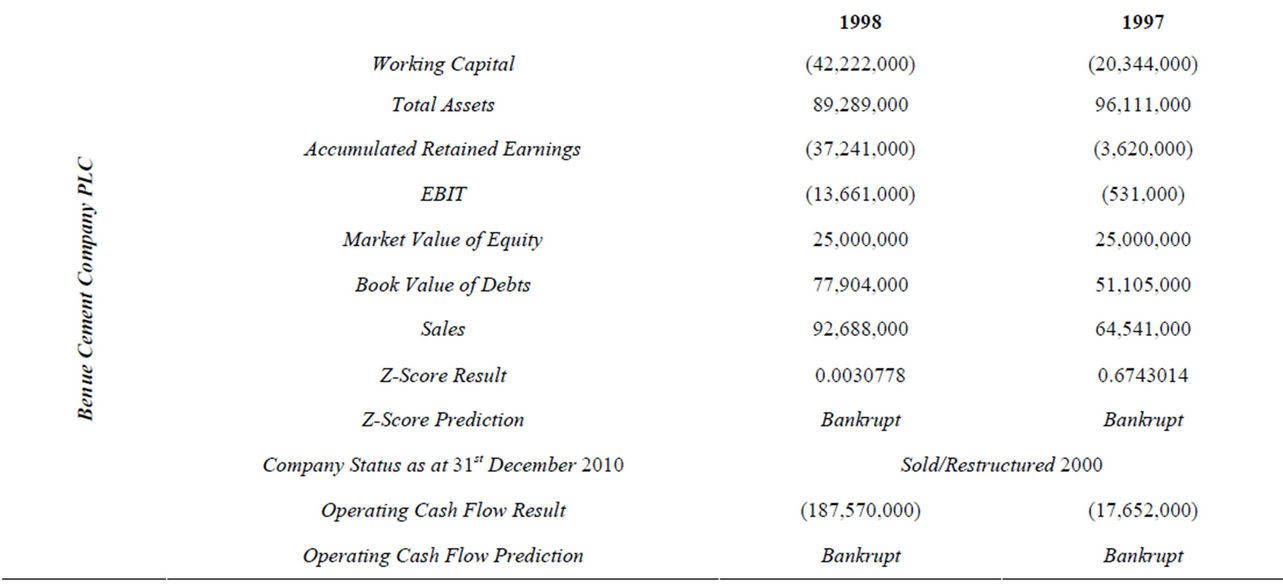
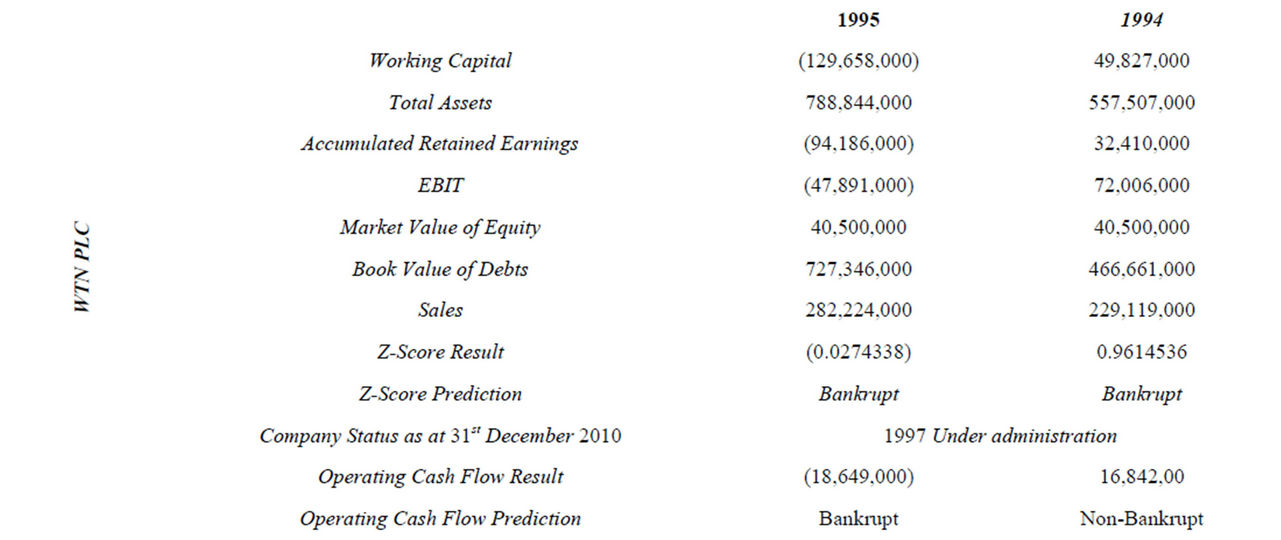
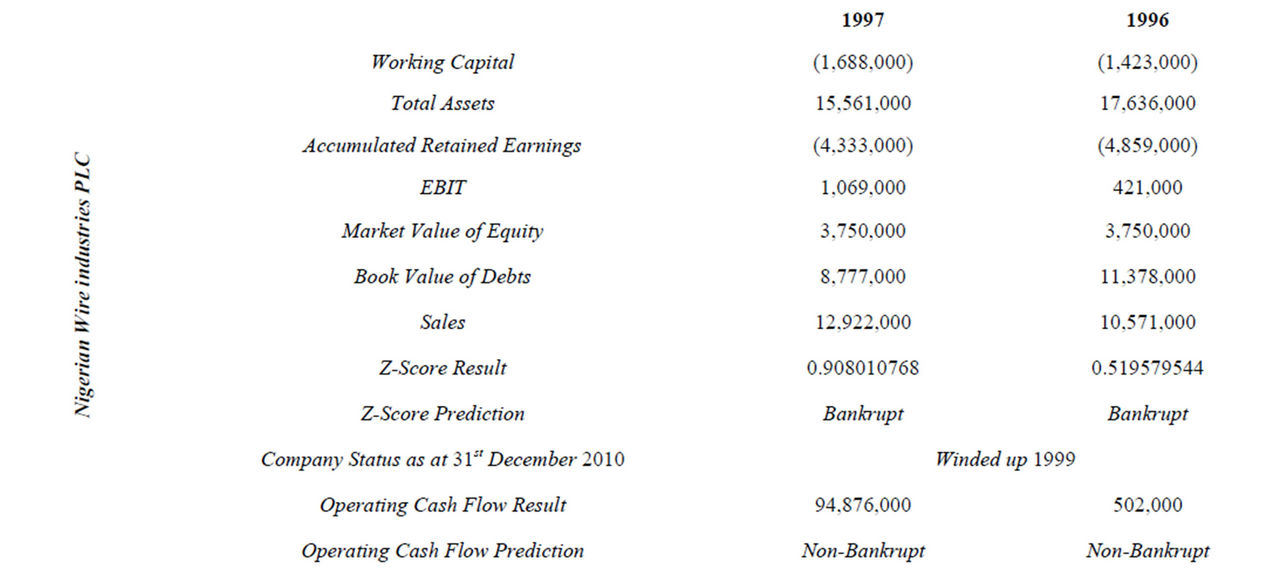
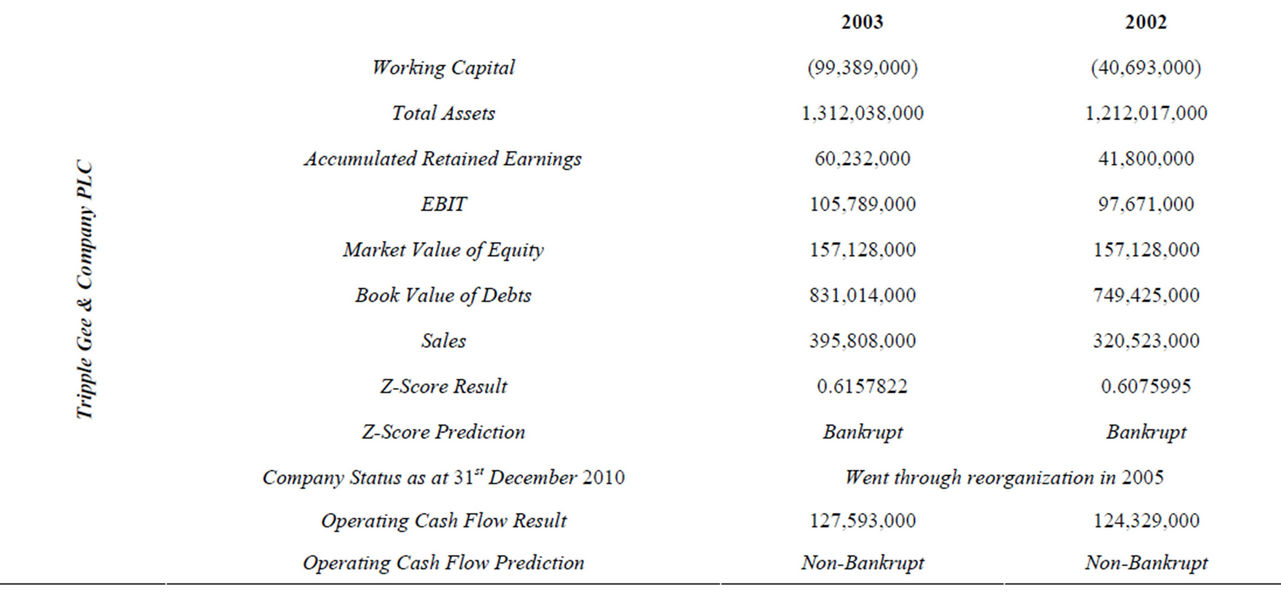
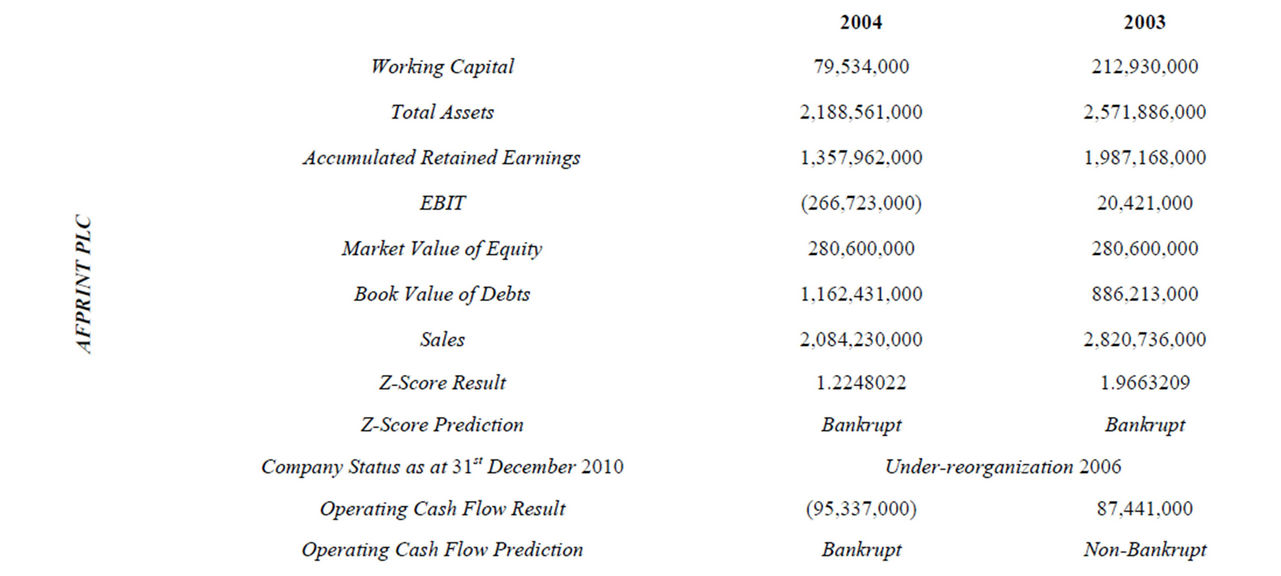


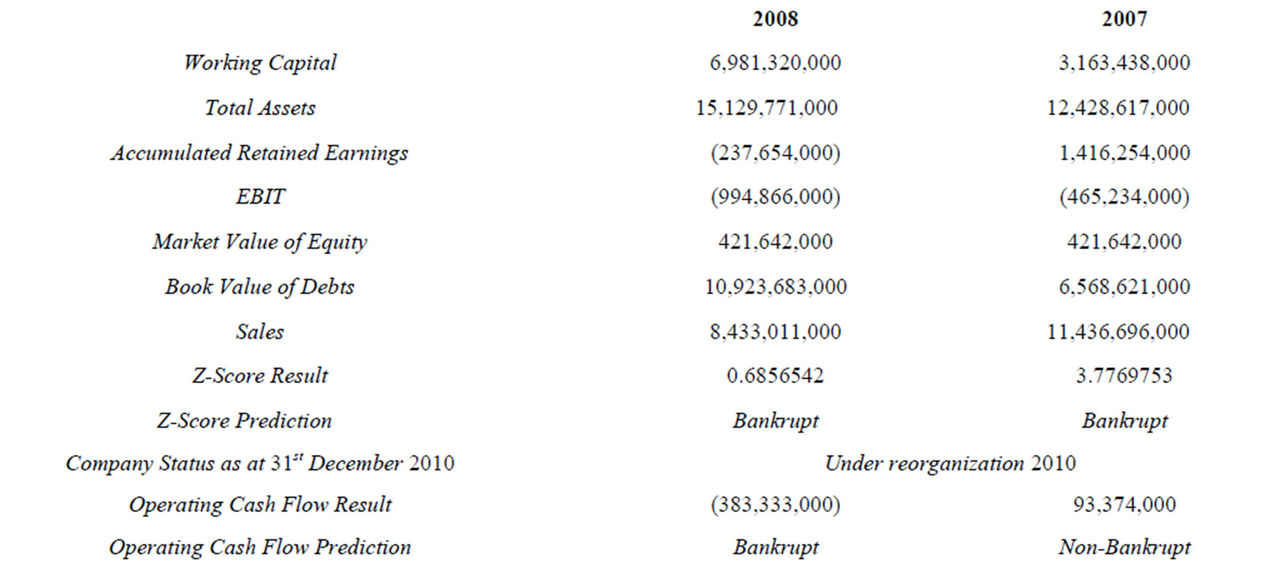
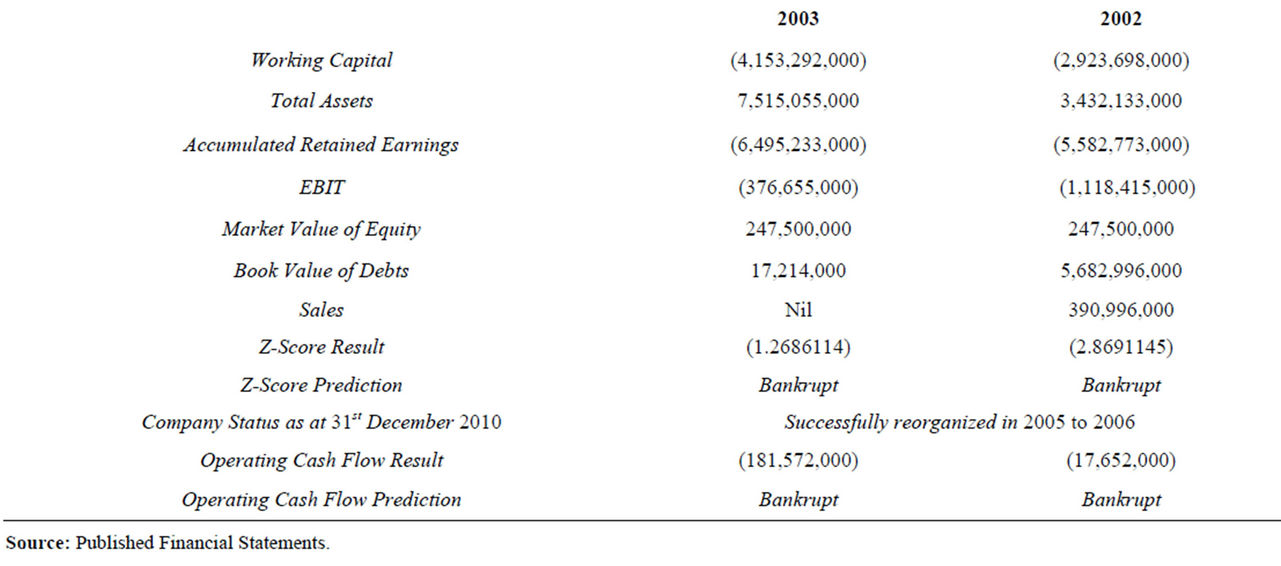
Table 6. Variables used for computation of Z-Score and operating cash flow predictions of manufacturing industrial sampled companies.
ANOVA, the test results are shown in Tables 16 and 17 for Right and Wrong predictions respectively as shown
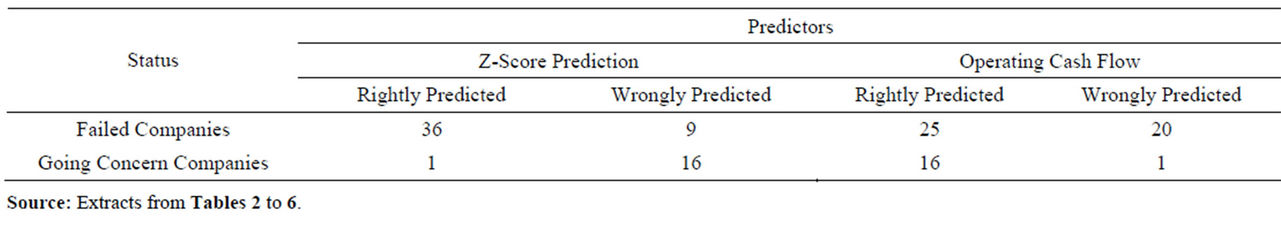
Table 7. Rightly & Wrongly predictions of Z-Score and Operating Cash Flow models for failed and going concern companies.
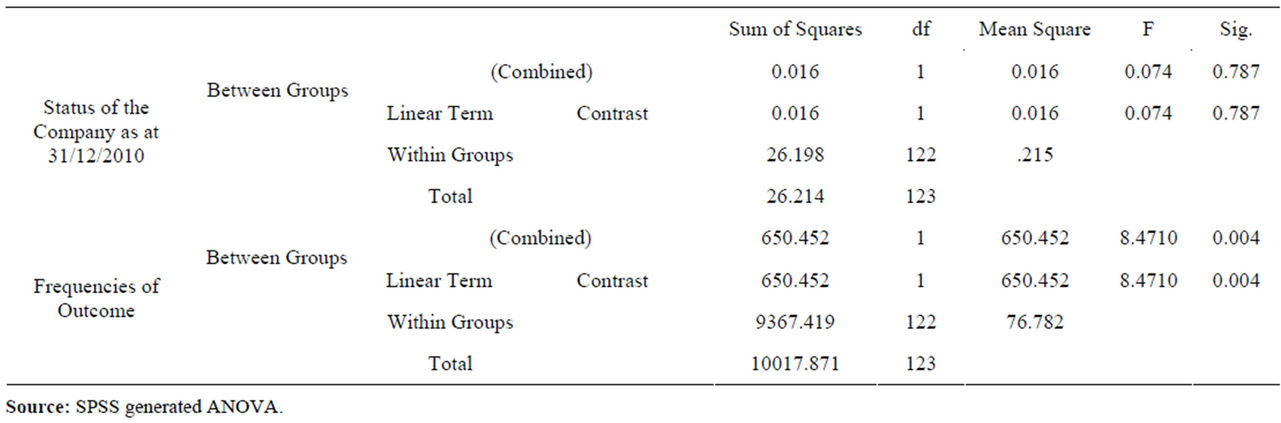
Table 8. Rightly and wrongly discriminatory ANOVA between Z-Score and operating cash flow.

Table 9. Efficacy of Z-Score and operating cash flow on predicting future status of companies expressed in percentages.
below.
4.2.6. Interpretations and Discussion of Outcomes of Aspects of Hypothesis Three Tests
The Z-Score model “right predictions” of Friedman’s ANOVA result as shown in Table 16 confirmed that there are significant differences in right prediction efficacies of the model as the year increases prior to business failure. Also the “wrong predictions” of Friedman’s ANOVA result as seen in Table 17 did confirm that there is significant changes on the predictive efficacy of Z-Score model relative to year prior to corporate failure. In both cases p < 0.05 but the variation in changes were more with “Right” Predictions than with “Wrong” predictions because the differences in chi-square value were more in right predictions than in wrong predictive efficacy of Z-Score model. In conclusion, the null hypothesis which suggests that the predictive efficacy of Z-Score model
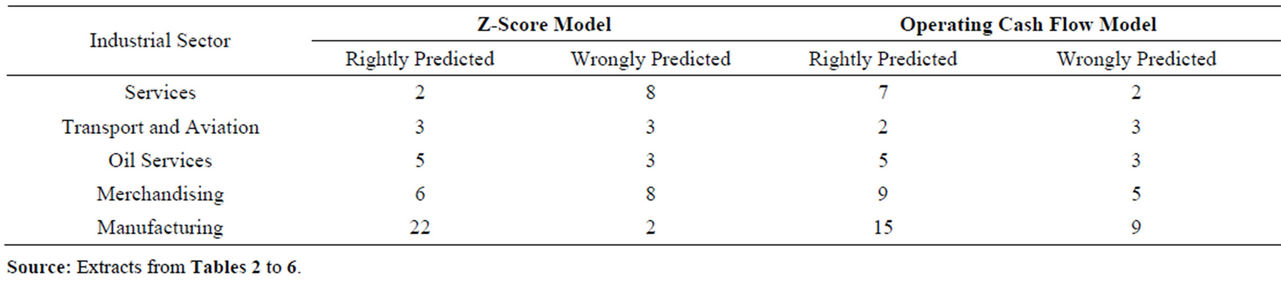
Table 10. Predictive efficacy across industrial sectors of Z-Score & operating cash models.
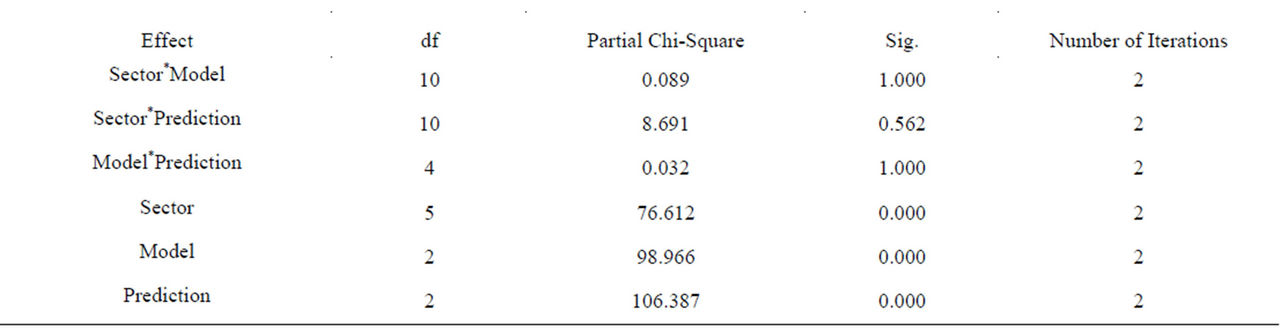
Table 11. Partial associations.
does not change significantly as the year increases prior to Corporate failure is hereby rejected. To see detailed directions of these variations in predictive efficacy of Z-Score relative to the year prior to business failures, a Cross tabulation percentage analysis is carried out. The result is as seen in Table 18.
The changes in predictive efficacy of Z-Score in two years prior to failure compared with three years prior to failure are depicted in Table 18 clearly. The table showed that for Service and Merchandising industrial sectors, there were no changes in predictions but for Transport & Aviation Sector, the right predictive efficacy of Z-Score model increases as the year tends towards failure. This is confirmed by the fact that the right prediction of the model by the third year prior to failure was 50% for Transport & Aviation but the second year prior to failure has increased to 100%. There were also increases in the predictive ability of Z-Score for both Oil Services and Manufacturing Sectors as the year under consideration becomes closer to the year of business failure. In summary, this is the direction of predictive changes from three years to two years prior to business failure inherent in Z-Score model:
• Manufacturing 90% to 100% Right Predictions (Increases in predictive ability).
• Oil Services 40% to 60% Right Predictions (Increases in predictive ability).
• Transport & Aviation 50% to100% Right Predictions (Increases in predictive ability).
• Merchandising 75% to 75% Right Predictions (No Change in predictive ability).
• Service 50% to 50% Right Predictions (No Change in predictive ability).
In conclusion of this aspect of the hypothesis, there are significant changes in the predictive efficacy of Z-Score model in Manufacturing, Oil Services and Transport & Aviation Industrial Sectors as the year towards year of failure becomes closer but there are no changes in the predictive efficacy for Service and Merchandising Industrial Sectors.
In order to test same hypothesis for Operating Cash Flow model, the data in Table 19 are processed with Friedman’s ANOVA for both predictive aspects of the model. The results are as shown in Tables 19 and 20 respectively.
4.2.7. Interpretations and Discussion of Outcomes of Aspects of Hypothesis Five Tests
As seen from Tables 19 and 20 of the results of Friedman’s ANOVA test statistics (p < 0.05), there are significant changes in the Operating Cash Flow model’s predictive efficacy as the year tends towards year of corporate failure. To understand clearly these variations, a cross percentage tabulations of these changes is computed. This tabulation is contained in Table 21.
The cross percentage analysis shown in Table 21 clearly shows that the predictive efficacy of Operating Cash Flow model changes as the year closes towards year of corporate failure. This contradicts the trend shown by Z-Score model. In contradiction to Z-Score model, the predictive efficacy of Operating Cash Flow model changes significantly as the year of corporate fail-
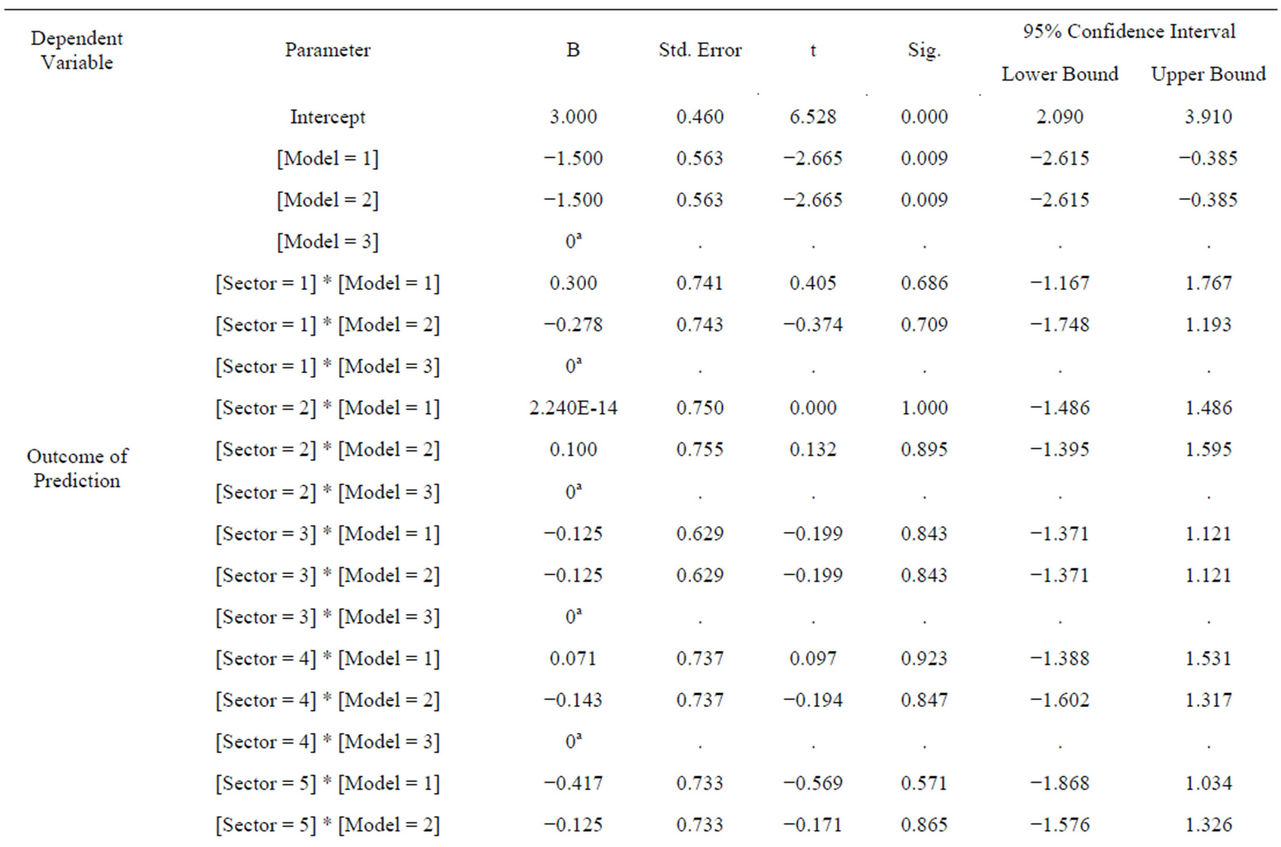
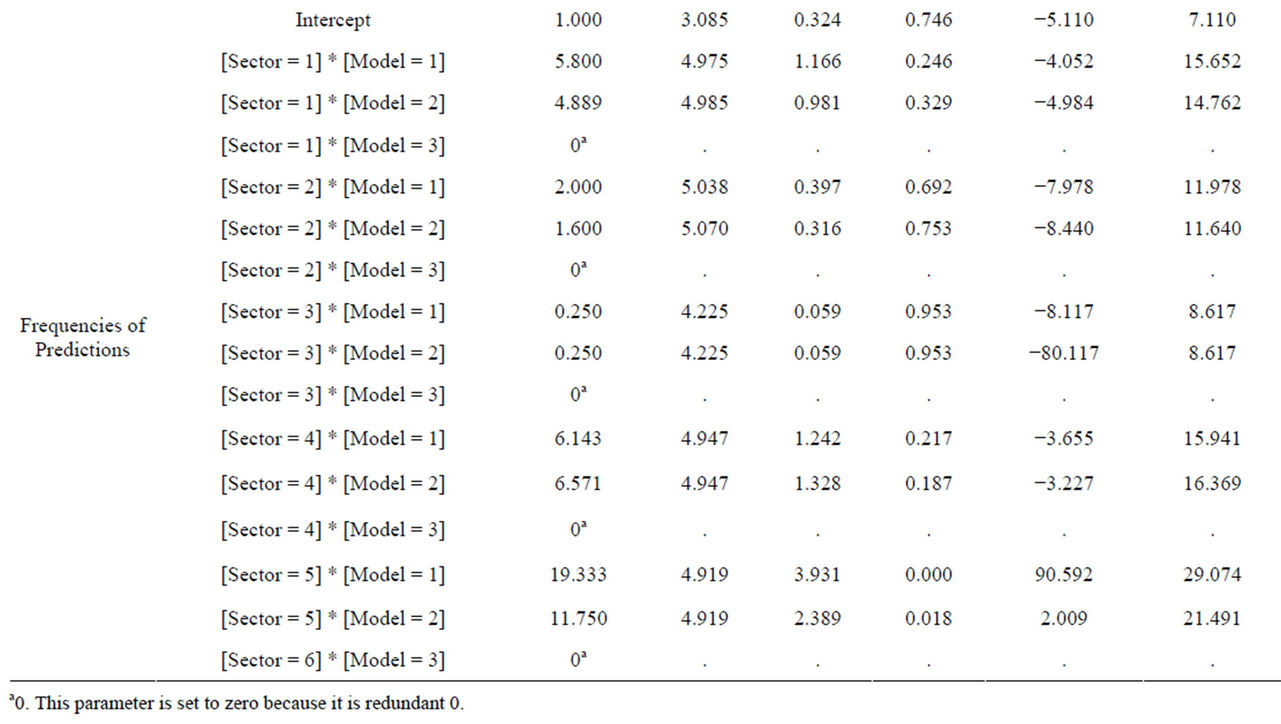
Table 12. Parameter estimates.
ures becomes nearer for Service, Transport & Aviation, Oil Services, Merchandising and Manufacturing Industrial Sectors. These predictive changes were not at same rate and towards the same directions. Using Operating Cash Flow model there are significant right prediction increases from 3 to 2 years prior to failure in the follow-
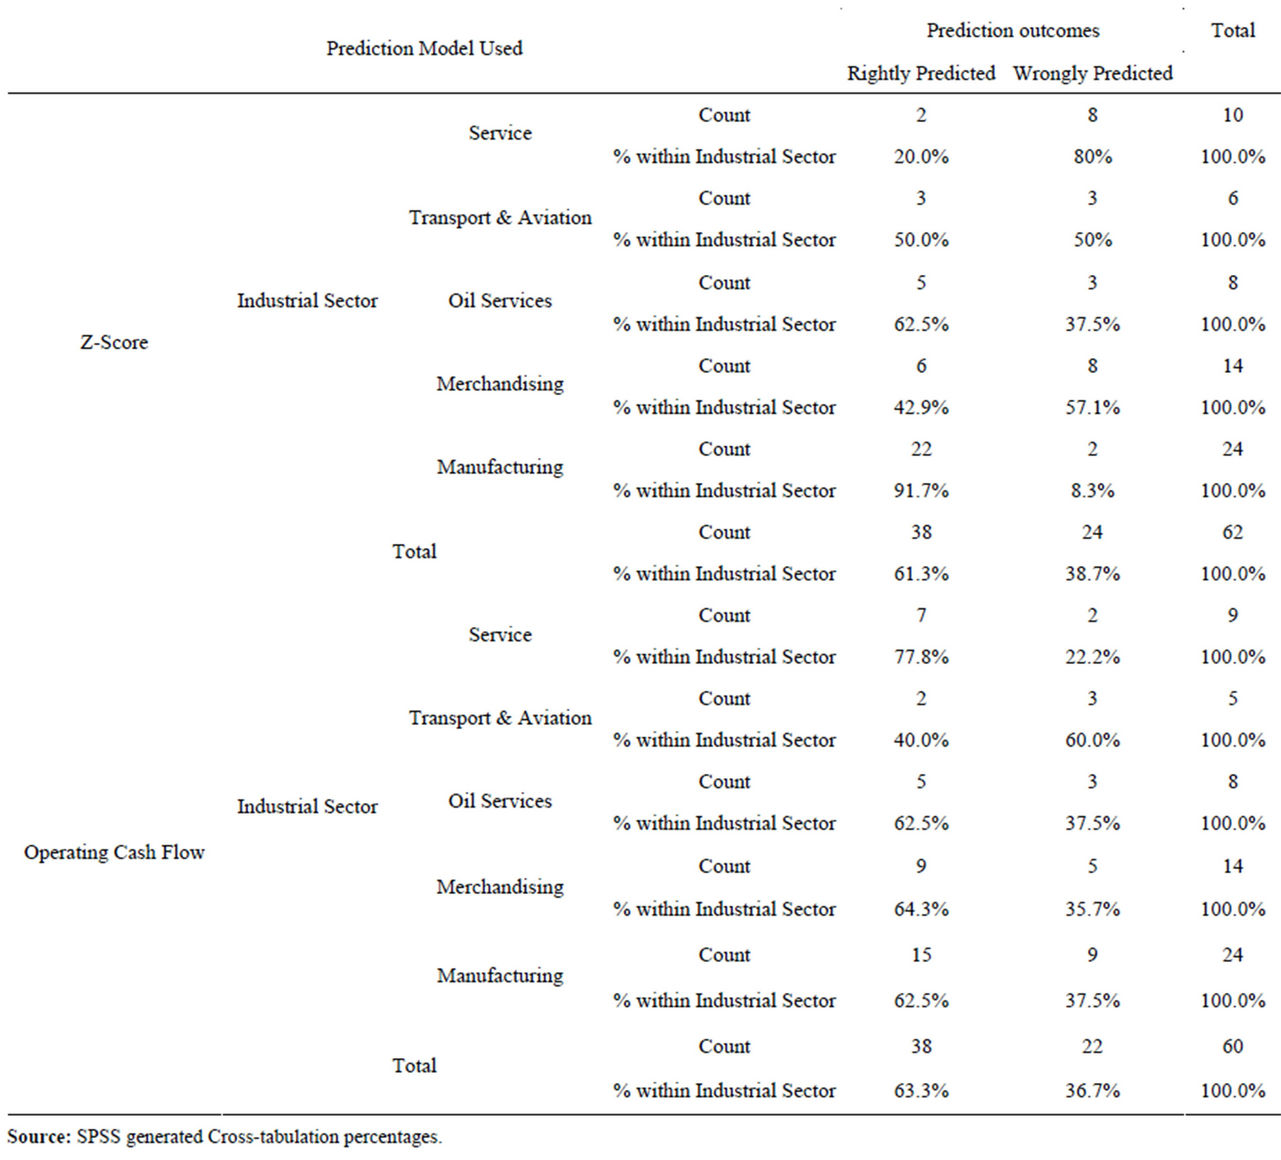
Table 13. Industrial sector predictions and outcomes of prediction models expressed in percentages.
ing sectors:
• Manufacturing : 50% to 70% Right predictions
• Oil Services : 50% to 75% Right Predictions
• Transport & Aviation 0.0% to 50% Right Predictions.
However, there were reductions in right prediction in the following sectors:
• Merchandising 75% to 0.0%
• Service 100% to 50%.
As a result of these manifest changes both in magnitude and in direction, the hypothesis which states that predictive efficacy of Z-Score and Operating Cash Flow models does not change significantly as the year increases prior to Corporate failure is therefore rejected. Alternatively the stipulation that the predictive efficacy of Z-Score and Operating Cash Flow models do change positively as the year becomes closer to the year of corporate failure, for some industrial sectors is accepted although it turns out to be negative for some but sometimes no change depending on the model in question.
4.3. Findings
The predictive efficacy of Z-Score and Operating Cash Flow models is significantly different in discriminating between would fail and going concern companies in cash economy.
From the outcome of test statistics of hypothesis three, the study found that Z-Score model has a higher efficacy of predicting would fail/failing companies than Operating Cash Flow model in cash economy. On the other hand, Operating Cash Flow model has a higher capacity to predicting more accurately going concern future status
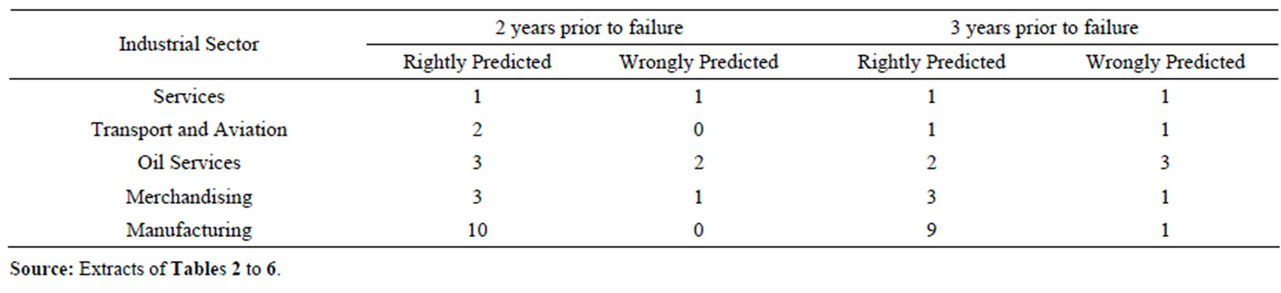
Table 14. Z-Score model’s predictive efficacy over 2 to 3 years prior to failure.
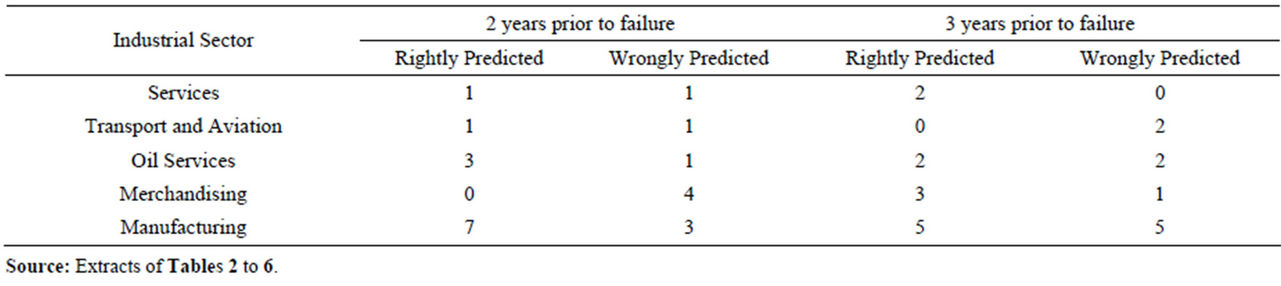
Table 15. Operating Cash Flow model’s predictive efficacy over 2 to 3 years prior to failure.

Table 16. Z-Score model’s right predictive efficacy over 2 to 3 years prior to failure—Friedman ANOVA test statistics.
of companies than failing ones. In summary, Z-Score model is highly effective in predicting the future faith of failing companies but less effective in asserting the future status of going concern companies in cash economy. Also found to be effective in predicting insolvency in cash economy is Operating Cash Flow model but it is more effective in testing corporate future solvency stress status of going concern companies than failing companies. Z-Score model predicted correctly 79.5% failed companies before they eventually failed. This result can conveniently help us to assert that Z-Score Insolvency prediction model level of efficacy is more than 79% with corporate bodies operating in Cash Economy.
Analysis of predictive efficacy across industrial sectors shows that the predictive ability across industries in developing economy between Z-Score and Operating Cash Flow model is not significantly different. On individual basis, Z-Score predictive efficacy across industrial sectors is accurate within the range of 91.7% for manu-

Table 17. Z-Score model’s wrong predictive efficacy over 2 to 3 years prior to failure—Friedman ANOVA Test Statistics.
facturing, 62.5% for Oil Services, 50% for Transport & Aviation, 42.9% for Merchandising and 20% for Services. On the other hand, The outcomes of predictive ability of operating cash flow across industrial sectors were found to be very significant for both rightly and wrongly predictions. The model predicted accurately the future outcomes of Service sector industries at 77.8%, Merchandising 64.3%, Manufacturing 62.5%, Oil Services 62.5% while Transport & Aviation centered around 40%. Precisely, there are significant differences in the efficacy of predictions between Z-Score and Operating Cash Flow models across industrial sectors. While Z-Score model is found to be more effective in its accurate predictive ability on Manufacturing and Oil Service Sectors, Operating Cash Flow Model is seen to be more effective in predicting accurately Service and Merchandising Sectors. It should be noted that Z-Score model showed a poor accurate predictive capacity on both Service and Merchandising sectors while Operating Cash Flow model was

Table 18. Z-Score model’s predictive efficacy over 2 to 3 years prior to failure cross tabulation percentages.

Table 19. Operating Cash Flow model’s Right predictive efficacy over 2 to 3 years prior to failure—Friedman ANOVA test statistics.
equally found to be a poor prediction tool for Transport & Aviation industrial sector. On the average, operating cash flow is a better predictor across industrial sectors.

Table 20. Operating Cash Flow model’s wrong predictive efficacy over 2 to 3 years prior to failure—Friedman ANOVA test statistics.
The research outcomes showed that the predictive efficacy of Z-Score model does change significantly as the year becomes closer prior to Corporate failure. Results
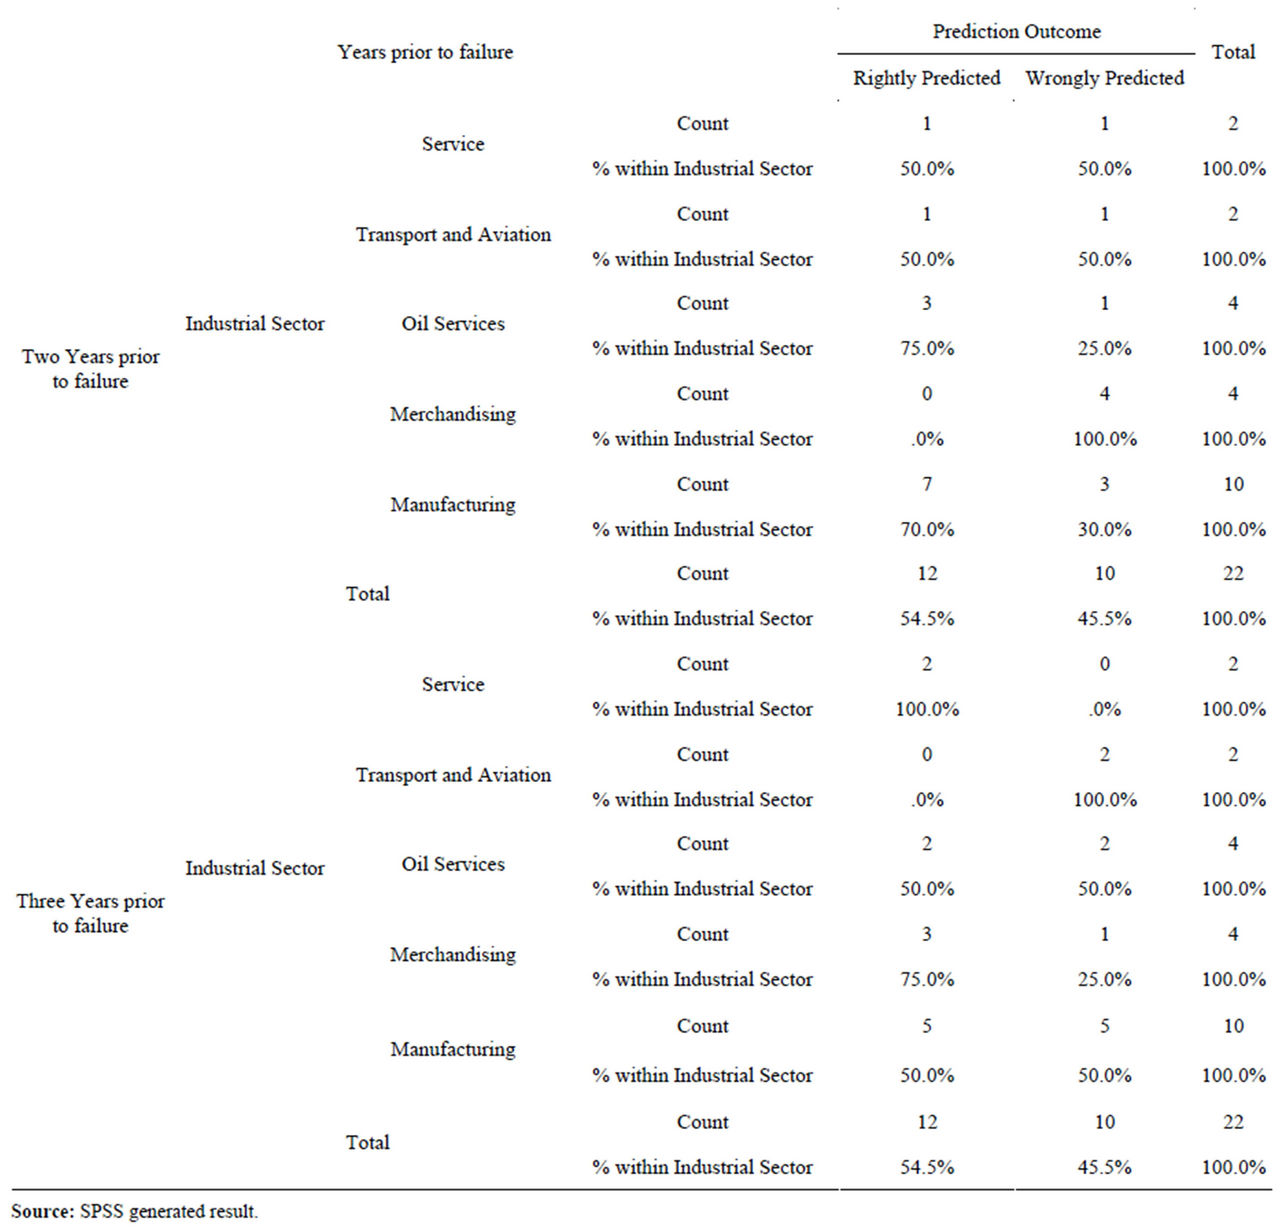
Table 21. Operating Cash Flow model’s predictive efficacy over 2 to 3 years prior to failure cross tabulation percentages.
showed that for Service and Merchandising industrial sectors, there were no changes in predictions but for Transport & Aviation Sector, the right predictive efficacy of Z-Score model increases as the year tends towards failure. This is confirmed by the fact that the right prediction of the model by the third year prior to failure was 50% for Transport & Aviation but the second year prior to failure it has increased to 100%. There was also increase in the predictive ability of Z-Score for both Oil Services and Manufacturing Sectors as the year under consideration becomes closer to the year of business failure. The predictive efficacy of Z-Score and Operating Cash Flow models do change positively as the year becomes closer to the year of corporate failure for some industrial sectors, negative for some but sometimes no change depending on the model in question Further analysis of many of the tested samples possessing material symptoms of insolvency which were predicted to be very insolvent by both Operating Cash Flow and Z-Score models but are still going concern companies as at the cut-off date were found to be owned by the Government. These companies were technically insolvent but cannot be financially insolvent because, the Government from time to time inject further fund into them. Apart from further injection of funds into these technically insolvent companies, it was confirmed that these Government Companies’ liabilities were owed to different levels or organs of Government which by law cannot bring actions that will liquidate their debtor companies. Government owned companies that are still going concern despite confirmed by the two models that they are technically insolvent represent 67% of companies that are still in operation as at the research cut-off date.
4.4. Recommendations
It is our recommendation that:
1) Z-Score model should be employed for prediction of corporate failure for Manufacturing and Oil Service industrial sectors while operating cash flow is better used for the prediction of corporate failures for Merchandising, Transport, Aviation and Service industrial sectors.
2) Though technical insolvency is not a sign of corporate bankruptcy surely it is an indicator of negative Corporate Solvency Stress test. Where Government owned or substantially owned Firm is confirmed technically insolvent, further dealings with such Organization is advised to be carried out on cash basis because there is all indication that payment may be defaulted on the part of such Organization on completion of the transaction. However, where there is foreseeable evidence of injection of funds from the Government on or before the completion of the transaction, this stipulated solvency fears may be waived.
REFERENCES
- L. Beloqui, J. M. Usategui and M. Tran, “Emerging Economies,” 2008. www.answers.com/topic/emerging-markets
- FIN24.com, “13 Banks Liquidated in Nigeria,” 2009. http://www.cenbank.org/MonetaryPolicy/policy.asp
- J. A. Ibiyemi, “Introduction to Insolvency Practice in Nigeria,” Spectrum Books Limited, Ibadan, 1999, pp. 3-60.
- B. T. Kloster and H. D. Jacobsen, “What Influences the Number of Bankruptcies?” Economic Bulletin, Vol. 76, No. 4, 2005, pp. 191-211.
- K. P. Coats and L. F. Fant, “Recognizing Financial Distress Patterns Using Neural Network Tool,” Financial Management, Vol. 23, No. 3, 1993, pp. 142-154. doi:10.2307/3665934
- R. L. Wilson and R. Sharda, “Bankruptcy Prediction Using Neural Networks,” Decision Support Systems, Vol. 11, No. 5, 1994, pp. 545-557. doi:10.1016/0167-9236(94)90024-8
- D. E. O’Leary, “Using Neural Networks to Predict Corporate Failure,” International Journal of Intelligent Systems in Accounting, Finance and Management, No. 7, 1998, pp. 187-197.
- E. Neophytou, A. Charitou and C. Charalambous, “Predicting Corporate Failure, Empirical Evidence for the United Kingdom,” Journal of Finance, Vol. 16, No. 3, 2000, pp. 884-908.
- Goliath, “Corporate Bankruptcy Prediction Models Applied to Emerging Economies: Evidence from Argentina in the Years 1991-1998,” International Journal of Commerce and Management, Vol. 17, No. 4, 2007, pp. 295- 311.
- G. Thornton, “Corporate Governance Series-Zone of Insolvency: Decision-Making in Times of Distress,” 2010. http://www.gt.com/staticfiles/../Corporate%20goverance/CG_Insolvency.pdf
- M. A. Rujoub, D. M. Cook and L. E. Hay, “Using Cash Flow Ratios to Predict Business Failures,” Journal of Managerial, Vol. 7, No. 1, 1995, pp. 47-72.
- C. Casey and N. Bartczak, “Using Operating Cash Flow Data to Predict Financial Distress: Some Extensions,” Journal of Accounting Research, Vol. 23, No. 1, 1985, pp. 384-401. doi:10.2307/2490926
- D. S. Sharma, “The Role of Cash Flow Information in Predicting Corporate Failure—The State of the Literature,” Accounting Forum, Vol. 27, No. 4, 2001, pp. 1-26.
- N. Kuruppu, F. Laswad and P. Oyelere, “The Efficacy of Liquidation and Bankruptcy Prediction Models for Assessing Going Concern,” Centre of Accounting Education and Research, 2002, pp. 1-18.
- J. R. Franks, K. G. Nyborg and W. N. Torous, “A Comparison of US, UK, and German Insolvency Codes,” Financial Management, Vol. 25, No. 3, 1996, pp. 86-101. doi:10.2307/3665810
- S. M. Schultz, “Financial Reporting for firms in Chapter 11 Reorganization,” National Public Accountant, Vol. 40, No. 1, 1995, pp. 2-24.
- K. M. J. Kaiser, “European Bankruptcy Laws: Implications for Corporations Facing Financial Distress,” Financial Management, Vol. 25, No. 3, 1996, pp. 67-85. doi:10.2307/3665809
- G. Omoh, “Two Million Registered Companies in Nigeria,” 2012. http://omohgabriel.com/two-million-registered-companies-in-nigeria/..0.2
- W. G. Cochran, “Sampling Techniques,” 2nd Edition, John Wiley & Sons, New York, 1963, p. 75.
- A. S. Ross, W. R. Westerfield and J. Jaffe, “Corporate Finance,” 6th Edition, The McGraw-Hill/Irwin Companies, Incorporated, Boston, 2002, pp. 172-871.
- E. I. Altman, “Predicting Financial Distress of Companies Using Z-Score & Zeta Models,” Working Paper, Stern School of Business, New York University, 2000, pp. 22- 24.
NOTES
*Corresponding author.