International Journal of Medical Physics, Clinical Engineering and Radiation Oncology
Vol.3 No.2(2014), Article ID:45719,11 pages DOI:10.4236/ijmpcero.2014.32012
Wave Reflection at the Boundary Layer and Initial Factors of Atherosclerosis
Guram Beraia1, Merab Beraia2*
1Medical University, Tbilisi, Georgia
2Institute of Clinical Medicine, Tbilisi, Georgia
Email: beraiaguram@gmail.com, mberaia@hotmail.com
Copyright © 2014 by authors and Scientific Research Publishing Inc.
This work is licensed under the Creative Commons Attribution International License (CC BY).
http://creativecommons.org/licenses/by/4.0/


Received 8 February 2014; revised 7 March 2014; accepted 6 April 2014
ABSTRACT
The aim is to study the blood flow and vessel wall viscoelastic alterations at the boundary layer. Methods and Results: In 12 healthy men (18 - 52 years of age) at the different sites of the aorta peak velocity, net flow, flow acceleration has been investigated by Magnetic Resonance Angiography. In the aortic arch in the end systole blood flow separates into the opposite directed streams resulting in the wave superposition. At the outer curvature of the isthmus, flow acceleration in the initial diastole is 6.26 times higher than that in systole. Net flow from systole to diastole increases 2.5 ± 0.5 folds. From the end systole to the initial diastole there is a plateau on the net flow graph. At the outer curvature of isthmus, group wave at the boundary reflection, changes in phase at 180˚. Herewith, flow wave oscillation frequency at the outer curvature is two times higher (2.5 Hz) than that at the inner (1.25 Hz). Conclusion: During the heart cycle, blood motion at the boundary layer, forms the surface wave and facilitates the blood structural rearrangement and flow. At the end systole, at the outer curvature of the isthmus, pulse pressure at the reflection is in the resonance with the end systolic pressure drop. Amplitude of the wall stress increases. Forming standing wave leads to the dissipation of the wall mechanical energy. Here, in the initial diastole, group wave, due to the wave reflection and frequency dispersion, facilitates the structural rearrangement/denudation of the vessel wall. By the removing resonance oscillation during the end systole/initial diastole between the heart and vessel wall, atherosclerosis can be avoided.
Keywords:Shear Stress, Boundary Layer, Viscoelasticity, Resonance, Wave Reflection

1. Introduction
Atherosclerosis is the leading cause of death in the developed world and nearly the leading cause in the developing world. Nonetheless, atherosclerosis remains a geometrically focal disease, preferentially affecting the outer edges of vessel bifurcations [1] -[3] .
Two contradictory hypotheses were advanced in the 1970s to explain this distribution of lesions [4] . The first implicated high shear stress via direct endothelial injury and denudation, as suggested by experimental exposure of endothelium to supraphysiological shear stress. The second invoked low shear stress.
Experimental and clinical observations have noted that early endothelial injury is more likely to occur in areas of blood flow separation and low shear stress. Flow in the middle of the arterial lumen is laminar; however, the outer area of boundary layer separation has slower more disturbed urgency. These areas of low shear force tend to occur at the outer walls of arterial branch points and have been shown to induce endothelial dysfunction [5] .
It has long been hypothesized that low wall shear stress and the resultant stagnation of blood permit increased uptake of atherogenic blood particles as a result of increased residence time. Prolonged oscillatory shear stress induces expression of endothelial leukocyte adhesion molecules, which are important in mediating leukocyte localization in the arterial wall [6] [7] . Changes in shear forces acting on the vessel wall characterized by wall shear stress or oscillatory shear index can lead to the development of aortic plaques. Increased transient boundary layer thickness and reduced surface energy of adhesion in regions of the arterial branch points play crucial roles in initial lesion formation in atherosclerosis.
Blood flow near the intima, referred to as the boundary layer, is slower and has more disturbed currents. The deduction of the boundary layer equations was one of the most important advances in fluid dynamics. Using an order of magnitude analysis, the well-known governing Navier-Stokes equations of viscous fluid flow can be greatly simplified within the boundary layer [8] [9] .
In the blood circulation it is significant that the blood is thixotropic and has shear thinning property [10] . It can be transforms to be thick at the heart chambers, and becomes thin, less viscous over time when shaken, agitated, or stressed [11] . With the increasing velocity gradient in the blood flow nonlinear properties develop [12] . The viscous component of the complex viscosity becomes the order of the steady flow viscosity at high gradients while the elastic component tends to decrease in inverse proportion to the gradient [13] .
Blood flow is pulsatile Pulse pressure, reflecting the pulsate component of blood pressure and thus to some extent arterial stiffness, is a well-known risk factor for atherosclerosis [14] [15] . Pressure wave reflection may play a role in the manifestation of the augmentation of systolic pressure. Because wave dispersion depends on differences in pulse wave velocity of different frequency components and as such may provide further indication of risk than group velocity measurement, it may also be a potential surrogate end point to clinical trials of agents aimed at directly modulating arterial stiffness [16] . Arterial walls are anisotropic and heterogeneous, composed of layers with different biomechanical characteristics whose stress-strain relationships are nonlinear and exhibit creep, stress relaxation and hysteresis [17] .
Separation zones and low/oscillatory shear stress play an important role in the development of arteriosclerosis. However, blood viscoelasticity in conjunction with the wave reflection in the analysis of the shear stress, is not yet studied. An explanatory mechanism for this association has begun to evolve. Estimation of wall shear stress is now possible with noninvasive imaging techniques such as MR imaging and Doppler sonography. MR imaging can be used to confirm, in vivo, what is known from in vitro hemodynamic studies and observations made at autopsy and in experimental models. Someday, this may help us better understand the importance of flow hemodynamic in the multifactorial etiology of atherosclerosis.
2. Material and Methods
In 12 healthy men (18 - 52 years of age) peak velocity, mean velocity, mean flow and net flow in the aorta have been investigated by PC MR angiography with a 1.5T MR imager with the breath hold and ECG triggering.
Pulse rate 72 to 78 beats per minute. Systolic pressure was 115 ± 15 mmHg, Diastolic 70 ± 10 mmHg. Volunteers were preliminarily examined by a cardiologist, angiologist and hematologists.
MRA with the flow quantification was carried out. Regional flow parameters were calculated at the inner and external wall of the ascending aorta, aortic arch and thoracic aorta in 1 mm MR slices in the 0.7 cm2 circle area (Figure 1). Mean data are given below in Table 1 and graphs (Figure 2). Examinations were performed with surface coil technology, with a gradient strength 40 mT/m and a maximum slew rate 200 mT/m/msec.
3. Results
Flow velocity at the inner curvature is higher than that at outer. In the aortic arch in end diastole the blood flow
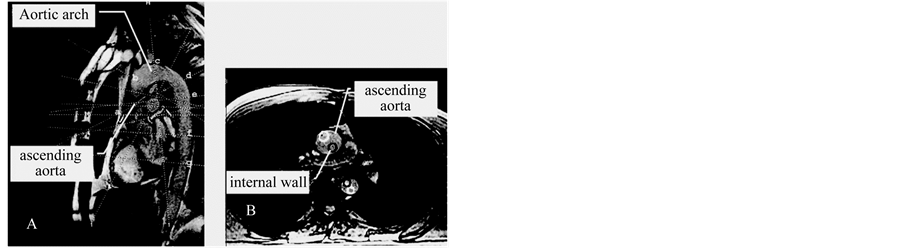
Figure 1. Sites of measurement of the blood flow in the aorta. Dotted lines indicate the imaged slices at different walls of the aorta: a-b: ascending aorta, c: aortic arch, d-e: isthmus area, f-g: thoracic aorta. (Darken circle-inner curvature). Sagittal view-A, axial view-B.
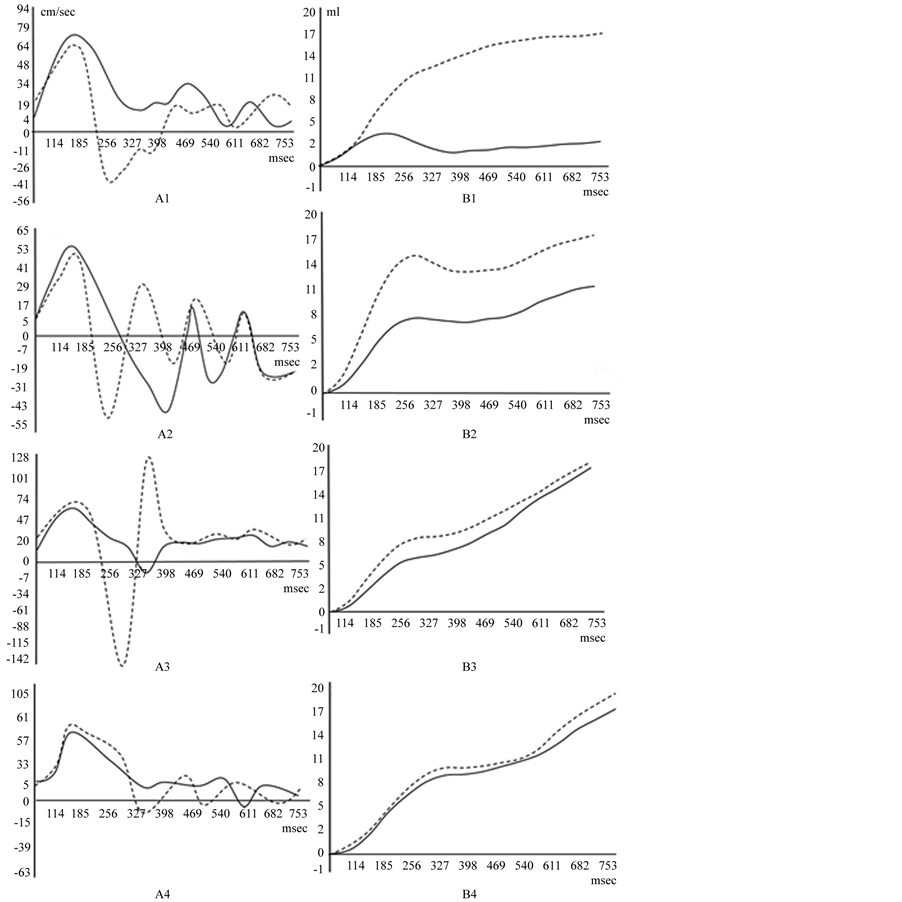
Figure 2. Peak blood flow velocity A, and net flow B.

Table 1. Flow velocity and acceleration in different sites of the aorta.
separates into the opposite directed streams resulting in the wave superposition.
Opposite flow waves in superposition form the wave envelope propagating in ante grade direction. In peak flow graph, at the outer curvature of the isthmus, flow acceleration in the initial diastole is 6.26 times higher than that in systole.
Net flow from the end systole to diastole increases 2.5 ± 0.5 folds. From the end systole to the initial diastole there is a plateau on the net flow graph.
At the outer curvature of isthmus, group wave at the boundary reflection, changes in phase at 180˚.
Flow wave oscillation frequency at the outer curvature is two times higher (2.5 Hz) than that at the inner (1.25 Hz).
• At the ascending aorta (1). (Dotted line―flow at the outer curvature). Blood flow velocity at the outer curvature is lower, than that at the inner. At the peak velocity graph separated streams flows in the opposite directions. Net flow increases at the end diastole.
• At the aortic arch (2) on the outer curvature forward wave spreads to the periphery, where it does not dissipate, but is reflected back to central vascular system. Standing waves arise. Flow direction alteration is in many times. The resulting waveform is determines by the phase sum of forward and reflected waves. Wave envelope forms the group wave nodule at the 300 msec. On the net flow graph from the end systole to the initial diastole there is a plateau.
• At the isthmus of the aorta (3) from the 185 msec, blood flow separates into the opposite directed streams resulting in the wave superposition. The group wave at 327 msec. forms the wave nodule. Zero flow velocity is specified to the whole volume in the single slice. In the initial diastole peak velocity sharply increases at the outer curvature and is higher than that in systole. Net flow increases at the end diastole, while from the end systole to the initial diastole there is a plateau.
• At the thoracic aorta (4). Wave at 327 msec. forms the nodule. Flow at the different walls is equalizes.
4. Discussion
The biologic response of the endothelium to the hemodynamic forces is important in atherosclerosis. In the development of arterial disease it is significant to investigate “altered” flow conditions at the boundary layer [18]. In fluid mechanics, a boundary layer is that layer of fluid in the immediate vicinity of a bounding surface where effects of viscosity of the fluid are considered in detail [19] . The boundary layer distorts surrounding non-viscous flow. This effect is related to the Womersley number. It is a dimensionless expression of pulsate flow frequency in relation to viscous effects.
Shear stress and cyclic circumferential strain are two main hemodynamic variables, whose action is focused primarily on the vascular endothelium. At the wall shear stress up to the 40 N/m2, the endothelial lining of the arterial wall becomes disrupted. However, according to the references, the wall shear stress in blood vessels is much below the specified level.
Measurements of wall shear stress in aorta are consistent with the hypothesis that low wall shear stress contributes importantly to conditions that favor atherogenic transformation, but the localization of the plaque, sometimes are different. The convex side of the aortic arch exhibits, relatively to the concave side, high wall shear stress (WSS) values. High WSS is encountered at the convex side of the end ascending and early descending aorta at all pulse wave times. Particular low WSS values appear along the concave parts of the ascending-descending aorta at regions located just downstream to the left subclavian artery. It is evident that the LDL levels at the surface of the endothelium increases with decreasing WSS. WSS plays an important role in LDL levels at the surface of the endothelium [20] . The near-wall flow (and as a consequence, the WSS) affects the concentration boundary layer and, again, regions prone to atherosclerotic development seem to co-locate with regions of high LDL accumulation [21] .
Critical wall parameters (low WSS and high oscillatory index-OSI) were found at the left inner curvature of the ascending aorta, near the supra-aortic branches, and the inner curvature of the descending aorta. Most pronounced exposure to critical wall parameters was at the right inner curvature of the proximal descending aorta. Noticeably, the distribution of atherogenic wall parameters was near typical locations of atherosclerotic lesions but did not resemble the plaque distribution. The one-to-one correlation of plaque location and wall parameters revealed a consistent relocation of critical wall parameters by 90˚ or 180˚ in segments adjacent to the location of complex plaques [22] .
It is specified that in the presence of a completely advanced stream of liquid in a straight pipe with the diameter-d, amplitude of wave fluctuations of velocity-v, viscosity of blood μ and at the flow frequency parameter (Womersley) α, the amplitude of fluctuations of the wall shear stress is:
τ = 2vαμ/d.
According to our data, at the external curvature of the ascending aorta d = 0.025 m, peak systolic velocity vsys = 0.84 m/s, α = 20, μ—0.004 N.s/m2, and the peak value of the wall systolic shear stress equal to τsys = 5.38 N/m2 will be obtained. At the external curvature of the central aortic arch the peak systolic velocity vsys = 0.48 m/s, τsys = 3.07 N/m2, at the same place the end systole peak velocity is vesys = 0.55 m/s. If you take into account that the diameter of the separate streams is at least 2 times smaller than the aortic diameter, then τesys = 14.08 N/m2.
The systole peak velocity at the external curvature at the isthmus area vsys = 0.60 m/s, τsys = 3.85 N/m2, while at the same place at the initial diastole peak velocity is vidias = 1.42 m/s. τidias = 18.18 N/m2.
The wave nature of pressure and flow in the arteries has long been recognized. Although the physics of pulse wave propagation and reflection is well understood, it is not clear how reflections contribute to arterial load or how they affect blood pressure and flow in the dynamically coupled heart-arterial system. We give theoretical basis and experimental confirmation, that the flow at the boundary layer can be facilitated by the wave reflection.
On each artery affected by a pulse wave, three coherent phenomena can be observed: the increase of blood pressure, pressure pulse, extension of transverse profile, volume pulse, and flow pulse [23] .
Blood stroke volume forming distension of the medium in the Valsalva sinuses and circumferential pulse pressure propagates through the aorta in waveform by viscoelastic deformation of the blood and vessel wall. Pulsate blood flow adjacent to the vessel wall, at the boundary layer, undergo to mutually perpendicular directed sinusoidal oscillated forces with the different phases: a. axially directed component of the circumferential force (longitudinal pulse pressure) forming shear stress, and b. radial directed component (transversal wave) of the circumferential force forming wall tensile stress.
Longitudinal wave travels through the bulk of the blood and is made up of compressions and rarefaction of the substance. In the longitudinal wave particle of the medium is displaced in a direction parallel to the energy transport. A compression is a point on a medium through which a longitudinal wave is travelling, that has the maximum density and high pressure. Here vessel wall extends, forming transversal wave. It is made up of crests and troughs. At the bulk flow, compression creates phase delayed transversal wave. In the boundary layer they form the surface wave rotation in the blood and adjacent vessel wall (Figure 3).
Wave rotation at the boundary layer is explainable, by the stress-strain induction in the viscoelastic substance. Viscoelasticity of the substance can be examined due to the determining the effect of the oscillating force, on the movement of the material. In transient experiments if the stress is held constant, the strain increases with time (creep); if the strain is held constant, the stress decreases with time (relaxation). In the dynamic experiments either stress or strain is varied cyclically with time, and the response is measured at various frequencies [24] .
In the varying stress the shear strain rate lags behind the changes in the causative force by a phase angle φ. φ is zero for an ideally elastic gel, and 90˚ for an ideally viscous liquid. The resulting interaction forms Lissajous figure as a circle (Figure 4).
Ratio of the maximum stress to the maximum strain is shear modulus G*. In varying strain:
G* = G′ + iG″
G′—storage modulus, G″—loss modulus, i—imaginary number.
Fluid flow on the opposite walls have geometric interpretation by the imaginary number-i, it is found on the
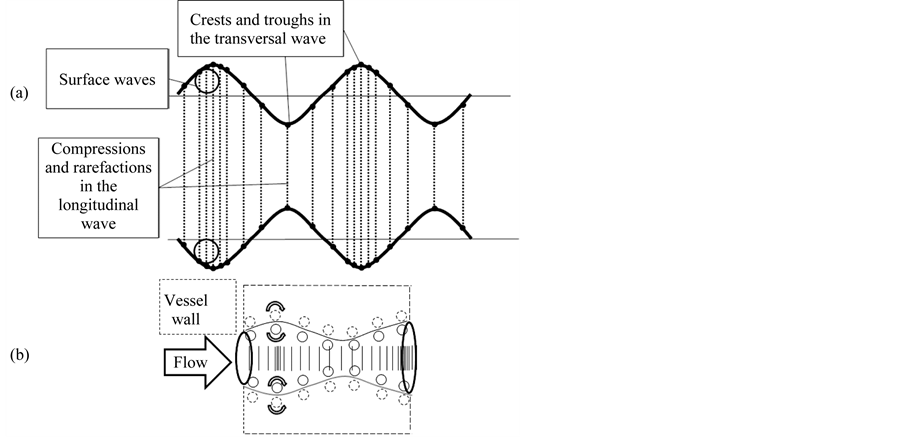
Figure 3. (a) Correlation between transverse and longitudinal waves. A transverse wave is made up of crests and troughs while a longitudinal wave is made up of compressions and rarefaction. (b) Surface wave formation at the boundary layer and the adjacent vessel wall.
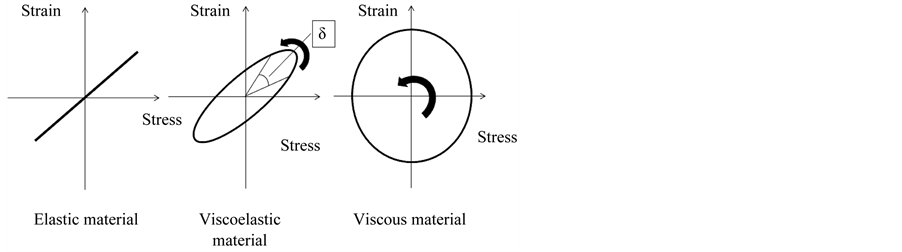
Figure 4. Stress-strain curves illustrating different types of behavior. δ-Quantifies the balance between energy loss and storage. Sinusoidal stress and resulting strain induced in elastic, viscoelastic and viscous material. Strain-stress interaction in the oscillating blood flow is the basis for the surface wave rotation at the boundary layer.
vertical axis of the complex number plane (flow direction), allowing them to be presented perpendicular to the real axis. Multiplication by i corresponds to a 90-degree rotation in the “positive” direction i.e., counterclockwise (i2 = −1 is interpreted as two 90-degree rotations about the origin). 90-degree rotation is in the “negative” direction i.e.—clockwise. In the boundary layer it is expressed: in Dean vortices, mushroom like front of the wave in the interface between two fluids of different densities (Rayleigh-Taylor instability) and cone front of the flowing fluid.
As the heart beats, pressure pulse and flow waves travel away from the heart. Wave energy at the collision with the resistance, is reflected or refracted from various locations in the arterial system. The observed pulsate pressure and flow are thus conventionally viewed as the sum of multiple forward and reflected pulse waves.
At the end of the systole in the proximal aorta pressure sharply decreases. At the end systole (170 - 185 msec), due to reflection, flow separates into opposite directed streams. Retrograde directed stream closes heart valves and at 300 - 327 msec once more, after re reflection changes direction to the anterograde. Opposite directed waves forming envelope propagating anterograde with the group wave velocity. Although net flow at the 200 - 350 msec slightly increased—there is a plateau in the net flow.
Direction of the wave rotation in the reflection depends on the boundary conditions (Figure 5). If the incident medium has a lower index of refraction then the reflected, wave has 180˚ phase shift upon reflection. If the incident medium has a larger index of refraction then the reflected, wave has no phase shift upon reflection. The structural differences in the blood and the vessel wall, forms pressure pulse rotation at the boundary layer and facilitates to flow.
In the systolic flow, blood particle on the aortic wall undergoes the wave reflection and changes phase 180˚ upon. At the wave reflection from the hard boundary, wave approaches the fixed end; the internal restoring forces which allow the wave to propagate exert an upward force on the end of the wave. According to Newton’s law, the wall must be exerting an equal opposite force and creates a wave pulse that propagates as a reflected wave with different polarity. Inside the vessel wall, pressure pulse wave on the border has no phase shift upon reflection (Figure 6(c)).
For the waves of equal amplitude, traveling in opposing directions, in average there is no net propagation of

Figure 5. Surface wave rotation during the reflection. (a) If the incident medium has a lower index of refraction then the reflected wave has 180˚ phase shift upon reflection. (b) If the incident medium has a larger index of refraction then the reflected; wave has no phase shift upon reflection. (c1) Formation of the standing wave: reflected wave adds to the incident wave. (c2) On the outer wall of the aortic isthmus, reflected wave is in phase with the pressure drop (180˚ phase delay from the initial systole) in the end systole, giving pressure sum with the amplitude twice as great near the surface.
energy. It forms the standing wave (Figure 5(c)). Under these conditions, the substance appears to vibrate. From the end systole to the initial diastole it is expressed by the plateau on the net flow graph. Standing waves are always associated with resonance and they can be identified by increase in amplitude of the resultant vibrations [25] . on the outer curvature of the isthmus, pressure drop in the end systole is in phase with the reflected systolic pulse and amplitude of the retrograde directed pulse pressure, have dramatic increases. Due to standing wave, tight closing the aortic valve, pulses reflected and come back to the outer curvature of the isthmus. Here at the secondary reflection it transmitted to the downstream. From systole to diastole between aortic valve and outer curvature of the aortic arch the standing wave is formed. At the isthmus cyclic loading on the wall, forms the hysteresis/phase lag of the wall substance and leading to the dissipation of the mechanical energy (Figure 6(a), Figure 6(b)).
Energy transmission at the wave reflection/refraction depends on the angle of incident. At the outer curvature of the aortic isthmus, blood circle motion falls to straight. At the end systole and initial diastole circumferential force forms the flow stagnation point. At the isthmus, flow stagnation (zero flow velocity) specifies to the whole magnetic resonance image slice, comes closely to the vessel wall. Angle of incident is low and energy transferred to the wall is increased [25] .
It is known that if the observation or process characteristic time is lower than that the material relaxation time (Deborah number De > 1), a solid-like response is observed, and if it is greater, (De < 1)—a liquid-like behavior is observed. At the heart cycle time (0.7 sec) and the aortic diameter 0.02 m, Deborah number is –0.175 [26] . Since red blood cell aggregation is dominant at the low shear rate, a corresponding low value of the Deborah number in the aorta indicates that the viscous force of the erythrocyte membrane may be small compared to the elastic. At the observed reflection time (10 - 20 msec), Deborah number is 8.7 - 17.7 and from the cell membrane (endothelial/erythrocytes) solid like behavior can be expressed.
In the end systole, at the external curvature of the isthmus, wave reflects and changes in phase 180˚ upon. Systolic reflected wave is in phase with the end systolic pressure drop and at the stagnation point they have positive superposition.
Just before the blood flow, level of the gradient pressure is higher and sharply decreases at the time of the formation developing stream. Pulse pressure in the viscoelastic material outstrips in phase the particle’s dis-
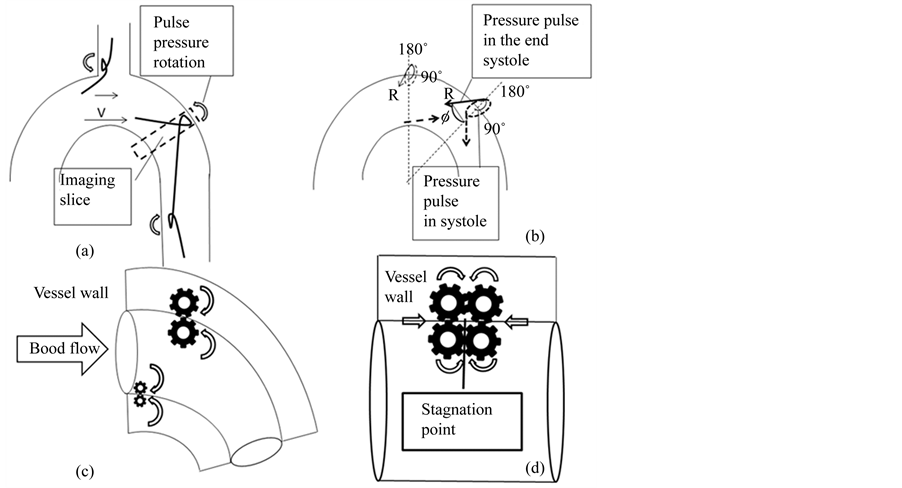
Figure 6. (a) Surface wave rotation at the wall of the aortic arch and arterial branching sites. (b) Direction of the circumferential pressure at the end systole due to retrograde pressure drop (R). (c) Pressure wave rotation in systole in the boundary layer and at the adjacent aortic wall. (d) Pressure wave rotation at the group wave stagnation point.
placement. In the initial flow, the red blood cell relaxation time is longer, than that the observed pressure reflection time. So the shear stress must be higher, than that calculated by the flow velocity in the developing stream (18.18 N/m2). From the harmonic wave equation, if the pressure-flow phases difference is 60˚ - 70˚, the shear stress amplitude just the initial flow must be 19.13 - 18.38 N/m2.
In the initial diastole tangential acceleration is 6.26 times higher, than that at the peak systole. As the pressure is directly proportional to the acceleration, peak shear stress must be increased to τP = 24.10 N/m2. (In the initial diastole, just after the zero velocity, the flow profile is flat. These zones have patterns similar to the entrance region flow: the boundary layer is thin and all the parts of the blood move with an identical shape).
If you take into account that the angle between the MRI slice position and pressure wave direction (Ø) is about 45˚ (Figure 6(b)) local shear stress at the vessel wall (τl = τP/sinØ) must be about 33.94 N/m2 and in constant influences in the wave group can be damage the wall. As the pulse pressure in the boundary layer is rotates, calculate pressure as the rotation moment of force (torque) is more important [27] .
At the end of the systole propagates not a sine wave, but a group of waves. In dispersive system, such as the blood, the wave phase velocity varies with frequency. Higher-frequency waves travel faster than the lower-frequency ones. Speed differences causes dispersion of the group wave packets: different particles in the substance in individual wavelets travel at different speeds and directions, that is dissipates blood cell aggregates, the mechanical energy of the viscous flow. Group wave at the frequency dispersion forms the structural rearrangement of the aggregates of the red, white blood cells, platelets, but on the vessel wall reflection it causes the wall damage: at the “stagnation” point on the outer curvature of the aortic isthmus, denudating the wall (Figure 6(d)).
It should be presented some ways that avoid inevitable denudation:
• At the atherosclerosis the progressive increase in the bilayer rigidity to cholesterol, parallels the metabolic pathway of sterol biogenesis [28] , may be related to the optimization of the vessel wall biophysical viscose/ elastic properties.
• Flow rate is directly proportional to the gradient pressure (Poiseuille equation). Diastolic pressure is 1.5 fold lower than that systolic, while net flow in diastole 2 ± 0.5 times higher than that at the peak systole. So, dynamic viscosity, in diastole must be decreased in 2.25 - 3.75 folds; i.e. at the blood flow, there are structural changes.
• Helical flow modifies stagnation point and that is suppressing severe polarization of LDLs at the entrances of the arterial branches on the aortic arch [29] and therefore protecting them from atherogenesis.
• In mammalians pulse rate and position of the heart, due to the breath, is constantly changes the site of the reflection (stagnation) point and that is avoids the vessel damage.
External additional oscillation, triggered by the ECG-R wave, can be modified pulse wave and remove the wave shearing interaction to the endothelium.
5. Conclusions
During the heart cycle, blood motion at the boundary layer, due to blood and vessel wall viscoelasticity, forms the surface wave and facilitates the blood structural rearrangement and flow.
At the end systole, at the outer curvature of the isthmus, pulse pressure at the reflection is in the resonance with the end systolic pressure drop. Amplitude of the wall stress increases.
Forming standing wave leads to the dissipation of the wall mechanical energy. Here, in the initial diastole, group wave, due to the wave reflection and frequency dispersion, facilitates the structural rearrangement/denudation of the vessel wall. By the removing resonance oscillation during the end systole/initial diastole between the heart and vessel wall, atherosclerosis can be avoided.
References
- McMillan, D.E. (1985) Blood Flow and the Localization of Atherosclerotic Plaques. Stroke, 16, 582-587. http://dx.doi.org/10.1161/01.STR.16.4.582
- Yamamoto, T., Ogasawara, Y., Kimura, A., Tanaka, H., Hiramatsu, O., Tsujioka, K., Lever, M.J., Parker, K.H., Jones, C.J.H., Caro, C.G. and Kajiya, F. (1996) Blood Velocity Profiles in the Human Renal Artery by Doppler Ultrasound and Their Relationship to Atherosclerosis. Arteriosclerosis, Thrombosis & Vascular Biology, 16, 172-177. http://dx.doi.org/10.1161/01.ATV.16.1.172
- Christopher, J.H., Caro, C.G. and Kajiya, F. (1996) Blood Velocity Profiles in the Human Renal Artery by Doppler Ultrasound and Their Relationship to Atherosclerosis. Arteriosclerosis, Thrombosis & Vascular Biology, 16, 172-177. http://dx.doi.org/10.1161/01.ATV.16.1.172
- Fred, B.G. (1973) Hemodynamic Theories of Atherogenesis. Circulation Research, 33, 259-266. http://dx.doi.org/10.1161/01.RES.33.3.259
- Chatzizisis, Y., Jonas, M., Coskun, A., Beigel, R., Stone, B., Maynard, C., Gerrity, R., Daley, W., Rogers, C., Edelman, E., Feldman, C. and Stone, P. (2008) Prediction of the Localization of High-Risk Coronary Atherosclerotic Plaques on the Basis of Low Endothelial Shear Stress. Circulation, 117, 993-1002.
- Cunningham, K. and Gotlieb, A. (2005) The Role of Shear Stress in the Pathogenesis of Atherosclerosis. Laboratory Investigation, 85, 9-23. http://dx.doi.org/10.1038/labinvest.3700215
- Akram, M.S. and André, J.D. (2000) Wall Shear Stress and Early Atherosclerosis. AJR American Journal of Roentgenology, 174, 1657-1665. http://dx.doi.org/10.2214/ajr.174.6.1741657
- Day, M.A. (2004) The No-Slip Condition of Fluid Dynamics. Springer, 285-296.
- Wilmer, N.W., Michael, F.O. and Charalambos, V.M.D. (2011) McDonald’s Blood Flow in Arteries: Theoretical, Experimental and Clinical Principles. 755.
- Howard, A.B. (1997) Thiixotropy. Journal of Non-Newtonian Fluid Mechanism, 70, 1-33. http://dx.doi.org/10.1016/S0377-0257(97)00004-9
- Oguz, K.B. and Herbert, J.M. (2003) Blood Rheology and Hemodynamics. Seminars in Thrombosis and Hemostasis/ Volume 29.
- Thurston, G.B. (1972) Viscoelasticity of Human Blood. Biophysical Journal, 12, 1205-1217. http://dx.doi.org/10.1016/S0006-3495(72)86156-3
- Everett, J., Max, A. and I-Dee, C. (1971) Effects of Viscosity and Constraints on the Dispersion and Dissipation of Waves in Large Blood Vessels. Biophysical Journal, 11, 1085-1120. http://dx.doi.org/10.1016/S0006-3495(71)86279-3
- Sarah, A.H., David, B.T., Ian, T.M. and James, D.C. (2005) Waveform Dispersion, Not Reflection, May Be the Major Determinant of Aortic Pressure Wave Morphology. American Journal of Physiology: Heart and Circulatory Physiology, 289, 2497-2502. http://dx.doi.org/10.1152/ajpheart.00411.2005
- Christopher, M.Q., David, S.B. and Abraham, N. (2001) Constructive and Destructive Addition of Forward and Reflected Arterial Pulse Waves. American Journal of Physiology. Heart and Circulatory Physiology, 280, H1519-H1527.
- Weber, T., Auer, J., O’Rourke, M.F., Kvas, E., Lassnig, E., Berent, R. and Eber, B. (2004) Arterial Stiffness, Wave Reflections, and the Risk of Coronary Artery Disease. Circulation, 109, 184-189.
- Khir, A.W., O’Brien, A., Gibbs, J.S.R. and Parker. K.H. (2001) Determination of Wave Speed and Wave Separation in the Arteries. Journal of Biomechanics, 34, 1145-1155. http://dx.doi.org/10.1016/S0021-9290(01)00076-8
- Ross, D. and Robertson, J.M. (1950) Shear Stress in a Turbulent Boundary Layer. Journal of Applied Physics, 21, 557. http://dx.doi.org/10.1063/1.1699706
- Schlichting, H., Gersten, K., Krause, E. and Oertel Jr., M.C. (2004) Boundary-Layer Theory. 8th Edition, Springer, Berlin.
- Soulis, J., Giannoglou, G., Dimitrakopoulou, M., Papaioannou, V., Logothetides, S. and Mikhailidis, D. (2009) Influence of Oscillating Flow on LDL Transport and Wall Shear Stress in the Normal Aortic Arch. The Open Cardiovascular Medicine Journal, 3, 128-142. http://dx.doi.org/10.2174/1874192400903010128
- Lantz, J. (2013) On Aortic Blood Flow Simulations: Scale-Resolved Image-Based CFD. Linköping Studies in Science and Technology Dissertation No. 1493, Department of Management and Engineering Linköping University SE-58183, Linköping.
- Markl, M., Brendecke, S., Simon, J., Frydrychowicz, A. and Harloff, A. (2010) Coregistration of Wall Shear Stress and Plaque Distribution within the Thoracic Aorta of Acute Stroke Patients. Proceedings of the International Society for Magnetic Resonance in Medicine, 18, 63.
- Korpas, D., Halek, J. and Dolezal, L. (2009) Parameters Describing the Pulse Wave. Physiological Research, 58, 473- 479.
- Vincent, J.F.V. (1990) Structural Biomaterials. Princeton University Press, Princeton, 244.
- Halliday, D., Resnick, R. and Walker, J. (2011) Fundamentals of Physics. John Wiley and Sons, New York, 1328.
- de Cindio, B., Gabriele, D., Catapano, G., Fata, P., Hackel, R. and Bonofiglio, R. (2007) The Blood Rheology in Renal Pathology. Annali Dell Istituto Superiore Di Sanita, 43, 156-163.
- Puig-de-Morales-Marinkovic, M., Turner, K.T., Butler, J.P., Fredberg, J.J. and Suresh, S. (2007) Viscoelasticity of the Human Red Blood Cell. American Journal of Physiology: Cell Physiology, 293, 597-605.
- Martinez, G.V., Dykstra, E.M., Lope-Piedrafita, S. and Brown, M.F. (2004) Lanosterol and Cholesterol-Induced Variations in Bilayer Elasticity Probed by 2H NMR Relaxation. Langmuir, 20, 1043-1046. http://dx.doi.org/10.1021/la036063n
NOTES

*Corresponding author.