Open Journal of Energy Efficiency
Vol.1 No.2(2012), Article ID:22525,12 pages DOI:10.4236/ojee.2012.12002
Evaluation of Energy-Efficiency Standards for Room Air Conditioners in the US
Environmental Energy Technologies Division, Lawrence Berkeley National Laboratory, Berkeley, CA, USA
Email: *spmeyers@lbl.gov
Received July 5, 2012; revised August 7, 2012; accepted September 6, 2012
Keywords: Energy Efficiency Standards; Room Air Conditioners; Consumer Benefit; Energy Savings; Life-Cycle Cost; Payback Period; Emissions Reductions
ABSTRACT
This article describes an analysis of the energy and economic impacts of possible energy efficiency standards for room air conditioners on both US consumers and the nation as a whole. We used two metrics to determine the effect of standards on a representative sample of US consumers: life-cycle cost change and payback period. For the national impact analysis, we evaluated national energy savings attributable to each potential standard, the monetary value of the energy savings to consumers of room air conditioners, the increased total installed costs because of standards, and the net present value of the difference between the value of energy savings and increased total installed costs. Our analysis indicates that standards for room air conditioners at efficiency level 3, which is 17% more efficient than today’s typical unit in the case of room air conditioners less than 6000 Btu/h with louvers and 12% more efficient in the case of room air conditioners 8000 - 13,999 Btu/h with louvers, would save close to one quad of energy over 30 years and have a net present value of consumer benefit of between −$0.14 billion and $1.82 billion, depending on the discount rate. In addition, such standards would reduce carbon dioxide emissions and NOx emissions.
1. Introduction
Every proposed new or amended US energy conservation standard must be designed to achieve significant additional conservation of energy and be technologically feasible and economically justified. In making its determination of whether a potential standard is economically justified the US Department of Energy (DOE) must assess whether the benefits of the proposed standard exceed its burdens to the greatest extent practical. DOE issued amended energy conservation standards for room air conditioners in 2011 [1]. As part of DOE’s evaluation, we analyzed the energy and economic impacts of possible energy efficiency standards for room air conditioners on both US consumers and the nation as a whole.
The effect of standards on individual consumers includes a change in operating expense (usually decreased) and a change in purchase price (usually increased). We use two metrics to determine the effect of standards on a representative sample of US consumers. Life-cycle cost (LCC) is the total consumer expense over the life of an appliance, including purchase expense and operating costs (including energy expenditures). We discount future operating costs to the time of purchase and sum them over the lifetime of the product. Payback period (PBP) measures the amount of time it takes consumers to recover the assumed higher purchase price of more energy-efficient products through lower operating costs.
For the national impact analysis (NIA), we evaluated 1) national energy savings (NES) attributable to each potential standard; 2) the monetary value of the energy savings to consumers of room air conditioners; 3) the increased total installed costs because of standards; and 4) the net present value (NPV) of the difference between the value of energy savings and increased total installed costs.
2. Technology Options Considered
For this study, we examined the most common improvements used in today’s market to increase the efficiency of residential room air conditioners. Table 1 and Table 2 lists the efficiency improvements associated with six efficiency levels for each of the two product classes discussed in this paper: room air conditioners less than 6000 Btu/h with louvers, and room air conditioners 8000 - 13,999 Btu/h with louvers. We chose to focus in this paper on these two product classes because they account for the majority of room air conditioner sales. The analysis performed for DOE’s rulemaking also evaluated other product classes.

Table 1. Room air conditioner with louvered sides, <6000 Btu/h; Efficiency levels considered.
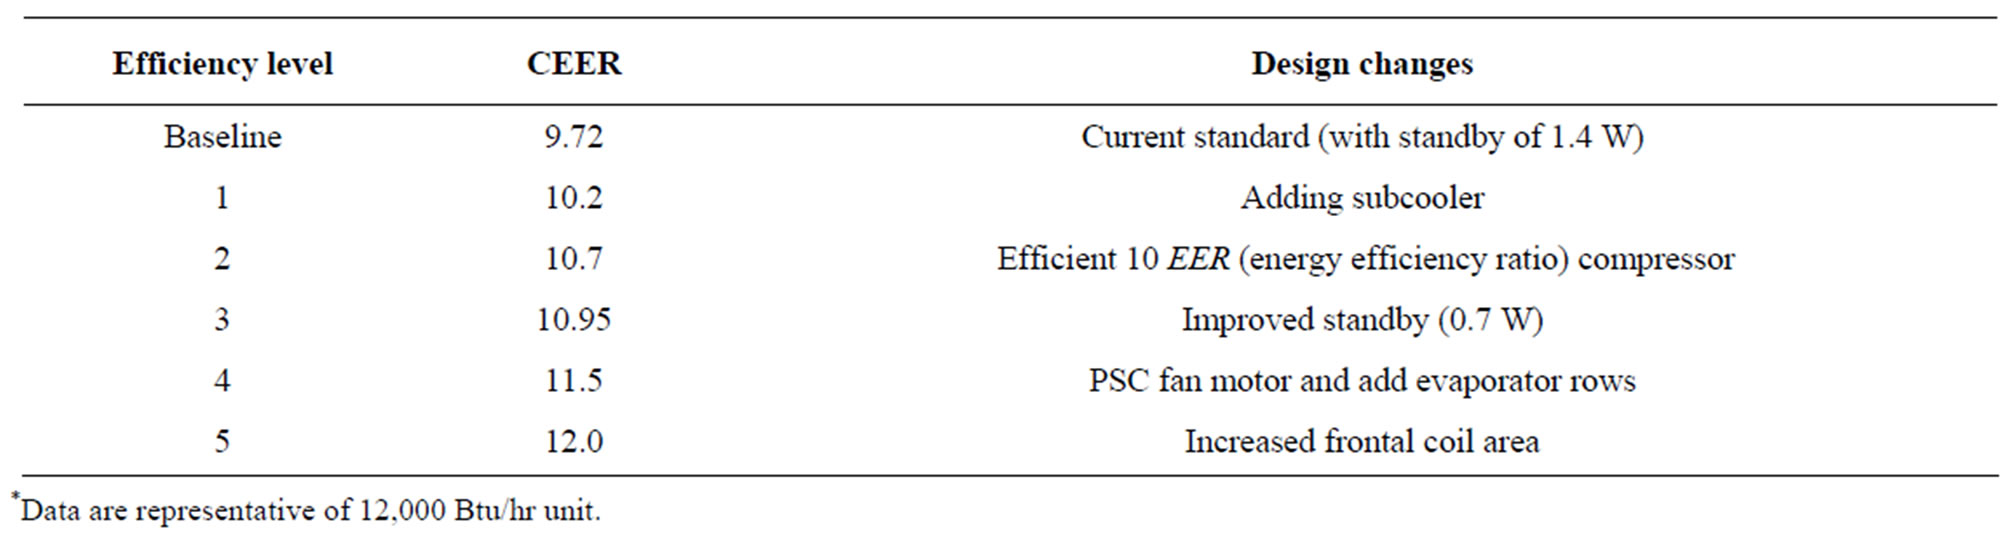
Table 2. Room air conditioner with louvered sides, 8000 - 13,999 Btu/h;*Efficiency levels considered.
The baseline efficiency level reflects the existing Federal standard and assumes the standby power is 1.4 watts. Room air conditioner efficiency is expressed as combined energy efficiency ratio (CEER), which is cooling capacity in Btu/h per watt (W) of input power. CEER is an integrated metric that includes standby and off mode together with the active mode.
Efficiency level 1 in Table 1 and efficiency level 3 in Table 2 represent technology improvements that reduce standby power to 0.7 W. The remaining efficiency levels are accomplished by using common improvements found in today’s market, such as increasing the heat exchanger surface area (e.g. increasing evaporator width, frontal coil area, and adding additional tube rows to the condenser or evaporator, adding subcooler to the condenser coil) or using a more efficient compressor or higher efficiency fan motor.
3. Life-Cycle Cost and Payback Period Analysis
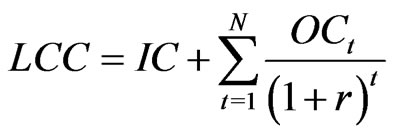
For each efficiency level, we calculated a consumer LCC and PBP. We define LCC using Equation (1):
 (1)
(1)
where:
LCC = life-cycle cost in dollars;
IC = total installed cost in dollars;
∑ = sum over the lifetime, from year 1 to year N;
N = lifetime of appliance in years;
OC = operating cost in dollars;
r = discount rate;
t = year for which operating cost is being determined.
Numerically, the PBP is the ratio of the increase in purchase expense (i.e. from a less energy-efficient design to a more energy-efficient design) to the decrease in annual operating expenditures and is expressed in years. This type of calculation does not take into account changes in operating expense over time or the time value of money. Payback periods greater than the life of the product indicate that the increased total installed cost is not recovered with the reduced operating expenses.
The inputs to the total installed cost are the product cost and the installation cost. The inputs to the operating costs are the annual energy cost, the annual repair cost, and the annual maintenance cost. The PBP uses the same inputs as the LCC analysis, except that energy price trends and discount rates are not required.
Several inputs to the determination of consumer LCC and PBP are either variable or uncertain. Recognizing this, we developed LCC and PBP spreadsheet models incorporating both Monte Carlo simulation and probability distributions by using a Microsoft Excel spreadsheet combined with Crystal Ball (a commercially available add-on program). The spreadsheet is accessible on DOE’s appliance standards website [2].
We used the DOE Energy Information Administration (EIA)’s 2005 Residential Energy Consumption Survey (RECS) to develop household samples for room air conditioners [3]. The 2005 RECS, which consists of 4382 housing units, was constructed by the EIA to be a national representation of the household population in the United States. We were able to assign a unique annual energy use and/or energy price to each household in the sample. The variability across households in annual energy use and/or energy pricing contributes to the range of LCCs and PBPs calculated for any particular energy efficiency level.
We also analyzed use of room air conditioners in the commercial sector. As described below, an estimated 12 percent of the total stock of room air conditioners is in the commercial sector.
3.1. Inputs to Calculations
Because we gathered most of our data for the LCC and PBP analyses in 2009, we express dollar values in 2009$. The compliance date when amended energy efficiency standards for room air conditioners become operative will be June 2014. We calculated the LCC and PBP for all consumers as if they each would purchase a new product in 2014.
3.2. Inputs to Total Installed Cost
3.2.1. Manufacturer Cost
Baseline manufacturer cost refers to the costs incurred by the manufacturer to produce products meeting existing minimum efficiency standards. We used the baseline manufacturer costs for room air conditioners developed by DOE in the 2011 rulemaking for room air conditioners (see chapter 5 of the technical support document (TSD) for the final rule) [4]. DOE used a combination of cost data submitted by the Association of Home Appliance Manufacturers (AHAM) and a reverse engineering analysis to develop manufacturer cost increases associated with increases in room air conditioner efficiency levels. Table 3 presents the manufacturer cost increase for each considered efficiency level for the two product classes.
3.2.2. Markups
DOE developed an average manufacturer markup by examining the annual Securities and Exchange Commission (SEC) 10-K reports filed by four publicly traded manufacturers primarily engaged in appliance manufacturing and whose combined product range includes room air conditioners. For retailers, we developed separate markups for baseline products (baseline markups) and for the incremental cost of more-efficient products (incremental markups). Incremental markups are coefficients that relate the change in the manufacturer sales price of higher-efficiency models to the change in the retailer sales price. The overall markup is the value determined by multiplying the manufacturer and retailer markups and the sales tax together to arrive at a single markup value. The overall baseline markup is 1.96, while the overall incremental markup is 1.58.
3.2.3. Installation Cost
The cost of installation covers all labor and material costs associated with the replacement or installation of a product. We derived installation costs from the 2010 RS Means Residential Cost Data, which provides estimates on the labor required to install residential room air conditioners. We assumed a trip charge equal to half an hour for each crew member. The installation cost ranges from $73 to $213, depending on the unit size.
Higher efficiency equipment that has significantly larger dimensions or weight may require additional labor hours during installation. We generated estimates of such additional labor hours on the labor hours for higher capacity room air conditioners having similar dimensions or weight. We used regional labor costs to more accurately estimate the regional variation in installation costs.
3.2.4. Future Product Prices
DOE’s engineering analysis estimated manufacturer costs in 2010. Economic literature and historical data suggest that the real costs of certain appliances and equipment may trend downward over time according to learning or experience curves. An extensive literature discusses the learning or experience curve phenomenon, typically based on observations in the manufacturing sector [5]. To explain the empirical relationship, the theory of technology learning is used to substantiate a decline in the cost of producing a given product as firms accu
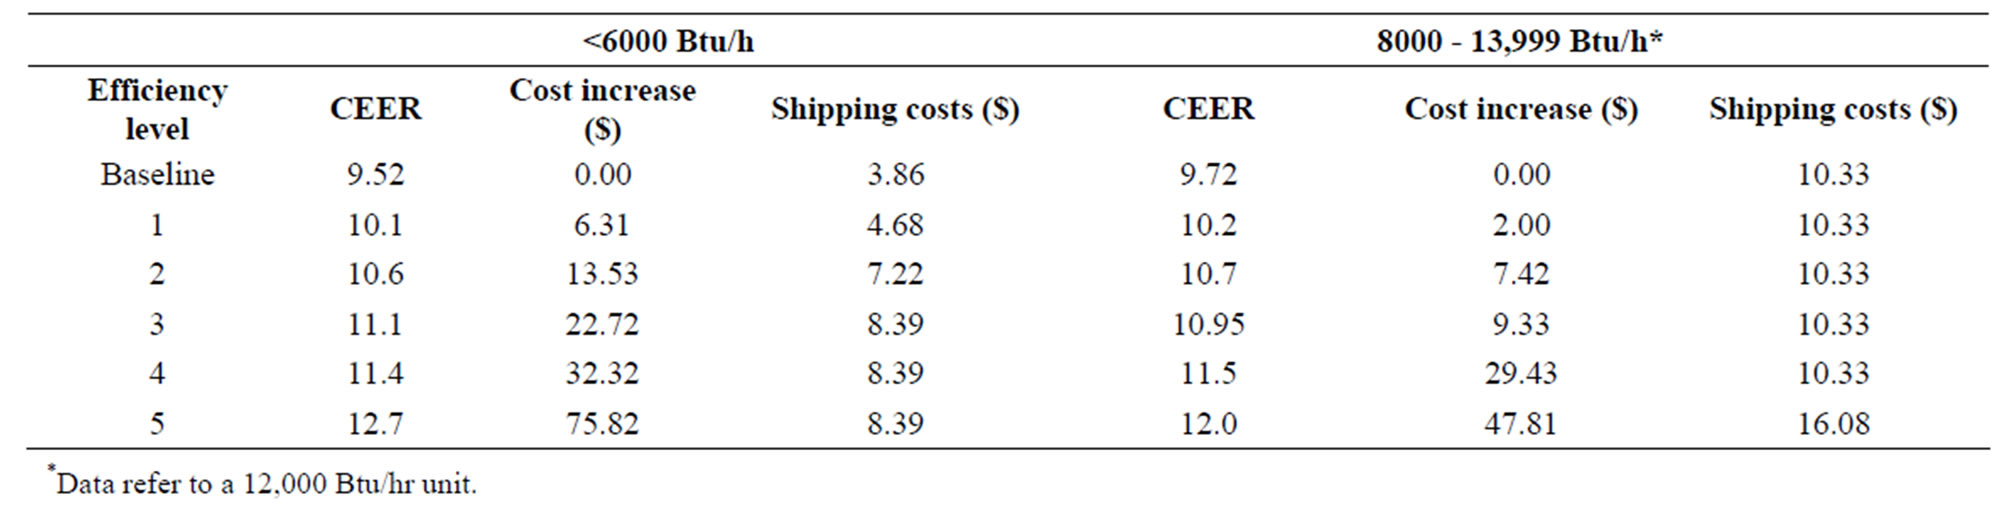
Table 3. Room air conditioner with louvered sides, manufacturer cost-efficiency relationship.
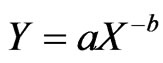
mulate experience with the technology. A common functional relationship used to model the evolution of production costs is shown in Equation (2):
 (2)
(2)
where:
a = an initial price (or cost);
b = a positive constant known as the learning rate parameter;
X = cumulative production;
Y = the price as a function of cumulative production.
Thus, as experience (production) accumulates, the cost of producing the next unit decreases. The percentage reduction in cost that occurs with each doubling of cumulative production is known as the experience rate (ER) and is given by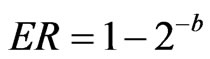 . In typical experience curve formulations, the experience rate parameter is derived using two historical data series: price (or cost) and cumulative production, which is a function of shipments throughout a long period.
To derive an experience rate parameter for room air conditioners, we obtained historical Producer Price Index (PPI) data for room air conditioners from the Bureau of Labor Statistics (BLS) from 1990-2009. Inflation-adjusted price indices for room air conditioners were calculated by dividing the PPI series by the Consumer Price Index (CPI) “all items” index for the same years. We assembled a time-series of annual shipments for 1946- 2009 for room air conditioners from data submittals from AHAM, AHAM Fact Books, and Appliance magazine.
To estimate an experience rate parameter, a leastsquares power-law fit was performed on the unified price index versus cumulative shipments. For room air conditioners, the estimated experience rate (defined as the fractional reduction in price expected from each doubling of cumulative production) is 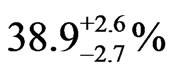 (95% confidence). We then derived a price factor index, with 2010 equal to 1, to forecast prices in each future year in the analysis period. The index value in a given year is a function of the experience and the cumulative production forecast through that year. We applied the same value to forecast prices for each room air conditioner product class at each considered efficiency level.
3.2.5. Total Installed Cost
Table 4 presents the total installed costs in 2014 by efficiency level for the two considered room air conditioner product classes.
3.3. Inputs to Operating Cost
3.3.1. Annual Energy Consumption
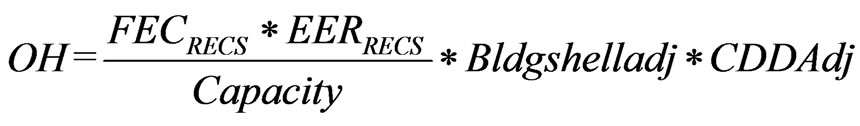
We calculated the annual energy consumption of a room air conditioner using Equation (3):
 (3)
(3)
where:
 = room air conditioner annual energy consumption (kWh/year),
 = rated capacity in Btu/h;
 = operating hours per year,
 = combined energy efficiency ratio in Btu/ h/W.
We began with the data reported by RECS 2005 on the annual energy consumption (field energy consumption) for room air conditioning, referred to as . EIA used a regression technique to estimate how much of the total annual electricity consumption for each household can be attributed to each end-use category. The reported field energy consumption refers to the consumption of all of the room air conditioners in a home.
RECS 2005 also reports the number of room air conditioners in the home. Of all homes that use a room air conditioner, 35 percent have two room air conditioners, and 14 percent have three or more room air conditioners. To estimate the energy consumption of a single room air conditioner, referred to as , we divided FEC- (all)RECS by the reported number of room air conditioners. For houses with both central air conditioning and room air conditioning, we scaled
  using a relative use factor. Although in reality the utilization of each of the room air conditioners in a home may vary, we had no way to estimate such variation.
For commercial-sector room air conditioners, we estimated the energy consumption using variables specific to each building in the sample and data on cooling degree-days.
In conducting the analysis of energy use by products that would meet some future standard, we effectively substituted the room air conditioners in the sample residential and commercial buildings with a new product of identical product class (capacity) but with different energy efficiency. In order for the estimate of new room air
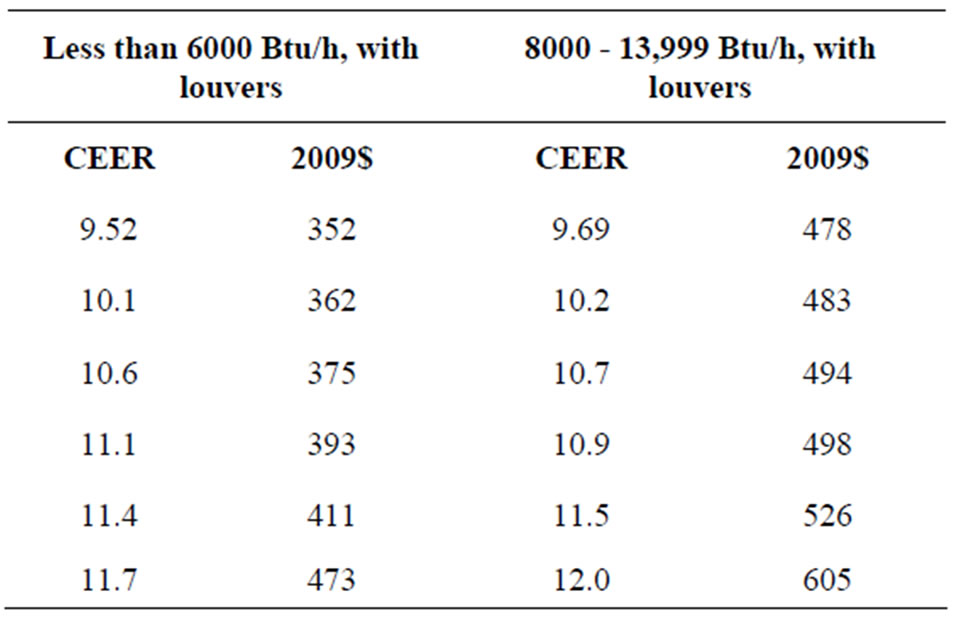
Table 4. Room air conditioners: Total installed costs in 2014, residential applications.
conditioner energy consumption to reflect field conditions, we needed to estimate the number of room air conditioner operating hours for each household or commercial building in the samples.
We calculated the annual room air conditioner active mode operating hours for each residential sample unit using Equation (4):
 (4)
(4)
where:
OH = operating hours per year,
 = field energy consumption for a room air conditioner,
 = the estimated EER of the room air conditioner in the sample home,
 = the room air conditioner capacity in Btu/h,
 = adjustment to building shell efficiency in 2014, percent,
 = cooling degree days (CDD) adjustment in Btu/h.
The capacity is given by the product class. To ensure that the estimated operating hours are representative of future conditions, we used the building shell index factor from Annual Energy Outlook (AEO) 2010 in 2014 for space cooling in all homes of 0.96 and historical average CDD by census division [6]. The building shell index factor decreased energy use by 4 percent, while the CDD adjustment factor decreased energy use by 10 percent on average.
We estimated the EER of the room air conditioner in each sample household by matching the age of the room air conditioner given by RECS with the average EER for the specific product class in the year of its vintage. Once the vintage year was determined, we assigned an EER to the unit equal to the average EER for the appropriate capacity for that year.
The estimated mean number of operating hours for the residential room air conditioner sample is 756 hours for the <6000 Btu/h product class, and 611 hours for the 8000 to 13,999 Btu/h product class. For comparison, the DOE test procedure uses 750 hours per year for all room air conditioners.
Table 5 provides the average annual energy consumption by efficiency level for the main room air conditioner product classes in residential applications. The energy use in commercial applications is considerably higher.
3.3.2. Energy Prices
We developed estimates of marginal electricity prices to calculate electricity cost savings for higher efficiency room air conditioners. The marginal price for a given consumer is the cost of the next increment of electricity
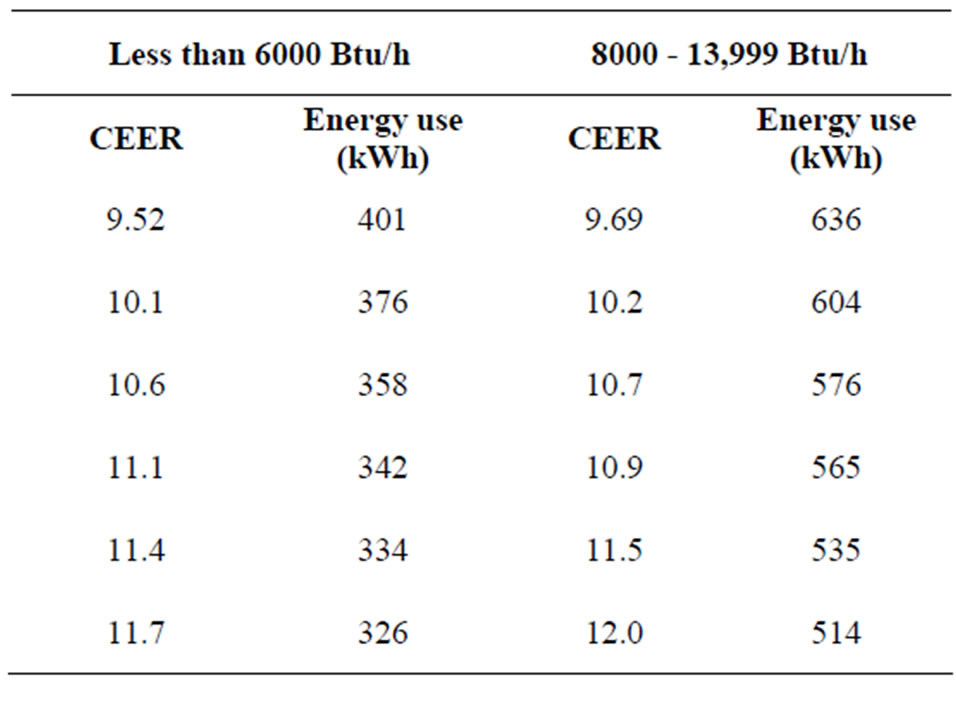
Table 5. Room air conditioners with louvers: residential sector average annual energy use by efficiency level.
use on their utility bill and is an appropriate estimate of the value of savings that a consumer would see. For a peak-coincident end-use such as air conditioning, there is a general expectation that the actual cost of operating the appliance is higher than the average price of electricity. Accurate estimation of marginal prices requires taking rate structures into account explicitly. After reviewing the strengths and weaknesses of different approaches and the available data, we chose to base the analysis on the utility tariffs comprising the Tariff Analysis Project (TAP) database [7]. This approach provides an up-todate and geographically diverse data set that can capture real prices accurately.
Both an average annual price and a seasonal marginal price are required for each household or building in the sample. The basic methodology is to estimate the customer’s monthly electricity use and use the tariff data to calculate the corresponding electricity bill. Empirical marginal prices are calculated by taking the difference between the bill for the baseline electricity use and the bill for use at a higher efficiency level and dividing that difference by the change in energy use. This approach requires estimating monthly consumer electricity use for the baseline model and the energy savings associated with each energy efficiency level. Both the rate structures and the required energy data differ significantly for residential and commercial consumers.
For residential electricity prices, the calculation method provides, for each household in the LCC sample, an average annual price and a monthly marginal price. To compute those prices, the monthly baseline energy consumption was estimated using the monthly billing data from the RECS 2001 dataset (the latest available at the time of the analysis). Given the monthly energy use, twelve monthly bills per household are calculated using the tariffs. To increase the effective size of the sampleeach household is paired with an appropriate utility in its region.
The annual average baseline price is calculated as a simple average over the twelve monthly baseline bills. To calculate monthly marginal prices for each account, the monthly energy use is decremented by seven percent and the bill recalculated. The marginal price in each month is defined as the bill savings divided by the energy savings. Monthly variability in the marginal price is due primarily to seasonal rates. The annual cost savings are equal to the monthly marginal price times the monthly energy savings, summed across months.
To calculate commercial electricity bills requires both the monthly consumption and demand. For utilities that apply mandatory time-of-use (TOU) tariffs, consumption and demand data are required for each TOU period. These monthly data are not available for the Commercial Buildings Energy Consumption Survey (CBECS) 2003 records used in the LCC sample, so bills cannot be calculated directly. CBECS does provide annual electricity consumption and expenditures for each record, which were used to estimate the average annual price. For marginal prices, estimates were based on regional coefficients developed in a previous analysis of commercial buildings [8].
To arrive at prices in future years, we multiplied the average prices described in the preceding section by the forecast of annual average price changes in EIA’s AEO 2010. To estimate the trend after 2035, we used the average rate of change during 2020-2035 for electricity. For the results presented here, we used the energy price forecasts from the AEO 2010 Reference case.
3.3.3. Repair and Maintenance Costs
Typically, small incremental changes in product efficiency incur no, or only very small, changes in repair and maintenance costs over baseline products. We found no data about frequencies of repair for room air conditioners. We assumed that repair frequencies are fairly low, increasing for the higher-capacity units due to more expensive equipment costs. We assumed that 1 percent of small all units (less than 6000 Btu/hr), and 2.5 percent of medium sized units (8000 to 14,000 Btu/hr) are maintained or repaired each year. We assumed that an average service call for repair or maintenance takes about 1 hour for small and medium-sized units and 2 hours for large units, and that the average material cost is equal to one-half the incremental equipment cost. We annualized those values by multiplying by the frequencies and dividing by the average product lifetime of 10.5 years.
3.3.4. Product Lifetime
Because the basis for the lifetime estimates in the literature was uncertain, we developed a method using household survey data to estimate the distribution of product lifetimes in the field.
The RECS records the presence of various appliances in each household, placing the age of each appliance into a bin comprising several years. For several appliances, including room air conditioners, the survey asks respondents to identify each appliance’s age as less than 2 years old, 2 to 4 years old, 5 to 9 years old, 10 to 19 years old, or more than 20 years old. For this analysis, we used the surveys conducted in 1990, 1993, 1997, 2001, and 2005.
Data from the U.S. Census’s American Housing Survey (AHS), which surveys all housing including vacant and second homes, enabled us to adjust the RECS data to reflect the presence of appliances outside of primary residences [9]. By combining the results of both surveys with the history of shipments of room air conditioners, we estimated the percentage of room air conditioners of a given age still in operation. This survival function, which we assumed has the form of a cumulative Weibull distribution, provides an average and a median appliance lifetime. (The Weibull distribution is a probability distribution commonly used to measure failure rates. Its form is similar to an exponential distribution, except that a Weibull distribution allows for a failure rate that changes over time in a particular fashion.)
The analysis yielded an average lifetime of 10.5 years, with minimum and maximum values of 3 years and 20 years, respectively.
3.3.5. Discount Rates
The discount rate is the rate at which we discounted future consumer expenditures to establish their present value. We derived the discount rates for the LCC analysis from estimates of the financial cost of any debt incurred to purchase products or the opportunity cost of any equity used to purchase products.
The shares of different financing methods in total appliance purchases are unknown. Our approach involves identifying all possible debt or asset classes that might be used to purchase room air conditioners, including household assets that might be indirectly affected. (An indirect effect would arise if a household sold some assets in order to pay off a loan or credit card debt that might have been used to finance the actual appliance purchase.) We estimated the average shares of the various debt and equity classes in the average US household equity and debt portfolios using data from the Federal Reserve Board’s Survey of Consumer Finances (SCF) for 1989, 1992, 1995, 1998, 2001, 2004, and 2007 [10]. We used the mean share of each class across the seven surveys as a basis for estimating the weight of the classes in the financing of room air conditioners.
The data source for the interest rates for loans, credit cards, and lines of credit is the Federal Reserve Board’s SCF. The SCF does not provide similar rate data for the asset classes, so we derived data for these classes from national-level historical data. Because the interest and return rates cover a range of time, we believe they are representative of rates in the year in which amended standards would take effect.
We developed a normal probability distribution of rates by using the mean value and standard deviation from the distributions. To account for variation among households, we sampled a rate for each household from the distributions for the appropriate debt or asset class. The average rate across all types of household debt and equity, weighted by the shares of each class, is 4.8 percent.
We derived the discount rate for commercial-sector purchasers of room air conditioners from the cost of capital of publicly traded firms in the sectors that purchase those products (lodging and “other” commercial sectors). These firms typically finance equipment purchases through debt, equity capital, or some combination of the two. We estimated the cost of the firms’ capital as the weighted average of the cost of equity financing and the cost of debt financing for each year between 2001 and 2008 [11,12]. We estimated the cost of equity using the capital asset pricing model (CAPM), which assumes that the cost of equity for a given company is proportional to the systematic risk faced by that company. The cost of debt, the interest rate paid on money a company borrows, was estimated by adding a risk adjustment factor to the risk-free rate.
Weighting the real weighted-average cost of capital for the two commercial sectors that purchase room air conditioners by their estimated shares of room air conditioner purchases, we calculated an average discount rate for companies that purchase room air conditioners of 6.20 percent. To account for variations in discount rates within each sector, we applied a normal probability distribution to the average values and standard deviations.
3.3.6. Product Energy Efficiency in the Base Case
To estimate the percentage of consumers who would be affected by a standard at any of the potential efficiency levels, we considered the projected distribution of efficiencies for products that consumers purchase under the base case (the case without amended energy efficiency standards). Using the projected distribution of efficiencies for each product class, we randomly assigned a room air conditioner efficiency to each sample household and commercial user.
To develop a base-case energy efficiency distribution for room air conditioners, we began with data that AHAM provided showing the distribution of room air conditioner efficiencies sold by product class in 2005-2007. To account for changes in energy efficiency after 2007, we used historical trends from 2005 to 2009, which give a 0.25 percent annual growth in the share of ENERGY STAR efficiency levels. Therefore, we assumed that the market shares of the efficiency levels in 2014 will be higher than in 2007. The market shares in Table 6 represent the products that consumers would be expected to purchase in 2014 in the absence of new standards.
3.4. Results of Life-Cycle Cost Analysis
For each set of sample consumers in each product class, we calculated LCC savings and PBPs for each energy efficiency level relative to the base-case products assigned to the consumers. Because for some consumers we assigned a base-case product that is more efficient than some of the considered efficiency levels, the average LCC impacts are not equal to the difference between the LCC of a specific efficiency level and the LCC of the baseline product. Each LCC and PBP calculation also sampled from the probability distributions developed to characterize many of the inputs to the analysis.
Based on the Monte Carlo simulations that we performed, for each efficiency level, we calculated the shares of consumers that would experience a net LCC benefit, a net LCC cost, or no impact. We considered a consumer to receive no impact at a given efficiency level if the base-case product assigned had the same as or a higher efficiency than the efficiency level. We determined the median PBPs by excluding the percentage of users not impacted by a given standard level.
The results presented below combine the results for residential and commercial users, which means that we had to assign an appropriate weight to the results for each type of user. We based the shares of shipments in the effective year of each of these purchaser types on the estimated residential and commercial shares of the total national stock of room air conditioners in 2007. Analysis using data from the 2007 AHS and the 2003 CBECS yielded shares of the total room air conditioner stock of 88.4 percent for residential units and 11.6 percent for commercial units.
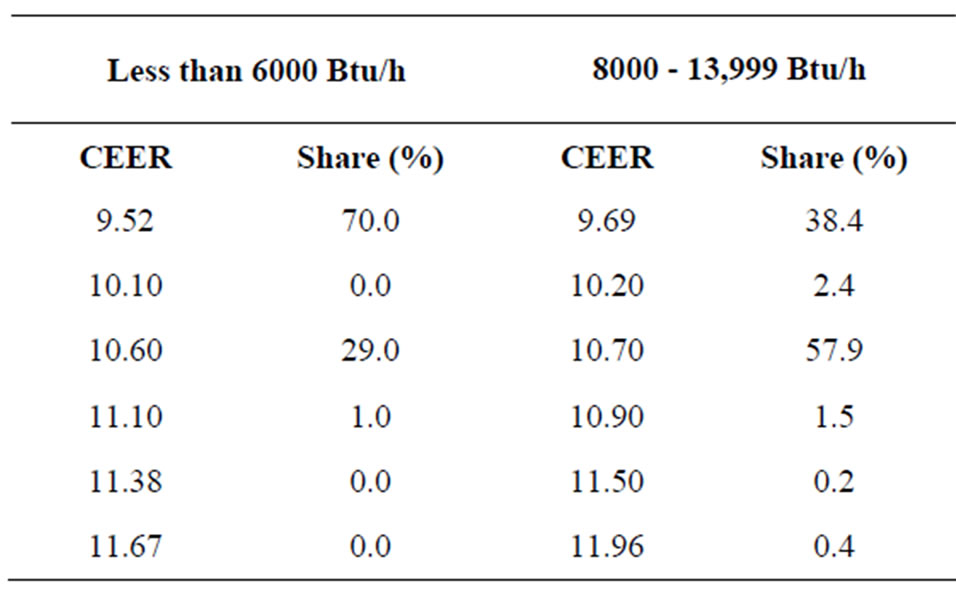
Table 6. Room air conditioners with louvers: base-case market shares in 2014.
Tables 7 and 8 summarize the LCC and PBP results by efficiency level for the two largest room air conditioner product classes. Similar results for the other product classes may be found in the Technical Support Document for the 2011 room air conditioner rulemaking.
For room air conditioners less than 6000 Btu/h, with louvers, the maximum average LCC savings occur at CEER 10.6. At this level, 37 percent of consumers have a net benefit, and the median PBP is 5.8 years. CEER 11.1 is the highest efficiency level with positive average LCC savings, but nearly two-thirds of consumers have a net cost (i.e. LCC increase).
For room air conditioners 8000 - 13,999 Btu/h, with louvers, the maximum average LCC savings occur at CEER 10.9 and CEER 11.5. At CEER 10.9, 64 percent of consumers have a net benefit, and the median PBP is 2.8 years. At CEER 11.5, only 43 percent of consumers have a net benefit, and the median PBP is 7.1 years.
Figure 1 shows the range of LCC savings for the energy efficiency levels considered for room air conditioners with 8000 - 13,999 Btu/h, with louvers, for residential users. For each efficiency level, the top and the bottom of the box indicate the 75th and 25th percentiles, respectively. The bar at the middle of the box indicates the median; 50 percent of the households experience life-cycle cost savings above this value. The small box shows the average LCC savings. The “whiskers” at the bottom and the top of the box indicate the 5th and 95th percentiles. Negative savings mean that the LCC increases relative to the base case.
4. National Impact Analysis
The national impact analysis (NIA) of potential standard levels for room air conditioners evaluated the following impacts: 1) national energy savings (NES) attributable to each possible standard; 2) monetary value of the energy savings to consumers of room air conditioners; 3) increased total installed costs of the products because of standards; and 4) the net present value (NPV), which is the difference between the value of energy savings and increased total installed costs. We performed all calculations for each product class using a Microsoft Excel spreadsheet model, which is accessible at www.eere.energy.gov/buildings/appliance_standards.
We analyzed in detail four representative product classes of room air conditioners:
l Less than 6000 Btu/h, Without Reverse Cycle and With Louvers l 8000 - 13,999 Btu/h, Without Reverse Cycle and With Louvers l 20,000 - 24,999 Btu/h, Without Reverse Cycle and
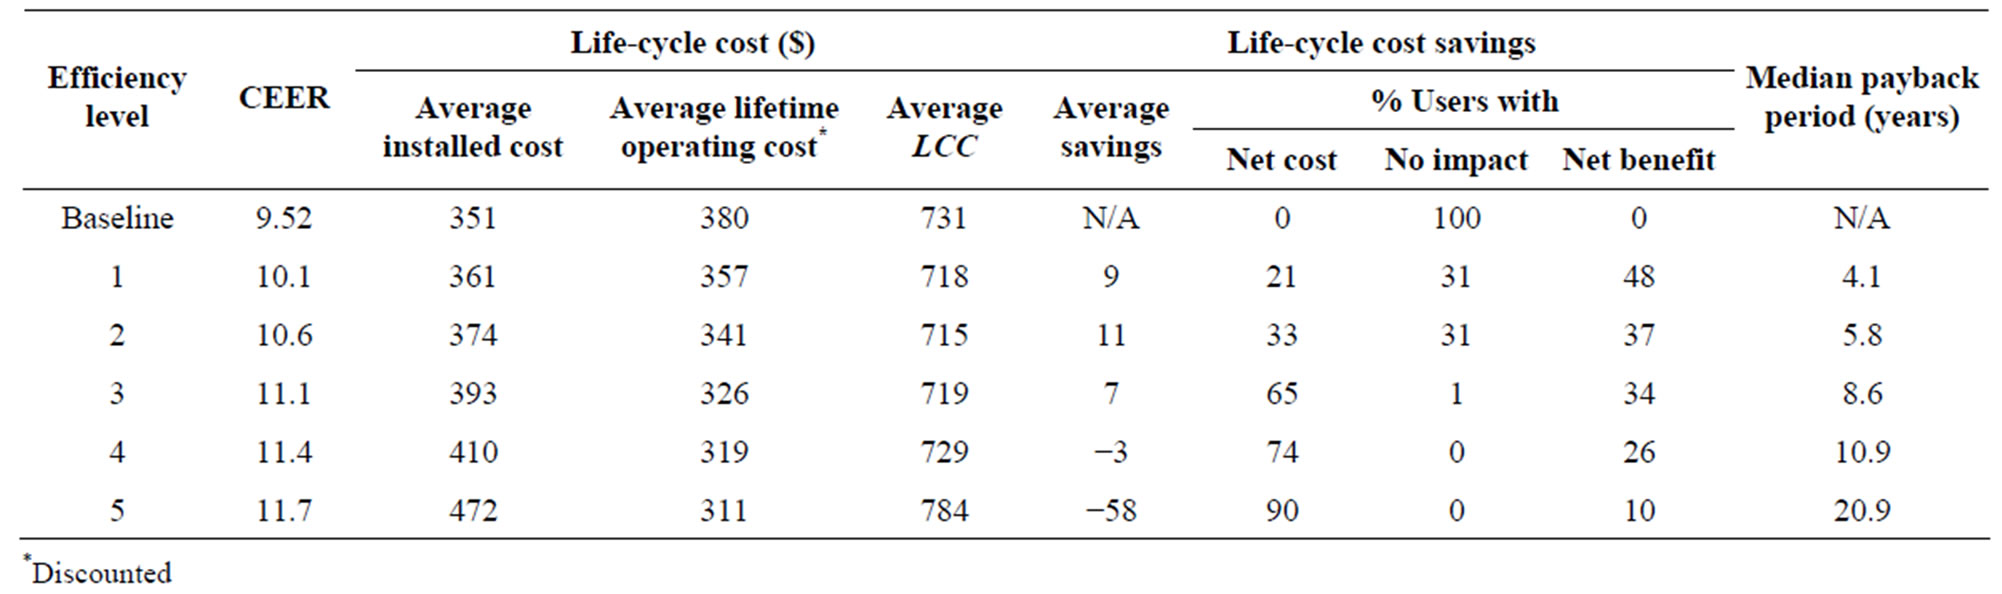
Table 7. LCC and PBP results: room air conditioners less than 6000 Btu/h, with louvers.
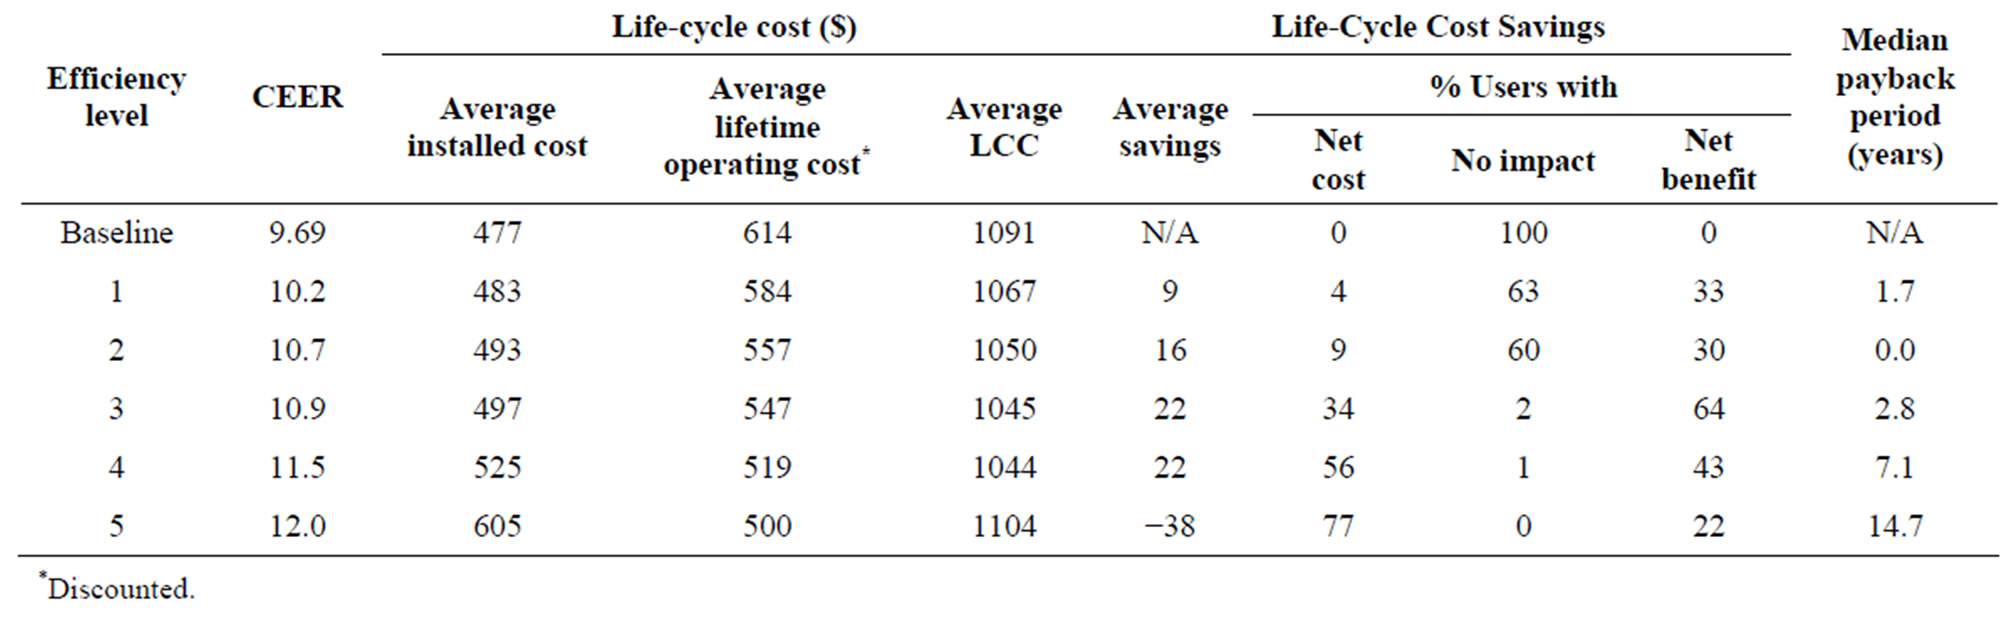
Table 8. LCC and PBP results: room air conditioners 8000 - 13,999 Btu/h, with louvers.
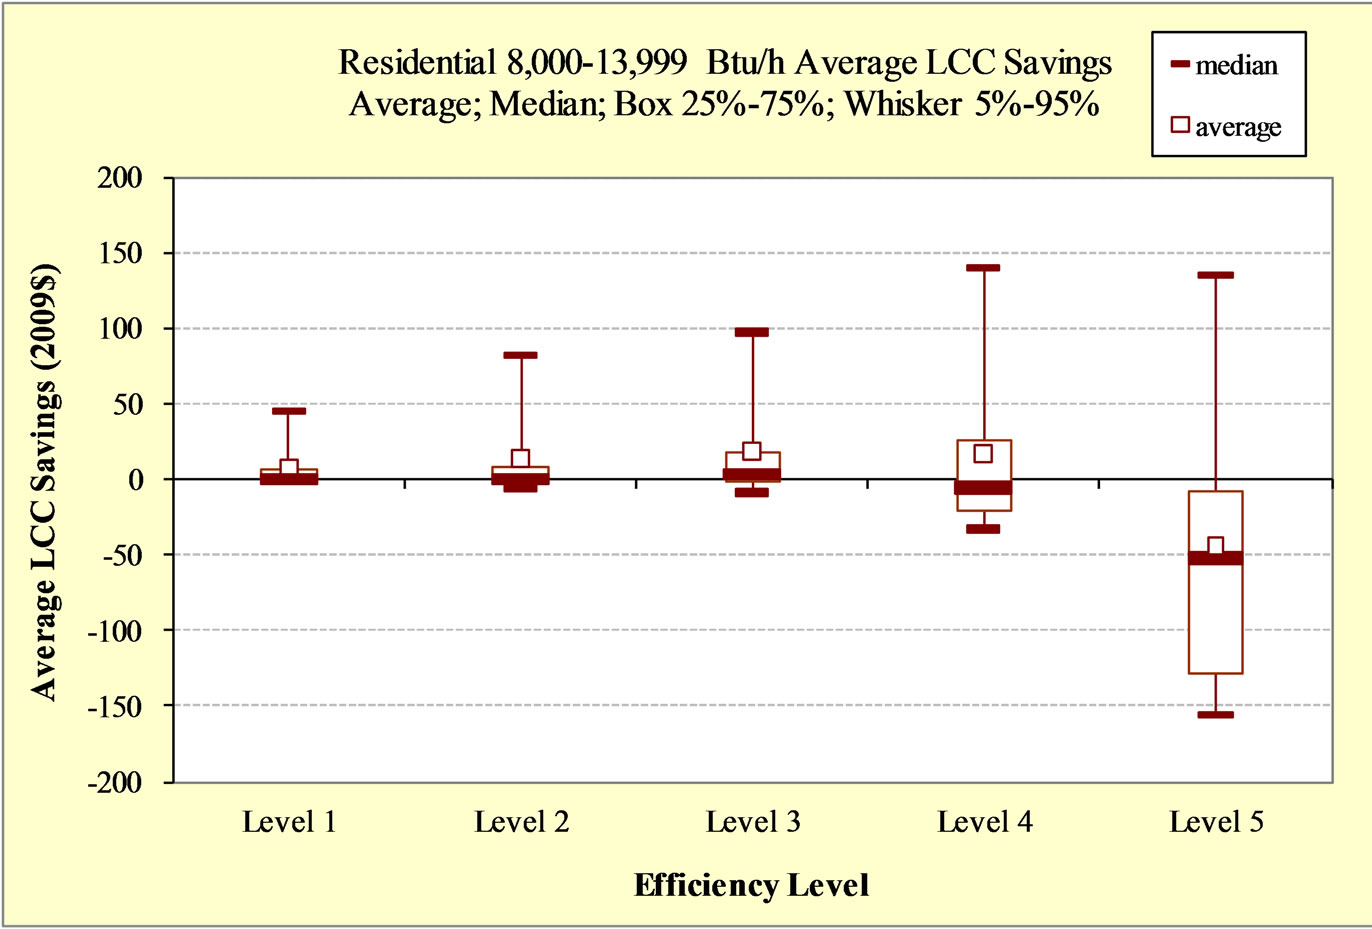
Figure 1. Room air conditioners, residential, 8000 - 13,999 Btu/h, with louvers, range of LCC savings.
With Louvers l >25,000 Btu/h, Without Reverse Cycle and With Louvers For the NIA, we assigned each of the sixteen product classes included in DOE’s rulemaking to one of six product class groups, each of which is based on the analyses for the representative product class in the group. To estimate the national impacts of standards for all the product classes considered in the rulemaking, we allocated the product cost and annual energy consumption of each representative product class to all product classes within that group.
4.1. Shipments
We used three sources to establish historical shipments of room air conditioners: 1) data provided by the Association of Home Appliance Manufacturers (AHAM) for 1995-2009, 2) data from the 2000 AHAM Factbook for 1989-1994, and 3) data from Appliance magazine for 1972-1988.
The shipments model considers specific market segments to estimate shipments. The market for room air conditioners primarily consists of replacement units for equipment that has been retired. We also included a segment consisting of existing households without room air conditioners and households who already own units who will purchase new room air conditioners.
We determined shipments to the replacement market using an accounting method that tracks the total stock of units by vintage. Over time, some units will be retired and removed from stock, thereby triggering the shipment of a replacement unit. Depending on the vintage, a certain percentage of each type of unit will fail and need to be replaced. To determine when a unit fails, we used a survival function based on a product lifetime distribution with an average value of 10.5 years, and minimum and maximum values of 3 years and 20 years, respectively. To calibrate the modeled shipments with the historical data, we estimated a market segment for new purchases of room air conditioners by households that already own a room air conditioner, as well as households without room air conditioners. We estimated that 12 percent of total room air conditioner shipments go to the commercial sector.
To estimate the impacts of potential standard levels on product shipments, we used an elasticity parameter to account for the combined effects of changes in purchase price, annual operating cost, and household income on the consumer purchase decision. For all standard levels, shipments are forecasted to decrease slightly compared to the base case—the effects from the increase in product purchase prices offset the effects from decreased operating costs, resulting in a net decrease in shipments.
4.2. Forecasted Energy Efficiencies
The forecasted energy efficiency represents the annual shipments-weighted energy efficiency during the forecast period (that is, from the assumed effective date of an amended standard to 30 years after that date).
To forecast the base-case energy efficiency for each product class, we used as a starting point the shipments-weighted energy efficiency for 2014. To represent the distribution of product energy efficiencies in 2014, we used the same market shares as in the base case for the LCC analysis. Based on recent trends, we applied an annual growth rate of 0.25% between 2014 and 2044.
To forecast standards-case energy efficiencies, we used a “roll-up” scenario to establish the shipmentsweighted average energy efficiency for the year that energy conservation standards would become effective (2014). In this approach, product energy efficiencies in the base case that do not meet the standard level under consideration would roll up to meet the new standard level. Product energy efficiencies in the base case that exceeded the standard level under consideration would not be affected. For the trend after 2014, we applied an annual growth rate in average energy efficiency to the shipments-weighted CEER. We developed growth trends for each efficiency level that maintained the same per-unit average total installed cost difference for 2014 between the base case and each standards case over the entire forecast period. Because the total installed cost versus efficiency relationship for each product class demonstrates an increasing cost rate for more efficient products, the shipments-weighted efficiency growth rate for each standards case is lower than the shipmentsweighted efficiency growth rate for the base case.
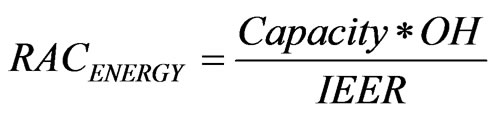
4.3. National Energy Savings We calculated the national annual site energy consumption by multiplying the number or stock of each product class (by vintage) by its unit energy consumption (UEC: also by vintage).
The product stock in a given year is the number of products shipped from earlier years that survive in the given year. The stock depends on annual shipments and the lifetime of the product. The NIA models keep track of the number of units shipped each year. We assumed that room air conditioners have an increasing probability of retiring as they age. The survival function represents the probability of survival as a function of years since purchase.
Because per-unit annual energy consumption is directly dependent on energy efficiency, we used the shipments-weighted energy efficiencies for the base and standards cases, along with the annual energy use data, to estimate the shipments-weighted average annual per-unit energy consumption under the base and standards cases (Table 9). Because per-unit annual energy consumption is a function of energy efficiency, the values shown in Table 9 scale with the average shipments-weighted efficiency throughout the forecast period.
Electricity consumption is converted from site energy to source energy (quads) by applying a time-dependent conversion factor.
To avoid including savings attributable to shipments displaced because of standards, we used the projected standards-case shipments and, in turn, the standards-case stock, to calculate the annual energy consumption for the base case.
When calculating energy consumption at each considered efficiency level for room air conditioners, we took into consideration that some consumers may use more efficient room air conditioners for more time than they would have used less efficient units. Based on limited data in the literature, we applied a rebound effect of 15 percent [13]. When the rebound effect is incorporated, calculated energy savings are lower than if no rebound effect were considered
4.4. Net Present Value
The NPV calculation uses the operating cost savings in each year, the increased total installed costs in each year, and a discount factor. We calculated the total annual savings in operating costs by multiplying the number or stock of a given product class (by vintage) by its per-unit savings on operating costs (also by vintage). We calculated the total annual increases in installed costs by multiplying the number or stock of the given product class (by vintage) by its per-unit total increase in installed costs (also by vintage).
Because the per-unit total annual installed cost is directly dependent on energy efficiency, we used the shipments-weighted energy efficiencies of the base and standards cases, in combination with the total installed costs, to estimate the shipments-weighted average annual perunit total installed cost under the base and standards cases. Table 10 shows the costs in 2014.
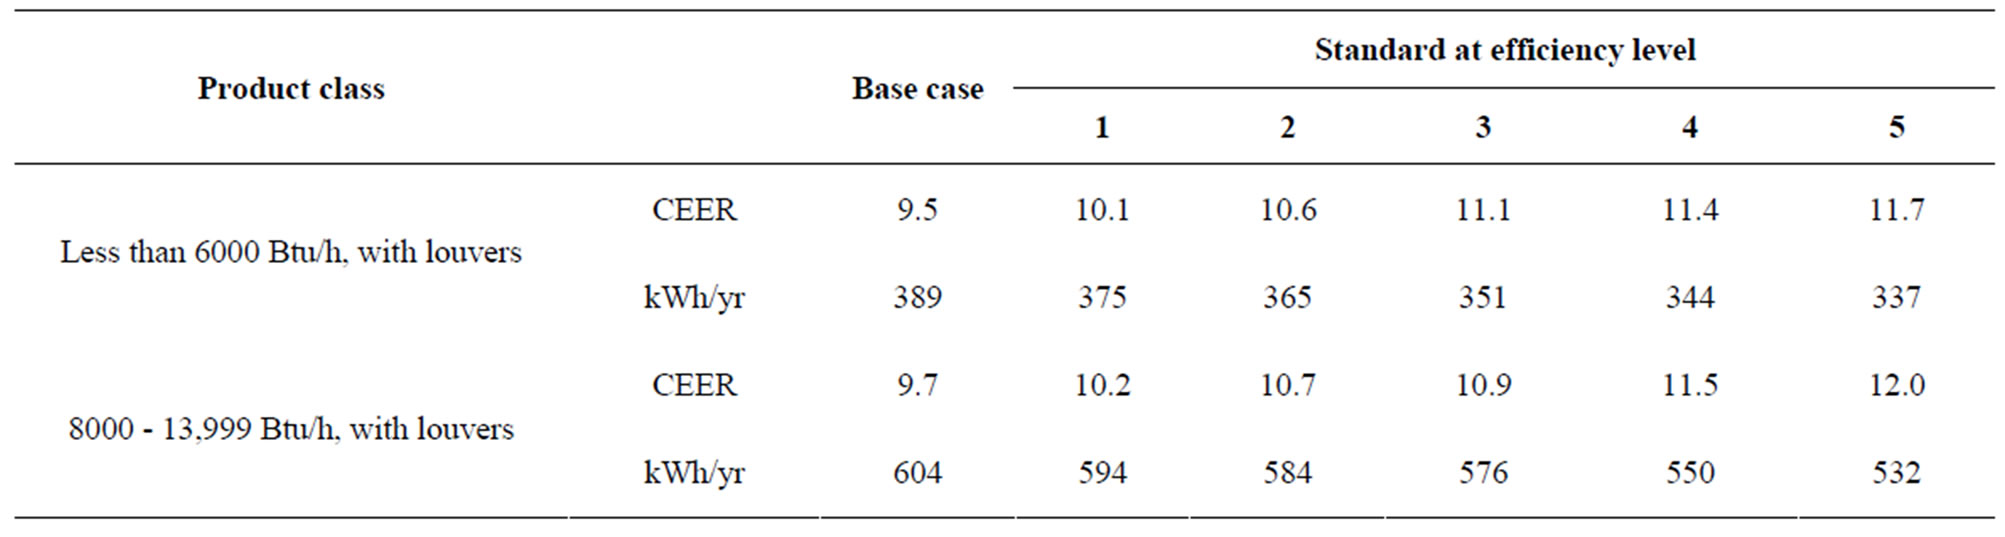
Table 9. Shipments-weighted average annual energy consumption in 2014, residential sector.
We applied the experience rate described previously to forecast the prices of room air conditioners sold in each year in the forecast period. The price in each year is a function of the cumulative production of room air conditioners forecast in each year. We applied the same values to forecast prices for each product class at each considered efficiency level. The estimated experience rate (defined as the fractional reduction in price expected from each doubling of cumulative production) for room air conditioners is 38.9 percent. With cumulative shipments through 2043 projected to reach 503 million (compared with 225 million in 2010), the real price is projected to drop to 0.57 times the 2010 value.
We determined the savings in per-unit annual energy cost for each product class by multiplying the savings in per-unit annual energy consumption by the appropriate energy price.
We used both a 3-percent and a 7-percent real discount rate when estimating national impacts, in accordance with the Office of Management and Budget (OMB)’s guidance to Federal agencies on developing regulatory analyses [14]. We defined the present year as 2011.
4.5. Results of National Impact Analysis
Table 11 shows the cumulative NES in 2014-2043 for the efficiency levels analyzed for the groups of product classes for room air conditioners. Table 12 shows the consumer NPV results at a 3-percent and a 7-percent discount rate. A negative NPV indicates that the costs of
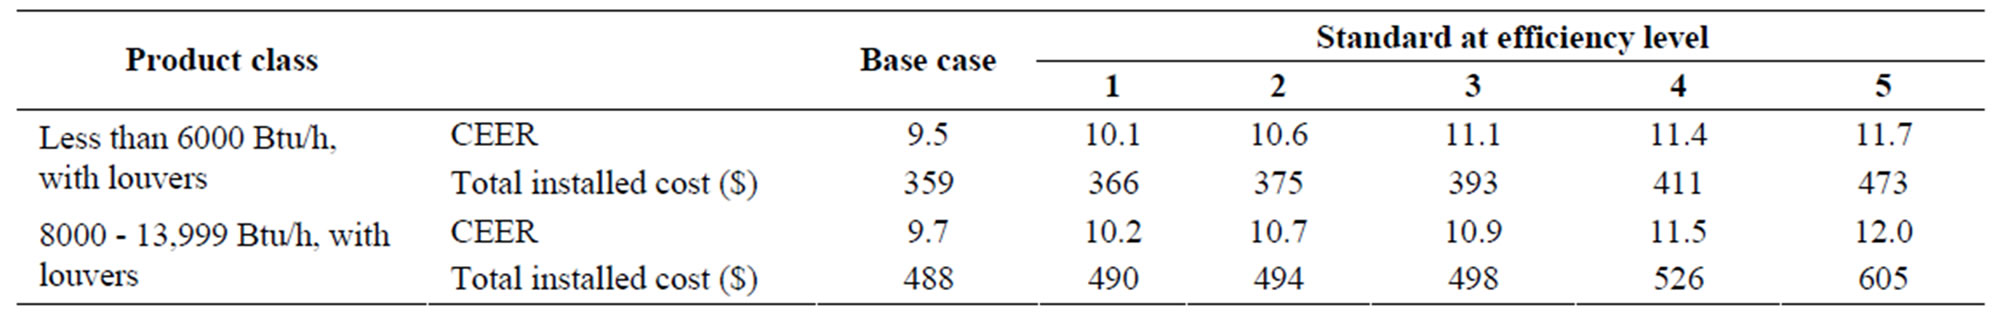
Table 10. Shipments-weighted average total installed costs in 2014.
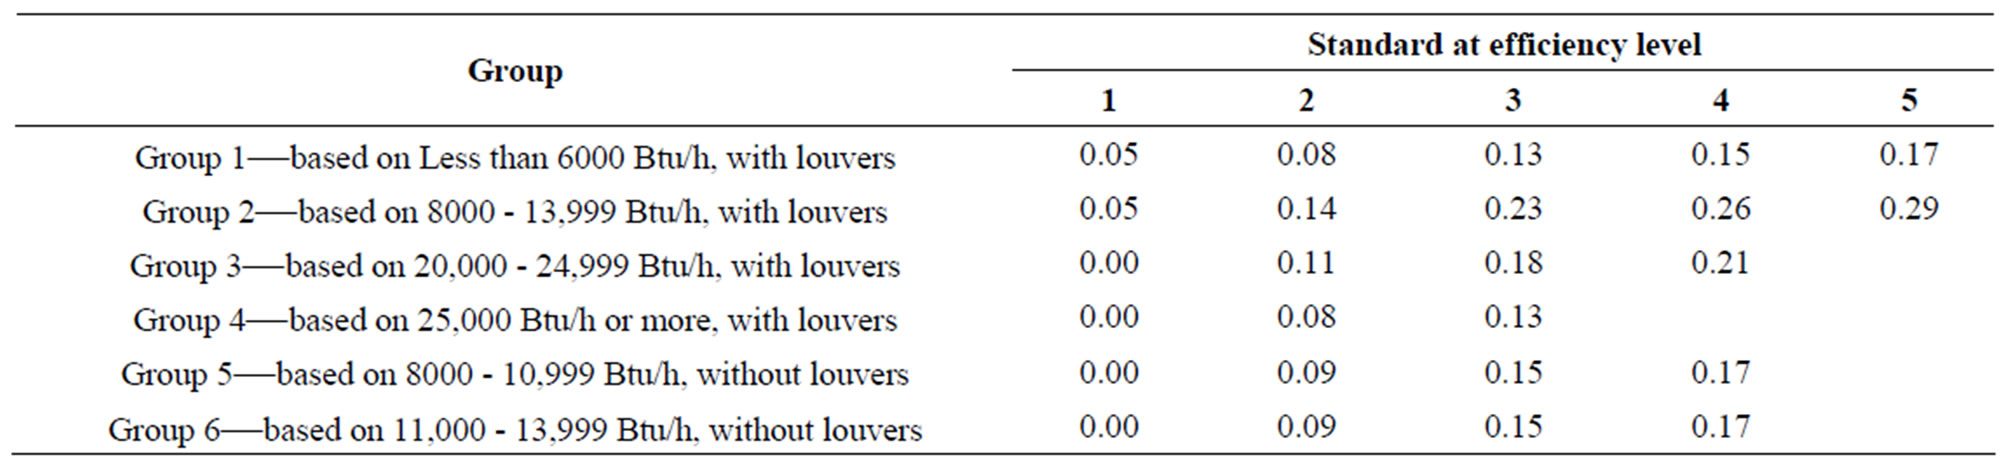
Table 11. Cumulative national energy savings in quads for room air conditioner standards.
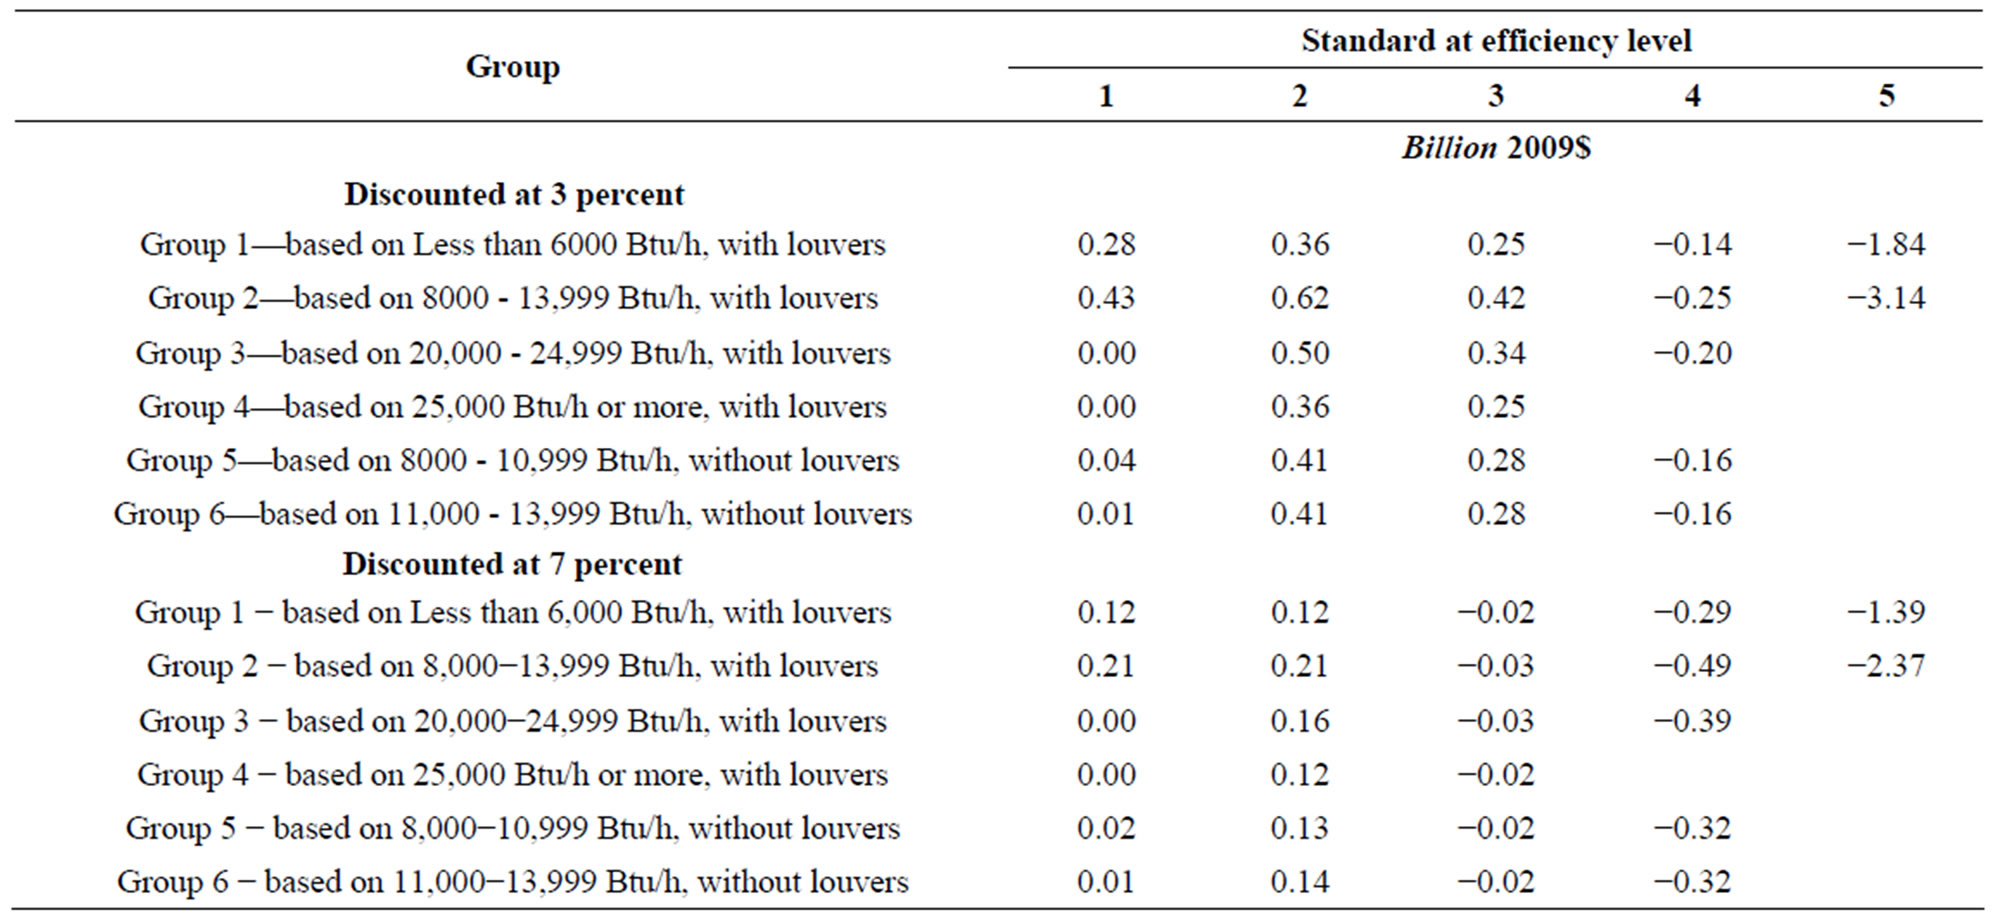
Table 12. Cumulative consumer net present value for room air conditioner standards.
a standard at a given efficiency level exceed the savings. Efficiency level 3 is the highest level that has a positive consumer NPV with a 3-percent discount rate, while it has a slightly negative consumer NPV with a 7-percent discount rate.
5. Conclusion
Our analysis indicates that standards for room air conditioners at efficiency level 3, which is 17% more efficient in the case of room air conditioners less than 6000 Btu/h with louvers, and 12% more efficient in the case of room air conditioners 8000 - 13,999 Btu/h with louvers, would save close to one quad of energy over 30 years and have a consumer NPV between −$0.14 billion and $1.82 billion. In addition, such standards would reduce carbon dioxide emissions and NOx emissions.
6. Acknowledgements
The work described in this report was funded by the U.S. Department of Energy’s Office of Energy Efficiency and Renewable Energy, Building Technologies Program under Contract No. DE−AC02−05CH11231. The authors acknowledge the careful editing of Mary James.
REFERENCES
- US Department of Energy, “Energy Conservation Program: Energy Conservation Standards for Residential Clothes Dryers and Room Air Conditioners; Final Rule,” April 2011. http://www1.eere.energy.gov/buildings/appliance_standards/residential/pdfs/aham_2_direct_final_rule.pdf
- http://www1.eere.energy.gov/buildings/appliance_standards/residential/residential_clothes_dryers_room_ac_direct_final_rule_tsd.html.
- US Department of Energy, Energy Information Administration, “Residential Energy Consumption Survey: 2005 Public Use Data Files,” 2005. http://www.eia.gov/consumption/residential/data/2005/
- “Baseline Manufacturer Costs for Room Air Conditioners as Developed by DOE in the Technical Support Document for the Room Air Conditioner Rulemaking.” http://www1.eere.energy.gov/buildings/appliance_standards/residential/residential_clothes_dryers_room_ac_direct_final_rule_tsd.html
- M. Weiss, H. M. Junginger, M. K. Patel and K. Blok, “A Review of Experience Curve Analyses for Energy Demand Technologies,” Technological Forecasting & Social Change, Vol. 77, No. 3, 2010, pp. 411-428.
- Energy Information Administration, “Annual Energy Outlook 2010 with Projections to 2035,” Energy Information Administration, Washington DC, 2010. http://www.eia.doe.gov/oiaf/aeo/ doi:10.1016/j.techfore.2009.10.009
- K. Coughlin, R. White, C. Bolduc, D. Fisher and G. Rosenquist, “The Tariff Analysis Project: A Database and Analysis Platform for Electricity Tariffs,” Lawrence Berkeley National Laboratory, Berkeley, 2006.
- K. Coughlin, C. Bolduc, R. Van Buskirk, G. Rosenquist and J. E. McMahon, “Tariff-Based Analysis of Commercial Building Electricity Prices,” Lawrence Berkeley National Laboratory, Berkeley, 2008.
- US Department of Commerce-Bureau of the Census, “American Housing Survey,” 1997, 1999, 2001, 2003, 2005, 2007. http://www.census.gov/hhes/www/ahs.html doi:10.2172/928425
- The Federal Reserve Board, “Survey of Consumer Finances,” 1989, 1992, 1995, 1998, 2001, 2004, 2007. http://www.federalreserve.gov/pubs/oss/oss2/scfindex.html
- Ibbotson Associates, “SBBI Edition 2009 Valuation Yearbook,” Ibbotson Associates, Chicago, 2009. http://corporate.morningstar.com/ib/documents/MarketingOneSheets/DataPublication/SBBI_ValuationTOC.pdf
- Damodaran Online, “The Data Page: Cost of Capital by Industry Sector,” 2001-2008. http://pages.stern.nyu.edu/~adamodar/
- S. Sorrell, J. Dimitropoulos and M. Sommerville, “Empirical Estimates of the Direct Rebound Effect: A Review,” Energy Policy, Vol. 37, No. 4, 2009, pp. 1356- 1371. doi:10.1016/j.enpol.2008.11.026
- Office of Management and Budget (OMB), “Identifying and Measuring Benefits and Costs,” OMB Circular A-4, Section E, Office of Management and Budget (OMB), Washington DC, 2003.
NOTES
*Corresponding author.