Modern Research in Inflammation
Vol.04 No.02(2015), Article ID:58793,14 pages
10.4236/mri.2015.42002
Temporal and Spatial Changes in the Pattern of Iba1 and CD68 Staining in the Rat Brain Following Severe Traumatic Brain Injury
Debbie Smith1, Diane Brooks1, Eric Wohlgehagen1, Thomas Rau1, David Poulsen2*
1Department of Biomedical and Pharmaceutical Sciences, The University of Montana, Missoula, USA
2Neurosurgery Department, SUNY-School of Medicine and Biomedical Sciences, University at Buffalo, Buffalo, USA
Email: *dpoulsen@ubns.com
Copyright © 2015 by authors and Scientific Research Publishing Inc.
This work is licensed under the Creative Commons Attribution International License (CC BY).
http://creativecommons.org/licenses/by/4.0/


Received 23 June 2015; accepted 11 August 2015; published 14 August 2015
ABSTRACT
We have previously demonstrated that acute treatment with low dose methamphetamine is neuroprotectivein a rat model of severe traumatic brain injury (TBI). Using gene expression analysis, we further showed that methamphetamine treatment significantly reduced the expression of pro- inflammatory genes after severe TBI. Therefore, to further investigate the potential effects of methamphetamine treatment on the neuroinflammatory response, we examined immunofluorescent staining of Iba1 and CD68, two marker of neuroinflammation, in the rat lateral fluid percussion injury model of severe TBI. In this study, we observed temporal and spatial alterations in the pattern of Iba1 and CD68 labeling within two weeks after severe TBI. In general, methamphetamine treatment did not dramatically alter the pattern of Iba1 and CD68 staining. However, we did observe a unique and significant drug-induced increase of Iba1 labeling within the granule cell layer of the dentate gyrusat 48 hours post injury. We also observed rod-shaped Iba1+ cells within the core lesion in the cortex. These cells showed variable staining with CD68 and aligned most closely with MAP2+ neuronal processes. Thus, acute treatment with low-dose methamphetamine after severe TBI caused a transient bilateral increase of Iba1+ cells within the granule layer of the dentate gyrus but did not alter the overall temporal and regional pattern of Iba1 and CD68 staining within the cortex, periventricular white matter, fimbria, or thalamus.
Keywords:
TBI, Methamphetamine, Iba1, CD68

1. Introduction
Traumatic brain injury (TBI) is a leading cause of death and disability in the United States with 1.7 million new cases reported each year [1] [2] . Individuals surviving TBI commonly present with cognitive deficits, chronic headaches, and mood disorders. Recent estimates report approximately 43.3% of Americans continue to display residual disabilities 1 year after their injury [3] . In addition, TBI significantly increases the risk of developing epilepsy and Alzheimer’s disease [4] [5] .
The brain’s inflammatory response to TBI occurs within seconds of impact and may persist for years after injury [6] . Post-TBI neuroinflammation, specifically the response of microglia, is a complex and poorly understood phenomenon. Activated microglia may be beneficial, acting to protect healthy tissue and repair damaged tissue. However, microglia can also release pro-inflammatory cytokines and chemokines, which are partially responsible for the spread of secondary damage after the initial TBI [7] . Comprising only 10% - 20% of total cells within the adult CNS, the significance of microglia was overlooked for decades [6] [8] [9] . However, microglias are now the subject of numerous recent publications and heated debate [10] . Activation of microglia has been linked to neuropathologies, including chronic pain, amyotrophic lateral sclerosis (ALS) and Alzheimer’s disease [6] [11] [12] . Paradoxically, activation of microglia has been linked to both neuroprotection [3] [13] and neurotoxic events [14] [15] .
Microglia can adopt a spectrum of morphologies and specialized functions. For example, rod microglia remain poorly understood even though they have been observed in damaged cortical tissue for over a century since Franz Nissl described them in 1899 [16] . These rod-shaped cells have been found in an array of progressive neuropathologies in both animal models and humans [16] [17] . A better understanding of the nuances of microglia activation could lead to the development of novel therapeutics.
Methamphetamine is a strong central nervous system stimulant that causes the release of dopamine, serotonin and norepinephrine. It was first synthesized in 1887 and while toxic at high doses, low dose (25 mg/24hours) methamphetamine is FDA approved and has been used for decades to treat ADHD in children over the age of 6 and has also been used for the treatment of obesity. We have reported that low-dose methamphetamine delivered within 8 - 12 hours in rat models of severe TBI improves behavioral, cognitive, histological and MRI outcomes [18] - [20] . We further demonstrated that methamphetamine mediates neuroprotection in part through a dopamine/PI3K/AKT-signaling pathway [21] . In addition, we reported that treatment with low-dose methamphetamine reduced the expression of pro-inflammatory signals, including interleukin-1β, CXCL2 and MYD88, while significantly increasing the expression of the anti-inflammatory chemokine CXCL12 following TBI [20] . Therefore, we hypothesized that low dose methamphetamine may mediate neuroprotection in part by modulating microglial activation. To test this hypothesis, we used the lateral fluid percussion injury (LFPI) model, which has been used in TBI research for decades and is a well-established protocol for replicating closed-skull injury. LFPI consistently causes clinical characteristics of human TBI, including intracranial hemorrhage, brain swelling, focal and diffuse axonal injury and the progression of damage radiating from the injury core [5] . We chose to focus on labeling total microglia with antibodies directed against ionized calcium-binding adaptor molecule 1 (Iba1) and phagocytic microglia with antibodies directed against Cluster of Differentiation 68 (CD68). However, it is important to note that these markers do not differentiate between resident microglia and infiltrating macrophages [3] . Thus in this study, cells are defined as Iba1 and CD68-immunopositive, rather than using the terms microglia or macrophage. Using this approach, we monitored region-specific neuroinflammation between 48 hours and 2 weeks post injury.
2. Methods
2.1. Surgical Procedures
All animal-use protocols were reviewed and approved by the University of Montana’s Institutional Animal Care and Use Committee. Charles River Laboratories supplied adult, male Wistar rats (mean body weight = 400 g; 2 - 3 months old). The rats were kept in a regulated environment consisting of temperature control and 12-hour light/12-hour dark daily cycle. The rats had constant access to food and water along with high-calorie enriched food to prevent weight-loss following TBI.
Rats were randomly distributed to one of three treatment groups: 1) uninjured controls, 2) saline-TBI or 3) methamphetamine-TBI. Rats were anesthetized by 1% - 3% isofluorane (Abbot Animal Health, Abbot Park, IL) inhalation. A 5-mm craniotomy was formed over the right hemisphere caudal to the Bregma suture. A FPD 302 fluid percussion TBI device (Amscien Instruments) was used to cause a brief (~20 msec) depression of the dura mater that was the direct cause of injury. The intensity of the pressure delivered ranged from 1.9 - 2.1 atm. This pressure resulted in a 25% mortality rate and modeled a severe head injury as we previously reported [19] [20] . Supplemental oxygen was supplied immediately after the injury and maintained until the animal recovered consciousness. The uninjured controls received craniotomy but did not undergo any aspect of the LFPI. Treatment was delivered 3 hours after TBI and continued for 24 h. An Alzetosmotic pump (Alzet, Cupertino, CA) implanted in the right inguinal crease, continuously delivered (6.7 μl/hour) treatment via the right femoral vein. Methamphetamine (Sigma-Aldrich, St Louis, MO) was delivered via an IV bolus injection of 0.42 mg/kg followed by 24-hour infusion with 0.5 mg/kg/hour.
An average righting time (the time in minutes required for an animal to bear weight on all four limbs) of 30 minutes was observed with this severity of injury. A modified neurological severity score (mNSS) assessment was also used to determine the severity of injury as previously described [19] - [21] . A score between 1 - 4 is considered mild, 5 - 9 moderate, and 10 - 15 severe. An NSS of 10 or higher was required for inclusion in this study.
Brains were collected from injured rats at 48 h, 1 week or 2 weeks after TBI. Brains from uninjured controls were collected at 48 hrs after craniotomy. Intraperitoneal injections of ketamine (80 mg/kg-MWI Veterinary Supply Co., Chicago, IL) and xylazine (13 mg/kg-MWI Veterinary Supply Co., Chicago, IL) were used prior to perfusion of 4% paraformaldehyde (PFA-Sigma/Aldrich, St Louis, MO) fixative via transcardiac puncture. Brains were extracted and post-fixed for 24 hours at 4˚C in 4% PFA and divided into 2-mm coronal sections. Sections were processed, paraffin embedded and 7-μm thick slices were prepared.
2.2. Immunohistochemistry
Rat brain slices were dual-labeled with anti-Iba1 antibody and one of the following antibodies: CD68, Endothelial Barrier Protein (SMI-71), Microtubule-associated protein 2 (MAP2), or Neurofilament (SMI-312). Antibodies were detected using the Cyanine 3 Tyramide Signal Amplification (TSA) Kit (Perkin Elmer, Waltham MA). Endogenous peroxidase activity was blocked with 3% peroxide for ten minutes followed by a wash in phosphate-buffered solution (PBS-VWR International, Denver, CO). This was followed by permeabilization with 0.3% Triton X100 (Sigma-Aldrich, St Louis, MO) for 30 minutes then washed in PBS. Citric acid antigen retrieval was then performed by boiling slides in 0.1 M citric acid, pH 6.4 for 10 minutes and cooling in the citric acid solution for 30 minutes before rinsing in PBS. Sections were blocked for 30 minutes in blocking buffer (PNB) derived from reagents included in the TSA Kit. The goat primary anti-Iba1 antibody (Abcam ab5076; diluted 1:1000) was applied and incubated overnight at 4˚C. The next day, slides were washed with PBS three times for 5 minutes each. Slides were then incubated with biotinylated α-goat IgG (Vector Labs, Burlingame CA) at a dilution of 1:400 for 1 hour at room temperature. Following three more 5-minute PBS washes, sections wereincubated with streptavidin horseradish peroxidase (HRP), obtained from the TSA Kit (diluted 1:100) for 1 hour at room temperature. Slides then received three more 5-minute washes with PBS before incubating in Cyanine 3, included in the TSA Kit (diluted 1:50) for 10 minutes. Sections were then blocked in 4% normal goat serum (Vector Labs, Burlingame CA) for 30 minutes and incubated overnight at 4˚C with one of the following primary antibodies: CD68 (SerotecMCA341GA; diluted 1:1000), MAP2 (Abcam ab32454; diluted 1:2000), SMI-71 (Abcam ab24764; diluted 1:1000) or SMI-312 (Covance; diluted 1:1500). All antibodies accurately labeled structures corresponding with their previously published target specificity [22] - [26] . The next day, slides were washed and signal detected by incubating with Alexa Fluor 488 goat α-mouse IgG or Alexa Fluor 488 goat α-rabbit IgG (Life Technologies, Grand Island NY) (diluted 1:400) for 1 hour at room temperature. After three 5-minute rinses with PBS, nuclei were counterstained with DAPI (Life Technologies, Grand Island NY) diluted to 1 μg/ml in PBS for 5 minutes. Sections were rinsed in PBS, rinsed briefly in ddH2O and coverslipped using Fluor Save mounting media (Calbiochem/EMD Millipore, Billerica MA).
2.3. Image Capture & Statistical Analysis
Images were captured on an OlympusFluoviewFV1000 confocal microscope (Olympus, Center Valley PA). Single-plane images were used for quantification and image analysis using Image-Pro Plus 6.2 software (Image-Pro, Bethesda MD). Representative images presented are Z-stack images. All images were collected from sections taken from Bregma −3.3. It has been shown that digital image analysis is appropriate for analyzing changes in clusters of overlapping microglia or macrophages [27] . Due to the Iba1-immunopositive cell clusters observed in our samples, we chose to use digital image analysis rather than stereologiccell counting. Areas of interest and appropriate threshold values were defined for each structure as previously described [27] . Sum integrated optical density (IOD) was measured within the cortex, periventricular white matter, fimbria, dentate gyrus, granule cell layer of the dentate gyrus, hippocampal CA3 radiatum, and thalamic laterodorsal nuclei. Treatment group averages of sum IOD and standard errors of the mean were calculated. One-way Analysis of Variance (ANOVA) tests with Tukey’s post hoc comparison were used when comparing several groups. Student’s unpaired t-Tests were used when comparing only two groups. P-values less than 0.05 were deemed statistically significant.
3. Results
In the brain, Iba1 is specifically expressed on microglia. Iba1 expression is upregulated upon microglia activation. CD68 is a lysosomal protein and has been used to stain macrophages and microglia. Like Iba1, CD68 expression is increased in activated microglia. Therefore, we used staining of these two markers as measures of neuroinflammation. Between 48 hours and 2 weeks after severe TBI, an increase in both CD68+ and CD68−- Iba1+ cells was observed in the cortex, periventricular white matter, dentate gyrus, CA3 radiatum, fimbria, and thalamus. However, temporal and spatial differences were observed in both Iba1 and CD68 labeling. Although the major core lesion after lateral fluid percussion injury (LFPI) is primarily observed in the cortex, there was not a significant increase of Iba1 staining at 48 hours after injury (Figure 1). However, increased labeling of Iba1

Figure 1. Pattern of Iba1 and CD68 staining in the cortex (injury core) at 48 hrs, 1 week and 2 weeks post-TBI. Iba1 (red), CD68 (green) and DAPI (blue). (A) Schematic of a rat brain at Bregma −3.3 with red box marking location of analysis, (B) Uninjured control, (C) Summary graph of Iba1staining presented as relative fluorescence intensity (IOD SUM), (D) Summary graph of CD68 staining presented as relative fluorescence intensity (IOD SUM), (E) Saline at 48 hours, (F) Saline 1 week after TBI, (G) Saline 2 weeks after TBI, (H) Methamphetamine at 48 hours post-TBI, (I) Methamphetamine one week post-TBI, and (J) Methamphetamine 2 weeks post-TBI. For 48 hour analysis (Saline n = 6; Methamphetamine n = 6), for 1 Week analysis (Saline n = 5; Methamphetamine n = 4), for 2 week analysis (Saline n = 4; Methamphetamine n = 4), * = p < 0.05 compared to uninjured, ** = p < 0.01 compared to uninjured; # = p < 0.05 compared to 48 hour Saline, and ϕϕ = p < 0.01 compared to 48 hour Methamphetamine; scale bar = 80 μm.
with in the cortex was observed 1 week after TBI and remained elevated at the 2-week time point. Interestingly, CD68 labeling did not parallel the increase of Iba1 labeling seen at one and two weeks post-TBI.
In addition to amoeboid shaped Iba1+ cells, we observed rod-shapedIba1+ cells within the injury zone of the cortex. Rod-shapedIba1+ cells were not observed until1 week after injury and were most evident within the cortical lesion at two weeks post-TBI. The occurrence and prevalence of rod-shapedIba1+ cells within the injury core of the cortex was not altered by treatment with methamphetamine (data not shown). Rod-shaped cells labeled with Iba1 but only occasionally co-labeled with antibodies to CD68 (Figure 2), suggesting that phagocytosis is not a consistent function of these cells. The lack of co-labeling with SMI-71 indicated that rod-shaped Iba1+ cells do not align with nearby neurovasculature (Figure 2). Ziebell et al. [17] and Taylor et al. [28] suggested that rod-shapedIba1+ cells align with cortical axons. Indeed, stained axons (with NF312 antibody) and dendrites (with anti-MAP2 antibody), showed an undeniable alignment with rod-shapedIba1+ cells (Figure 2). However, co-localization was not observed betweenIba1 and NF312 and only occasionally seen with Iba1 and MAP2. When colocalization was seen between MAP2 and Iba1 staining, it consisted of the medial end of a rod cell associating with the distal tip of MAP2-labeled dendrites.
In addition to the cortex, the hippocampus is vulnerable to damage following TBI. Hippocampal sclerosis is a common consequence of TBI seen in human patients and animal models [5] [29] . In addition, we have reported CA1 neuronal loss as consequence of severe TBI in the LFPI model [20] . Of the brain regions examined, the hippocampus showed the earliest increase in Iba1 staining. At 48 hours, the majority of Iba1 staining was observed within the dentate gyrus (Figure 3) and the stratum radiatum of region CA3 (Figure 4). In addition, compared to uninjured controls, we observed significantly more CD68+ labeling within both hippocampal regions but only at 48 hours post injury. In addition, the increase in CD68 staining was observed in both methamphetamine and saline treated rats, with no significant difference seen between the two treatment groups.
Interestingly, the hippocampus was unique in the pattern of Iba1/CD68 staining, which did differ between the treatment groups. Although a dramatic reduction in CD68 labeling was observed in both saline and metham- phetamine treated rats at the 1-week time point, Iba1 labeling remained significantly elevated only in the saline treated group at one week. Although the time course of Iba1 labeling was similar between the dentate gyrus and the CA3 stratum radiatum, the magnitude of Iba1 labeling was much greater within the dentate gyrus. Further scrutiny of the response within the dentate gyrus further revealed a unique, treatment-dependent pattern within the granule cell layer. Iba1 labeling within the dentate gyrus as a whole was not different between the methamphetamine and saline treated groups. However, further analysis of the granule cell layer demonstrated a significant effect of methamphetamine treatment (Figure 5(A), Figure 5(B)). Theipsilateral granule cell layer of methamphetamine-TBI rats displayed a significant increase of both Iba1 and CD68 labeling at 48 hours post-TBI compared to uninjured controls. In contrast, the saline treated TBI rats only showed a significant increase in CD68 labeling, which was significantly lower than that seen in methamphetamine-treated rats (Figure 4). Although rats treated with saline showed an increase of Iba1 within the dentate gyrus, surprisingly no increase was seen within the granule cell layer. For both treatment groups, levels of Iba1 and CD68 labeling within the granule cell layer at 1 and 2 weeks post-TBI were approximately equivalent to those observed in uninjured animals. Since previous studies have established that the response of microglia to higher doses of methamphetamine is observed bilaterally, we turned our attention to the contralateral granule cell layer [30] . Increased Iba1 labeling was also observed within the contralateral granule cell layer of methamphetamine-treated TBI animals compared to saline-TBI treated and uninjured controls, thus confirming the drug-specific effect of low-dose methamphetamine on activation of Iba1+ cells within this structure (Figures 5(L)-(Q)). Interestingly, abilateral increase in CD68 labeling was not observed (Figure 5(P)). Regardless of the treatment, CD68 was only observed ipsilateral to the injury (Figure 5(G), Figure 5(J), Figure 5(M), Figure 5(N)). Thus, Iba1+ cells showed two separate responses to two distinct stimuli, TBI and methamphetamine treatment. This dualistic response of Iba1+ cells is worth investigating further and may have future implications for drug development. Taken together, TBI causes an increase of Iba1 and CD68 within the ipsilateral dentate gyrus regardless of treatment, while treatment with methamphetamine causes a bilateral increase of Iba1 specifically within the granule cell layer.
Damage to white matter tracts is also a common consequence of TBI and is implicated in the development of long-term cognitive impairments. In human patients, damage to white matter tracts can be seen on scans years after a moderate or severe TBI [14] [31] [32] . Furthermore, reports from both humans and animal models indicate that white matter injury (WMI) progresses temporally [32] . We previously reported that treatment with low-dose methamphetamine produced significant increases in white matter tract remodeling at 5 and 6 weeks

Figure 2. Rod-shaped Iba1+ cells showed variable CD68 staining and aligned with neuronal processes. Images show Iba1+ rod-shaped cells within the cortical core injury at 2 weeks after TBI. The top row shows rod-shaped cells labeled with Iba1 (A), CD68 (B) and the merged image (C). The second row shows rod-shaped cells labeled with Iba1 (D), NF312 (E) and the merged image (F). The third row shows rod-shaped cells labeled with Iba1 (G), MAP2 (H) and the merged image (I). The bottom row shows rod-shaped cells labeled with Iba1 (J), SMI-71 (K) and the merged image (L). Scale bar represents 60 μm; arrows show linear direction of stained processes; boxes show examples of colocalization; Iba1 (red) and CD68 (green, top row); NF312 (green, second row); MAP2 (green, third row); SMI-71 (green, bottom row).

Figure 3. TBI causes increases inIba1 and CD68 staining in the ipsilateral dentate gyrus after injury. Iba1 (red), CD68 (green) and DAPI (blue). (A) Schematic of a rat brain at Bregma −3.3 with red box marking location of analysis, (B) Uninjured control, (C) Summary graph of Iba1 staining presented as relative fluorescence intensity (IOD SUM), (D) Summary graph of CD68 staining presented as relative fluorescence intensity (IOD SUM), (E) Saline at 48 hours after TBI, (F) Saline at 1 week after TBI, (G) Saline at 2 weeks after TBI, (H) Methamphetamine at 48 hours after TBI, (I) Methamphetamine at 1 week after TBI, (J) Methamphetamine at 2 weeks after TBI. For 48 hour analysis (Saline n = 6; Methamphetamine n = 6), for 1 week analysis (Saline n = 5; Methamphetamine n = 4), for 2 week analysis (Saline n = 4; Methamphetamine n = 4), ** = p < 0.01 compared to uninjured, *** = p < 0.001 compared to uninjured; # = p < 0.05 compared to 48 hour Saline, ## = p < 0.01 compared to 48 hour Saline and ϕϕϕ = p < 0.001 compared to 48 hour Methamphetamine; scale bar = 80 μm.
post TBI [18] . There is also a known connection between WMI and the time course of neuroinflammation following TBI [33] [34] . Therefore, we investigated Iba1and CD68 labeling within white matter tracts in a time- dependent manner. An increase in Iba1 labeling within the fimbria ipsilateral to the injury was greatest 1 week after TBI (Figure 6). While increases in Iba1 and CD68 labeling were seen in both treatment groups, only saline-treated rats showed a statistically significant difference. However, there was not a significant difference between saline and methamphetamine treated rats. A similar pattern of CD68 labeling was observed. Both Iba1 and CD68 staining was higher in injured rats at 1 week and returned to near baseline levels by 2 weeks post-TBI. In contrast, the periventricular white matter, proximal to the cortical injury zone, showed the largest effect at 2 weeks after TBI (Figure 7). Labeling with both Iba1 and CD68 increased within the periventricular white matter at each subsequent time point. Again, treatment with methamphetamine did not alter staining of these two markers in either the fimbria or periventricular white matter at these time points.
We observed regions of autofluorescence in the ipsilateral periventricular white matter at 48 hours post TBI (Figure 8(A)). The autofluorescence was detectable primarily in the green channel. Further scrutiny under high magnification showed a large number of small nucleated cells that did not co-label with Iba1 (Figure 8(B)). Given their lack of nucleus, location and time after injury, we can be fairly confident that these were erythrocytes associated with hemorrhage caused by the severe TBI. Consistent with this theory, these cells were not seen at later

Figure 4. Iba1 and CD68 staining in the ipsilateral CA3 stratum radiatum post-TBI. Images show the stratum radiatum of CA3 within the ipsilateral hippocampus labeled with Iba1 (red), CD68 (green) and DAPI (blue). (A) Schematic of a rat brain at Bregma −3.3 with red box marking location of analysis, (B) Uninjured control, (C) Summary graph of Iba1 staining presented as relative fluorescence intensity (IOD SUM), (D) Summary graph of CD68 staining presented as relative fluorescence intensity (IOD SUM), (E) Saline at 48 hours, (F) Saline 1 week after TBI, (G) Saline 2 weeks after TBI, (H) Methamphetamine at 48 hours post-TBI, (I) Methamphetamine one week post-TBI, and (J) Methamphetamine 2 weeks post-TBI. For 48 hour analysis (Saline n = 6; Methamphetamine n = 6), for 1 Week analysis (Saline n = 5; Methamphetamine n = 4), for 2 Week analysis (Saline n = 4; Methamphetamine n = 4), * = p < 0.05 compared to uninjured; scale bar = 80 μm.
time points. Furthermore, the general location of hemorrhages seen at 48 hours after injury corresponded with the areas of significantly increased Iba1 and CD68 labeling seen at 2 weeks (Figure 7). Treatment with methamphetamine did not alter the appearance of hemorrhages seen 48 hours after injury.
Activated microglia can be detected in the thalamus for up to 1-year post-TBI [3] [14] . Although unremarkable at 48 hours post-TBI, the laterodorsal thalamic nuclei displayed an interesting response pattern at subsequent time points (Figure 9). By 1-week post-TBI, a significant increase of Iba1 was observed in both methamphetamine- and saline-treated animals. This increase in labeling remained at the 2-week time point. In contrast, a significant increase inCD68 labeling was not seen until 2 weeks post injury and was only significant in the saline-treated rats. However, there was not a significant difference between saline and methamphetamine-treated rats.
4. Discussion
The controversial, multifaceted roles of microglia, can make interpretation of post-TBI neuroinflammation data a challenge. However recent publications focusing on neuroinflammation continue to provide evidence for the undeniable importance of microglia to neuropathologies. Our study sought to elucidate the potential effect oflow-dose methamphetamine on the progression of neuroinflammation following severe TBI. High doses of methamphetamine are known to influence neuroinflammation while low doses improve cognitive and functional

Figure 5. Methamphetamine causes a bilateral increase of Iba1 labeling within the granule cell layer of the dentate gyrus. Images show the granule cell layer of the ipsilateral dentate gyrus at Bregma −3.3 labeled with Iba1 (red), CD68 (green) and DAPI (blue). (A) Uninjured Iba1 and DAPI, (B) Uninjured CD68 & DAPI, (C) Uninjured Iba1, CD68 and DAPI merged, (D) Saline (ipsilateral) at 48 hours post-TBI Iba1 & DAPI, (E) Saline (ipsilateral) at 48 hours post-TBI CD68 & DAPI, (F) Saline (ipsilateral) at 48 hours post-TBI Iba1, CD68, and DAPI merged, (G) Methamphetamine (ipsilateral) at 48 hours post-TBI Iba1 & DAPI, (H) Methamphetamine (ipsilateral) at 48 hours post-TBI CD68 & DAPI, (I) Methamphetamine (ipsilateral) at 48 hours post-TBI Iba1, CD68 and DAPI merged. (J) Saline (contralateral) at 48 hours post-TBI Iba1 & DAPI, (K) Saline (contralateral) at 48 hours post-TBI CD68 & DAPI, (L) Saline (contralateral) at 48 hours post-TBI Iba1, CD68, and DAPI merged, (M) Methamphetamine (contralateral) at 48 hours post-TBI Iba1 & DAPI, (N) Methamphetamine (contralateral) at 48 hours post-TBI CD68 & DAPI, (O) Methamphetamine (contralateral) at 48 hours post-TBI Iba1, CD68 and DAPI merged. (P) Summary graph of Iba1 staining presented as relative fluorescence intensity (IOD SUM), (Q) Summary graph of CD68 staining at 48 hours post-TBI, presented as relative fluorescence intensity (IOD SUM). For 48 hour analysis (Saline n = 6; Methamphetamine n = 6), for 1 week analysis (Saline n = 5; Methamphetamine n = 4), for 2 week analysis (Saline n = 4; Methamphetamine n = 4), 60× images, * = p < 0.05 compared to uninjured, *** = p < 0.001 compared to uninjured; # compared to 48 hour Saline; scale bar = 40 μm.

Figure 6. TBI causes increased Iba1 and CD68 staining at 1 week after injury within the ipsilateral fimbria.Images show the ipsilateral fimbria labeled with Iba1 (red), CD68 (green) and DAPI (blue). (A) Schematic of a rat brain at Bregma −3.3 with red box marking location of analysis, (B) Uninjured control, (C) Summary graph of Iba1 staining presented as relative fluorescence intensity, (D) Summary graph of CD68 staining presented as relative fluorescence intensity, (E) Saline at 48 hours after TBI, (F) Saline at 1 week after TBI, (G) Saline at 2 weeks after TBI, (H) Methamphetamine at 48 hours after TBI, (I) Methamphetamine at 1 week after TBI, (J) Methamphetamine at 2 weeks after TBI. For 48 hour analysis (Saline n = 6; Methamphetamine n = 6), for 1 week analysis (Saline n = 5; Methamphetamine n = 4), for 2 week analysis (Saline n = 4; Methamphetamine n = 4), ** = p < 0.01 compared to uninjured, *** = p < 0.001; scale bar = 80 μm.
outcomes and significantly reduce inflammatory signals following TBI [18] -[20] [30] .Therefore, we wanted to investigate the potential connection between low-dose methamphetamine and neuroinflammation markers. Here we report that although low-dose methamphetamine significantly impacts microglia/macrophages specifically within the granule cell layer of the dentate gyrus soon after injury (48 hrs), it does not alter the overall temporal and spatial progression of Iba1 and CD68 labeling throughout the brain following TBI.
We found that Iba1+ cells within the hippocampus responded quickly after TBI but subsided by 2 weeks post-TBI. Meanwhile, the periventricular white matter was characterized by a progressively increasing expression of Iba1that began within 1 week after TBI. In contrast to the hippocampus, the cortex, fimbria, periventricular white matter, and the thalamus did not appear affected at 48 hours after TBI but showed a significant response at the later time points. A recent study used the controlled cortical impact model of mild TBI in mice and also found a delayed increase of Iba1-labeling within the thalamus that was associated with worse sleep maintenance [35] . Again, methamphetamine did not influence the general temporal-spatial progression of Iba1 and CD68 expression after severe TBI.
Rod-shapedIba1+ cells were most evident 2 weeks post-severe TBI, which contrasts a previous report of maximal rod cells at 7 days after TBI [17] . Our model delivered a severe TBI via LFPI, while Ziebell et al. [17] used a moderate midline TBI model. The difference in models combined with variations in tissue preparation is a possible explanation for the discrepancy. We show that these rod-shapedIba1+ cells align with axons and appear to associate with dendrites. Furthermore, we show that rod-shapedIba1+ cells do not align or associate with
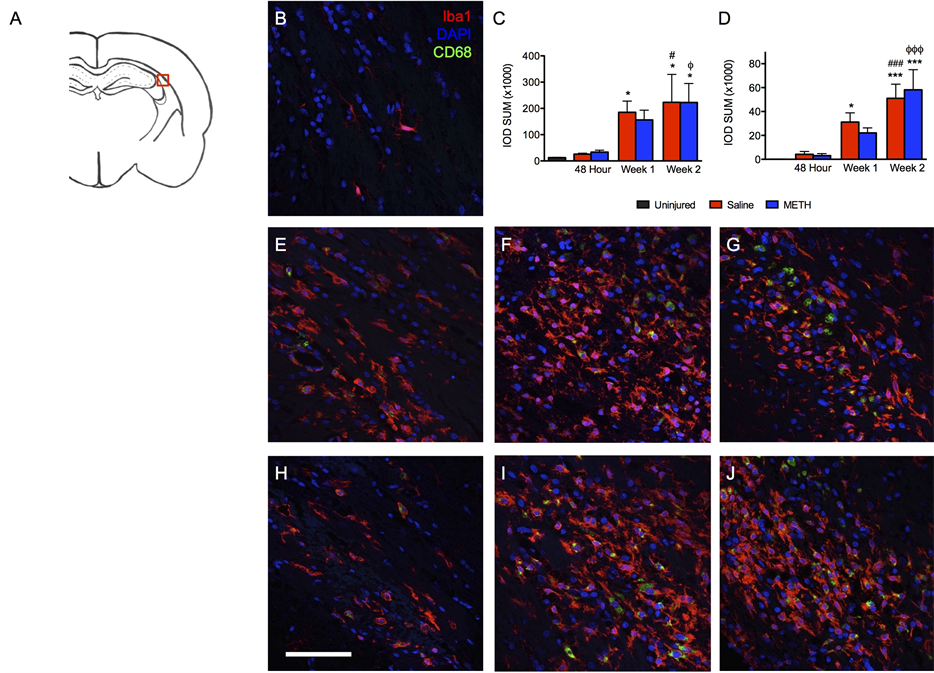
Figure 7. TBI causes a progressive increase Iba1 and CD68 staining within the ipsilateral periventricular white matter. Images show the ipsilateral periventricular white matter proximal to the cortical injury labeled with Iba1 (red), CD68 (green) and DAPI (blue). (A) Schematic of a rat brain at Bregma −3.3 with red box marking location of analysis, (B) Uninjured control, (C) Summary graph of Iba1 staining presented as relative fluorescence intenity, (D) Summary graph of CD68 staining presented as relative fluorescence intensity, (E) Saline at 48 hours after TBI, (F) Saline at 1 week after TBI, (G) Saline at 2 weeks after TBI, (H) Methamphetamine at 48 hours after TBI, (I) Methamphetamine at 1 week after TBI, (J) Methamphetamine at 2 weeks after TBI. For 48 hour analysis (Saline n = 6; Methamphetamine n = 6), for 1 week analysis (Saline n = 5; Methamphetamine n = 4), for 2 week analysis (Saline n = 4; Methamphetamine n = 4), * = p < 0.05 compared to uninjured, *** = p < 0.001; # = p < 0.05 compared to 48 hour Saline, ### = p < 0.001 compared to 48 hour Saline; ϕ = p < 0.05 compared to 48 hour Methamphetamine, ϕϕϕ = p < 0.001 compared to 48 hour Methamphetamine; scale bar = 80 μm.
microvasculature following TBI. We expand on previous studies by showing that some, but not all, rod-shaped- Iba1+ cells are CD68-immunopositive, suggesting phagocytosis. The inconsistent presence of CD68 may indicate rod cells increase phagocytic activity as necessary in order to clear a path of debris for growing axons. MAP2 is required for microtubule assembly and plays a crucial role in neuritogenesis. Combined with the fact that microglia are known to influence dendritic growth [36] , one hypothesis could be that rod-shaped Iba1+ cells guide and promote the growth of damaged neurons post-TBI. Low-dose methamphetamine did not appear to alter rod-shapedIba1+ cells within 2 weeks post-TBI. However since rod microglia are associated with cognitive deficits and methamphetamine has been shown to reduce post-TBI cognitive impairments [19] [20] , it would be interesting to further investigate the connection between rod-shapedIba1+ cells and low-dose methamphetamine at later time points. Altered morphological structure is an attribute of activated microglia, but it offers little insight into the functional role of the cell. Full characterization of rod-shapedIba1+ cell function was out of the scope of this study. However, such studies are necessary in order to better understand how these unique cells are involved with neuropathology or neurorestoration. Along with rod-shapedIba1+ cells, phagocytic (CD68+) and amoeboid Iba1+ cells increased in the cortex at later time points. The increase of Iba1+ cells seen within the cortex could be associated with the recently reported neuroprotective synaptic stripping; further analysis of the functional consequences of the observed neuroinflammation is needed [13] [37] .

Figure 8. Hemorrhages are observed 48 hours after TBI. Images show the ipsilateral periventricular white matter proximal to the cortical injury 48 hours after TBI labeled with Iba1 (red), CD68 (green) and DAPI (blue). (A) Schematic of a rat brain at Bregma −3.3 with red box marking location of analysis, (B) 10× image of autofluorescent RBCs, scale bar = 200 μm, (C) 60× image, scale bar = 20 μm.

Figure 9. TBI causes a delayed increase of Iba1 and CD68 staining within the ipsilaterallaterodorsal thalamus. Images show the ipsilaterallaterodorsal thalamic nuclei labeled with Iba1 (red), CD68 (green) and DAPI (blue). (A) Schematic of a rat brain at Bregma −3.3 with red box marking location of analysis, (B) Uninjured control, (C) Summary graph of Iba1 staining presented as relative fluorescence intensity (IOD SUM), (D) Summary graph of CD68 staining presented as relative fluorescence intensity (IOD SUM), (E) Saline at 48 hours, (F) Saline 1 week after TBI, (G) Saline 2 weeks after TBI, (H) Methamphetamine at 48 hours post-TBI, (I) Methamphetamine one week post-TBI, and (J) Methamphetamine 2 weeks post- TBI. For 48 hour analysis (Saline n = 6; Methamphetamine n = 6), for 1 Week analysis (Saline n = 5; Methamphetamine n = 4), for 2 week analysis (Saline n = 4; Methamphetamine n = 4), ** = p < 0.01 compared to uninjured, *** = p < 0.001 compared to uninjured; scale bar = 80 μm.
Perez-Polo et al. [15] showed that at 6 hours after mild TBI one of the structures most affected by the pro-inflammatory cytokine IL-1β was the ipsilateral hippocampus. We previously demonstrated that treatment with low-dose methamphetamine results in decreased IL-1β expression at 32 hours after severe TBI [20] . Our results showed that Iba1 and CD68 labeling within the ipsilateral hippocampus is most affected at 48 hours post-TBI. Furthermore, our data showed that the dentate gyrus, rather than other hippocampal structures, was most affected and that activation subsides by 1-week post-TBI.
Microglia activation has been linked to neurogenesis within the dentate gyrus post-TBI [36] . However, exactly how microglia may contribute to granule cell neurogenesis remains unclear. We previously reported that methamphetamine treatment increased granule cell neurogenesis following severe TBI [21] . Here we report that treatment with low-dose methamphetamine also causes a unique and transient bilateral increase of Iba1 labeling within the granule cell layer of the dentate gyrus at 48 hours post-TBI. The Iba1+ cells, increased by methamphetamine, within the granule layer may be releasing growth factors (i.e. BDNF) guiding neurogenesis, assisting in pruning or synaptic integration of newborn neurons [36] . Although amoeboid Iba1+ cells are classically associated with phagocytosis, in the context of adult hippocampal neurogenesis ramified microglia are the cells responsible for phagocytizing apoptotic cells [36] . Our results from the dentate granule cell layer show an increased number of ramified microglia rather than amoeboid cells after treatment with methamphetamine (Figure 5). It is plausible this increase of ramified microglia within the granule layer is linked to the increased neurogenesis caused by methamphetamine. Future studies are needed in order to test the connection between methamphetamine’s effect on Iba1+ cells and neurogenesis within the dentate gyrus.
Our data supports a recent finding by Glushakova et al. [38] that Iba1 and CD68 immunoreactive cells increase in white matter tracts, specifically the periventricular white matter, up to 3 months post-TBI, presumably accompanying the expansion of microbleeds reported in their study. In support of this idea, we observed autofluorescent erythrocytes 48 hours after injury within the periventricular white matter at similar locations where the greatest Iba1 labeling was seen at 2 weeks post TBI. Although it remains unclear whether the neuroinflammatory response within the periventricular white matter continues to rise after the 2-week time point, it is reasonable to predict the Iba1+ cells’ response will continue to expand alongside the continued expansion of microbleeds reported by Glushakova et al. [38] . Low-dose methamphetamine does not affect the spread of Iba1 and CD68 immunopositive cells within white matter tracts, specifically within the periventricular white matter and fimbria. Interestingly, white matter tract injury is strongly correlated with worse clinical outcomes and low-dose methamphetamine is shown to improve clinical outcomes post-TBI and yet the drug has no effect within the periventricular white matter or fimbria. In conclusion, acute treatment with low-dose methamphetamine after severe TBI causes a drug-dependent, transient, bilateral increase of Iba1+ cells within the granule cell layer of the dentate gyrus but otherwise does not induce major alterations in the overall temporal-spatial progression of Iba1 and CD68 staining in general throughout the brain.
5. Conclusion
Our results demonstrate that there is a temporal and spatial pattern to the expression of markers observed in activated microglia/macrophage following severe TBI in the rat lateral fluid percussion injury in the rat model. Our results indicate that microglial activation is first observed within the hippocampus (48 hours), which resolves by one-week post injury but progresses to the cortex (by one week) and finally involves the thalamus and periventricular white matter by two weeks post injury. We further demonstrate that rod-shaped microglias are aligned with neuronal processes within the injury core of the cortex at one and two weeks post injury. Finally, we observed a unique increase in microglial activation within the granule cell layer of the dentate gyrus of methamphetamine treated rats at 48 hours post TBI. This correlates with our previous observation that at the same time point post TBI methamphetamine treated rats had a significant increase in granule cell neurogenesis. Thus, we hypothesize that methamphetamine-induces microglia may serve a beneficial function in relation to granule cell neurogenesis.
Support
United States Army Medical Research and Materiel Command Award W81XWH-13-2-0036.
Cite this paper
DebbieSmith,DianeBrooks,EricWohlgehagen,ThomasRau,DavidPoulsen, (2015) Temporal and Spatial Changes in the Pattern of Iba1 and CD68 Staining in the Rat Brain Following Severe Traumatic Brain Injury. Modern Research in Inflammation,04,9-23. doi: 10.4236/mri.2015.42002
References
- 1. Hung, C. and Chen, J.W. (2012) Treatment of Post-Traumatic Epilepsy. Current Treatment Options in Neurology, 14, 293-306. http://dx.doi.org/10.1007/s11940-012-0178-5
- 2. Tiesman, H.M., Konda, S. and Bell, J.L. (2011) The Epidemiology of Fatal Occupational Traumatic Brain Injury in the U.S. American Journal of Preventive Medicine, 41, 61-67.
http://dx.doi.org/10.1016/j.amepre.2011.03.007 - 3. Hernandez-Ontiveros, D.G., Tajiri, N., Acosta, S., et al. (2013) Microglia Activation as a Biomarker for Traumatic Brain Injury. Frontiers in Neurology, 4, 30. http://dx.doi.org/10.3389/fneur.2013.00030
- 4. Mehndiratta, P. and Sajatovic, M. (2013) Treatments for Patients with Comorbid Epilepsy and Depression: A Systematic Literature Review. Epilepsy & Behavior, 28, 36-40.
http://dx.doi.org/10.1016/j.yebeh.2013.03.029 - 5. Xiong, Y., Mahmood, A. and Chopp, M. (2013) Animal Models of Traumatic Brain Injury. Nature Reviews Neuroscience, 14, 128-142. http://dx.doi.org/10.1038/nrn3407
- 6. Loane, D.J. and Byrnes, K.R. (2010) Role of Microglia in Neurotrauma. Neurotherapeutics, 7, 366-377. http://dx.doi.org/10.1016/j.nurt.2010.07.002
- 7. Kumar, A. and Loane, D.J. (2012) Neuroinflammation after Traumatic Brain Injury: Opportunities for Therapeutic Intervention. Brain, Behavior, and Immunity, 26, 1191-1201.
http://dx.doi.org/10.1016/j.bbi.2012.06.008 - 8. Carson, M.J., Doose, J.M., Melchior, B., et al. (2006) CNS Immune Privilege: Hiding in Plain Sight. Immunological Reviews, 213, 48-65. http://dx.doi.org/10.1111/j.1600-065X.2006.00441.x
- 9. Su, P., Zhang, J., Zhao, F., et al. (2014) The Interaction between Microglia and Neural Stem/Precursor Cells. Brain Research Bulletin, 109, 32-38. http://dx.doi.org/10.1016/j.brainresbull.2014.09.005
- 10. Hanisch, U.K. (2013) Functional Diversity of Microglia—How Heterogeneous Are They to Begin with? Frontiers in Cellular Neuroscience, 7, 65. http://dx.doi.org/10.3389/fncel.2013.00065
- 11. Perry, V.H., Nicoll, J.A. and Holmes, C. (2010) Microglia in Neurodegenerative Disease. Nature Reviews Neurology, 6, 193-201. http://dx.doi.org/10.1038/nrneurol.2010.17
- 12. Rizzo, F., Riboldi, G., Salani, S., Nizzardo, M., Simone, C., Corti, S., et al. (2014) Cellular Therapy to Target Neuroinflammation in Amyotrophic Lateral Sclerosis. Cellular and Molecular Life Sciences, 71, 999-1015. http://dx.doi.org/10.1007/s00018-013-1480-4
- 13. Chen, Z., Jalabi, W., Hu, W., Park, H.-J., Gale, J.T., Kidd, G.J., et al. (2014) Microglial Displacement of Inhibitory Synapses Provides Neuroprotection in the Adult Brain. Nature Communications, 5, Article No. 4486. http://dx.doi.org/10.1038/ncomms5486
- 14. Acosta, S.A., Tajiri, N., Shinozuka, K., Ishikawa, H., Sanberg, P.R., Sanchez-Ramos, J., et al. (2014) Combination Therapy of Human Umbilical Cord Blood Cells and Granulocyte Colony Stimulating Factor Reduces Histopathological and Motor Impairments in an Experimental Model of Chronic Traumatic Brain Injury. PLoS ONE, 9, e90953. http://dx.doi.org/10.1371/journal.pone.0090953
- 15. Perez-Polo, J.R., Rea, H.C., Johnson, K.M., Parsley, M.A., Unabia, G.C., Xu, G.J., et al. (2013) Inflammatory Consequences in a Rodent Model of Mild Traumatic Brain Injury. Journal of Neurotrauma, 30, 727-740. http://dx.doi.org/10.1089/neu.2012.2650
- 16. Graeber, M.B. and Mehraein, P. (1994) Microglial Rod Cells. Neuropathology and Applied Neurobiology, 20, 178-180.
- 17. Ziebell, J.M., Taylor, S.E., Cao, T., Harrison, J.L. and Lifshitz, J. (2012) Rod Microglia: Elongation, Alignment, and Coupling to Form Trains across the Somatosensory Cortex after Experimental Diffuse Brain Injury. Journal of Neuroinflammation, 9, 247. http://dx.doi.org/10.1186/1742-2094-9-247
- 18. Ding, G.L., Chopp, M., Poulsen, D.J., Li, L., Qu, C., Li, Q., et al. (2013) MRI of Neuronal Recovery after Low-Dose Methamphetamine Treatment of Traumatic Brain Injury in Rats. PLoS ONE, 8, e61241. http://dx.doi.org/10.1371/journal.pone.0061241
- 19. Rau, T.F., Kothiwal, A.S., Rova, A.R., Brooks, D.M. and Poulsen, D.J. (2012) Treatment with Low-Dose Methamphetamine Improves Behavioral and Cognitive Function after Severe Traumatic Brain Injury. Journal of Trauma and Acute Care Surgery, 73, S165-S172.
http://dx.doi.org/10.1097/ta.0b013e318260896a - 20. Rau, T.F., Kothiwal, A.S., Rova, A.R., Brooks, D.M., Rhoderick, J.F., Poulsen, A.J., et al. (2014) Administration of Low Dose Methamphetamine 12 h after a Severe Traumatic Brain Injury Prevents Neurological Dysfunction and Cognitive Impairment in Rats. Experimental Neurology, 253, 31-40. http://dx.doi.org/10.1016/j.expneurol.2013.12.001
- 21. Rau, T.F., Kothiwal, A., Zhang, L., Ulatowski, S., Jacobson, S., Brooks, D.M., et al. (2011) Low Dose Methamphetamine Mediates Neuroprotection through a PI3K-AKT Pathway. Neuropharmacology, 61, 677-686. http://dx.doi.org/10.1016/j.neuropharm.2011.05.010
- 22. Bauer, J., Sminia, T., Wouterlood, F.G. and Dijkstra, C.D. (1994) Phagocytic Activity of Macrophages and Microglial Cells during the Course of Acute and Chronic Relapsing Experimental Autoimmune Encephalomyelitis. Journal of Neuroscience Research, 38, 365-375.
http://dx.doi.org/10.1002/jnr.490380402 - 23. Chung, R.S., Vickers, J.C., Chuah, M.I. and West, A.K. (2003) Metallothionein-IIA Promotes Initial Neurite Elongation and Postinjury Reactive Neurite Growth and Facilitates Healing after Focal Cortical Brain Injury. Journal of Neuroscience, 23, 3336-3342.
- 24. Hirko, A.C., Dallasen, R., Jomura, S. and Xu, Y. (2008) Modulation of Inflammatory Responses after Global Ischemia by Transplanted Umbilical Cord Matrix Stem Cells. Stem Cells, 26, 2893-2901.
http://dx.doi.org/10.1634/stemcells.2008-0075 - 25. Sternberger, N.H. and Sternberger, L.A. (1987) Blood-Brain Barrier Protein Recognized by Monoclonal Antibody. Proceedings of the National Academy of Sciences of the United States of America, 84, 8169-8173. http://dx.doi.org/10.1073/pnas.84.22.8169
- 26. Trifilieff, P., Feng, B., Urizar, E., Winiger, V., Ward, R.D., Taylor, K.M., et al. (2013) Increasing Dopamine D2 Receptor Expression in the Adult Nucleus Accumbens Enhances Motivation. Molecular Psychiatry, 18, 1025-1033. http://dx.doi.org/10.1038/mp.2013.57
- 27. Donnelly, D.J., Gensel, J.C., Ankeny, D.P., van Rooijen, N. and Popovich, P.G. (2009) An Efficient and Reproducible Method for Quantifying Macrophages in Different Experimental Models of Central Nervous System Pathology. Journal of Neuroscience Methods, 181, 36-44.
http://dx.doi.org/10.1016/j.jneumeth.2009.04.010 - 28. Taylor, S.E., Morganti-Kossmann, C., Lifshitz, J. and Ziebell, J.M. (2014) Rod Microglia: A Morphological Definition. PLoS ONE, 9, e97096. http://dx.doi.org/10.1371/journal.pone.0097096
- 29. Walker, K.R. and Tesco, G. (2013) Molecular Mechanisms of Cognitive Dysfunction Following Traumatic Brain Injury. Frontiers in Aging Neuroscience, 5, 29. http://dx.doi.org/10.3389/fnagi.2013.00029
- 30. Thomas, D.M., Walker, P.D., Benjamins, J.A., Geddes, T.J. and Kuhn, D.M. (2004) Methamphetamine Neurotoxicity in Dopamine Nerve Endings of the Striatum Is Associated with Microglial Activation. Journal of Pharmacology and Experimental Therapeutics, 311, 1-7. http://dx.doi.org/10.1124/jpet.104.070961
- 31. Adnan, A., Crawley, A., Mikulis, D., Moscovitch, M., Colella, B. and Green, R. (2013) Moderate-Severe Traumatic Brain Injury Causes Delayed Loss of White Matter Integrity: Evidence of Fornix Deterioration in the Chronic Stage of Injury. Brain Injury, 27, 1415-1422.
http://dx.doi.org/10.3109/02699052.2013.823659 - 32. Kou, Z. and VandeVord, P.J. (2014) Traumatic White Matter Injury and Glial Activation: From Basic Science to Clinics. Glia, 62, 1831-1855. http://dx.doi.org/10.1002/glia.22690
- 33. Wang, G., Zhang, J., Hu, X., Zhang, L., Mao, L., Jiang, X., et al. (2013) Microglia/Macrophage Polarization Dynamics in White Matter after Traumatic Brain Injury. Journal of Cerebral Blood Flow & Metabolism, 33, 1864-1874. http://dx.doi.org/10.1038/jcbfm.2013.146
- 34. Wang, T., Huang, X.J., Van, K.C., Went, G.T., Nguyen, J.T. and Lyeth, B.G. (2014) Amantadine Improves Cognitive Outcome and Increases Neuronal Survival after Fluid Percussion Traumatic Brain Injury in Rats. Journal of Neurotrauma, 31, 370-377. http://dx.doi.org/10.1089/neu.2013.2917
- 35. Hazra, A., Macolino, C., Elliott, M.B. and Chin, J. (2014) Delayed Thalamic Astrocytosis and Disrupted Sleep-Wake Patterns in a Preclinical Model of Traumatic Brain Injury. Journal of Neuroscience Research, 92, 1434-1445. http://dx.doi.org/10.1002/jnr.23430
- 36. Gemma, C. and Bachstetter, A.D. (2013) The Role of Microglia in Adult Hippocampal Neurogenesis. Frontiers in Cellular Neuroscience, 7, 229. http://dx.doi.org/10.3389/fncel.2013.00229
- 37. Kettenmann, H., Kirchhoff, F. and Verkhratsky, A. (2013) Microglia: New Roles for the Synaptic Stripper. Neuron, 77, 10-18. http://dx.doi.org/10.1016/j.neuron.2012.12.023
- 38. Glushakova, O.Y., Johnson, D. and Hayes, R.L. (2014) Delayed Increases in Microvascular Pathology after Experimental Traumatic Brain Injury Are Associated with Prolonged Inflammation, Blood-Brain Barrier Disruption, and Progressive White Matter Damage. Journal of Neurotrauma, 31, 1180-1193.
http://dx.doi.org/10.1089/neu.2013.3080
NOTES

*Corresponding author.