Advances in Remote Sensing
Vol. 1 No. 3 (2012) , Article ID: 26101 , 5 pages DOI:10.4236/ars.2012.13005
BG3 Glass Filter Effects on Quantifying Rapidly Pulsating Auroral Structures
1Department of Space Science and Engineering, Southwest Research Institute, San Antonio, USA
2Geophysical Institute/University of Alaska, Fairbanks, USA
Email: msamara@swri.edu
Received October 10, 2012; revised November 22, 2012; accepted December 2, 2012
Keywords: Aurora; Imaging; BG3 Filters; Pulsating Aurora
ABSTRACT
The extensive use of Schott BG3 glass filters in auroral physics demands an accurate characterization of the filter performance when observing actual auroral structures. We present observations from two identical Andor DU-888 imagers operated side-by-side, one equipped with a BG3 glass filter and the other one unfiltered, observing the same auroral structures. The BG3 glass filter decreased the overall signal levels, increasing the relative intensity variations of the fast pulsating aurora by a few percent. This, however, also produced a slightly decreased signal-to-noise ratio, making it more difficult to quantify the rapidly varying auroral structures. This comparison shows that BG3 glass filters can be useful in reducing the overall signal levels which is important in dynamic, bright, substorm onset aurora, where EMCCD imager saturation has been known to occur. Consequently their use does not significantly affect the observation of the dynamics within the aurora but it also does not enhance the ability to quantify the features of rapidly varying auroral structures.
1. Introduction
BG3 glass is often used in auroral imaging in order to filter out the bright, yet slow emissions, enabling the fainter prompt emissions to be imaged [1,2]. This has long been believed to significantly enhance the ability to image rapidly varying auroral structures. The two main auroral emission lines that typically dominate the signal detected by an unfiltered imager are 557.7 nm and 630.0 nm [3]. These result from electronic transitions of the atomic oxygen from the 1S to the 1D state and from the 1D to the 3P state [4] with fairly long radiative lifetimes of 0.74 s and 110 s, respectively [3]. These long lifetimes are thought to result in spatio-temporal smearing of the rapidly varying auroral structures, such that the observable emissions do not correspond one-to-one with the electron precipitation structures causing them.
The Schott BG3 glass filter is a notch filter with a transmission curve such that it removes both the 557.7 nm and the 630.0 nm emissions, yet passes the prompt (microsecond to nanosecond lifetimes) blue and nearinfrared emission lines of N2 and . Therefore BG3 glass filters are used with low-light-level imagers such that the rapidly moving and time-varying auroral structures may correspond one-to-one with the electron precipitation responsible for exciting them. BG3 glass has two main passbands, one from ~250 nm to ~500 nm and another from ~700 nm to ~1100 nm. The detailed transmission curve of BG3 glass along with actual transmittance values for specific wavelengths can be found in the BG3 glass technical description [5].
Although this imaging scheme fits together nicely in theory, it has yet to be rigorously tested on auroral structures. This is partly due to the need for running two identical imagers simultaneously, side-by-side, observing the same aurora. Additionally, there are many types of auroral structures which can show rapid motion or temporal variations and each is caused by different precipitating electron spectra. This article presents the results of such a side-by-side comparison of rapidly varying pulsating auroral structures imaged both unfiltered and through a BG3 glass filter.
2. Observations
The auroral event examined here was observed on 08 March 2009 from Poker Flat, Alaska. Two Andor Electron Multiplying CCD (EMCCD) imagers were used for these observations. One imager is part of the AMISR suite of instruments at Poker Flat and is operated by the University of Alaska, Fairbanks, while the other was on loan from Andor. Both imagers were the Andor DU-888 model which has a 1024 × 1024 chip, with internal binning capabilities that allow tradeoffs between temporal and spatial resolution. Each was equipped with a 50 mm Cannon f/0.95 lens to provide a narrow field of view (15 deg. × 15 deg.). The two imagers were mounted side-by-side on the same mount and were operated independently. The data acquisition mode used resulted in many individual series of 1000 images, each covering approximately 30 seconds. The fields of view of the two imagers were not exactly aligned, so a sub-array of approximately 200 × 200 pixels was extracted where the data from each imager overlapped. A time series of 27 seconds was chosen where data were recorded with both imagers simultaneously.
For these observations, the CCDs were cooled to −70 deg. C to reduce thermal noise and were set to 4 × 4 binning, resulting in a 256 × 256 pixel image at 33.58 frames per second. This configuration was chosen because it provides adequate temporal resolution (16 Hz) for fast pulsating aurora while maintaining a reasonable spatial resolution of 0.058 degrees per pixel or approximately 100 meters per pixel at 100 km altitude.
Figure 1 shows two example images, recorded simultaneously, with a relative timing error of less than 33 ms. The left image was recorded with no filter, while the right image was recorded using a BG3 filter. The dark lines denote the location of the intensity cuts used to make the keograms. The images are oriented with North (Geomagnetic) at the top and East to the left. Assuming 100 km altitude for the aurora, the 15 deg. × 15 deg. FOV of the imager corresponds to a spatial scale of approximately 25 by 25 km.
Figure 2 presents the keograms extracted from both image sequences. The top row is from the imager with the BG3 filter, where the North-South cut is on the left and the East-West cut is on the right. Similarly, the bottom row is from the unfiltered imager. The distinct horizontal stripes are artifacts caused by stars but their location serves to verify that the cuts were taken at the same physical location in both sets of images. These data cover 25 km and span a period of 27 seconds.
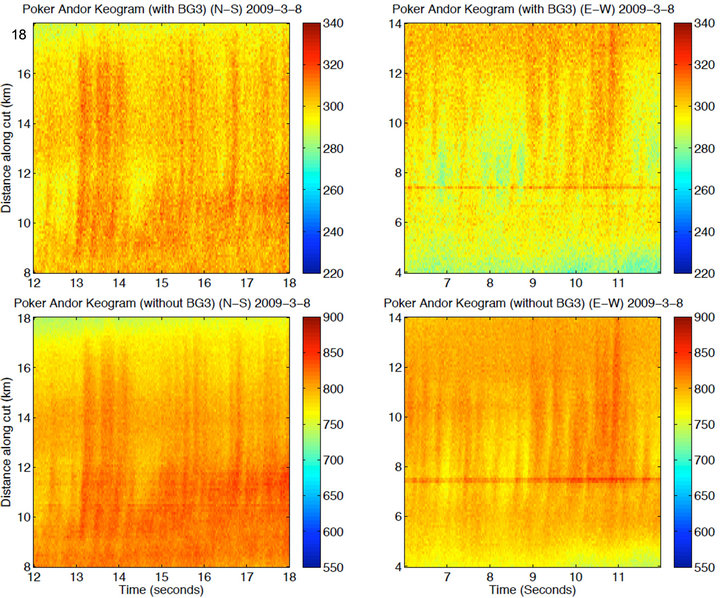
The small-scale, rapid pulsations are shown in Figure 3 which is a zoom in on the data presented in Figure 2. Here the data cover 10 km and span only 6 seconds, clearly showing the pulsating auroral structures with frequencies of 3 to 5 Hz, time scales much faster than the 0.74 s radiative lifetime of the dominant 557.7 nm emission line.
In order to quantify the level of variation for each case, Figure 4 shows the intensity profiles extracted from each keogram in Figure 3. They are presented in the same layout as Figures 2 and 3 and are the sum of five rows of pixels in the center of each keogram, at 13 km in the N-S direction and at 9 km in the E-W direction.
3. Discussion
The data presented above do not support a clear case in favor of using BG3 glass to image fast pulsating aurora, instead suggesting that it may be more difficult to identify the rapid pulsating structures in the images as seen in Figure 1. Many other examples were examined from the same night and the scale of the display was varied in order to maximize the appearance of the auroral features in both the images. The images shown in Figure 1 are representative of the results from this analysis.
Similarly, the keograms in Figures 2 and 3 are consistent with the results of this analysis. These were chosen
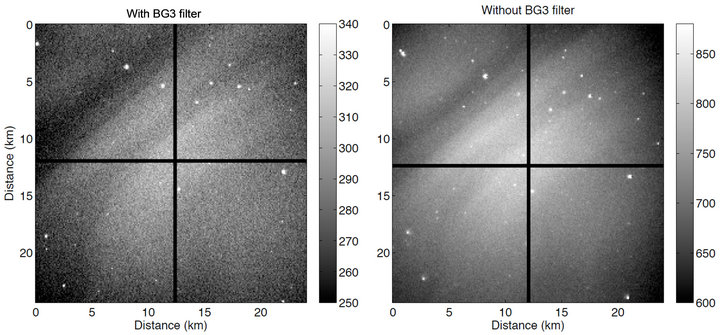
Figure 1. Simultaneous images from both imagers. Left: with BG3 glass filter. Right: without BG3 filter. The dark lines denote the locations of the intensity cuts used to make the keograms.
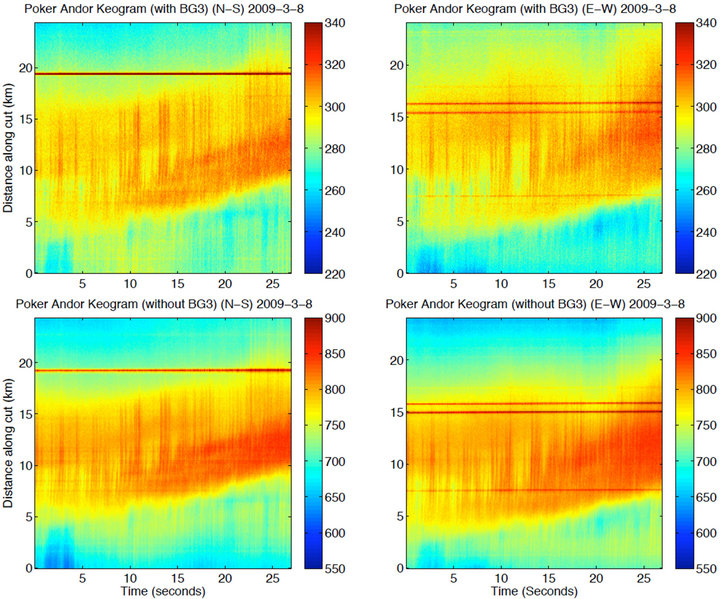
Figure 2. Keograms constructed from the image data along both the N-S (left column) and E-W (right column) directions. Top row: data filtered with BG3 glass; Bottom row: unfiltered imager data. These data were extracted at the same time and spatial location in each data set.
because they clearly show the temporal development of the rapidly varying (up to 5 Hz) auroral structures. Here the structure is also more clearly visible in the unfiltered images than it is with the BG3 glass filter. From these data, the actual intensity levels can be quantified, although they are only in detector counts as imaging in broadband or white light cannot be calibrated to actual brightness (Rayleigh) levels.
One assumption made in this analysis is that the two imagers (same make and model) have a comparable response. Even if the imagers had significant differences in their gains, the main results of this study would not change. For example, if one imager had a higher gain, then it's intensity levels would need to be decreased to be compared to the other imager. In this case the percentage intensity difference would not change because all the intensity levels would need to be shifted down, including both the background level and the level of the pulsations. The signal-to-noise ratio also would not change because a higher gain would amplify both the signal and the noise.
The intensity cuts presented in Figure 4 show that the relative intensity variations are only a few percent larger in the case with the BG3, although the relative noise levels are also higher. For example the largest variation in the N-S data, occurring near 13 s, represents a 3.9% variation in the case with the BG3 filter, while in the unfiltered case it represents a 3.4% variation. For the E-W case the difference is larger, for the large variation occurring near 9 s, with a 7.1% variation in the case with the BG3 filter and a 5.0% variation without the filter. The high frequency (5 Hz) variations seen between 15 and 16 seconds in the N-S case are clearly seen in the unfiltered image data, but become lost in the noise using the BG3 glass filter.
The total intensity level is a factor of 2.6 larger in the unfiltered case, which actually has a larger signal to noise ratio. This shows that BG3 filters reduce the overall intensity without significantly altering the structures within the aurora. This effect can be used to prevent saturation of sensitive detectors such as electron multiplying and intensified CCD imagers in situations of very intense and dynamic aurora.
If the rapid auroral variations were masked by a less-structured background of 557.7 nm and 630.0 nm emissions, it would be expected that the BG3 filter would produce significantly larger relative intensity variations than an unfiltered imager. These data are inconsistent with this idea because the BG3 filter produced larger relative intensity variations by only a few percent. One
possible explanation for this is that pulsating aurora is believed to be caused by high energy electrons [6,7] which deposit their energy at low altitudes where the excited O 1S state will be either rapidly quenched collisionally or emit a photon so that the 557.7 nm emissions that are observed are essentially prompt, occurring simultaneous to the electron precipitation. However, recent observations with the Reimei satellite [8] found pulsating auroral structures to be associated with 8 to 12 keV precipitating electrons. These would deposit their energy around 120 km altitude [9], where the collision frequency is still low enough that an excited O 1S atom can stay in the excited state for the radiative lifetime of 0.74 s.
Removing the two most dominant emission lines (557.7 nm and 630.0 nm) produced a significant reducetion in total intensity although not as much as was expected. However, the transmittance of BG3 glass at 557.7 nm is finite. For 1 mm thickness it is listed as between 6 × 10⁻⁴ and 2 × 10⁻³ and for 630.0 nm it is <1 × 10⁻⁵ [5]. This level of transmittance, coupled with the high quantum efficiency CCDs in the 500 nm to 600 nm range could result in significant signal levels from the 557.7 nm emission line through a BG3 glass filter. However, this study used a 3 mm thick filter, and therefore no significant signal could have made it though the filter.
4. Conclusion
There is no strong case for the original intent of using BG3 filters to enhance the detectability of rapidly varying auroral structures. The results of this study show that the BG3 glass filter was not effective at significantly increasing the detection of rapidly pulsating (3 to 5 Hz) auroral structures. The BG3 glass filter produced a few percent increase in the relative intensity variations, 0.5% in the N-S case and 2.1% in the E-W case. However the reduced overall signal level with the BG3 filter produced a lower signal-to-noise ratio. Aside from preventing saturation, the net effect of using the BG3 glass filter was to actually decrease the ability to quantify the rapidly varying pulsating auroral structures from the images.
BG3 filters can therefore be useful in reducing the total intensity of the aurora in order to prevent saturation of sensitive detectors like electron-multiplying or intensified CCD imagers, during the brightest, most dynamic aurora such as substorm onset and polar cap boundary intensifications. The dynamics of the aurora do not ap-
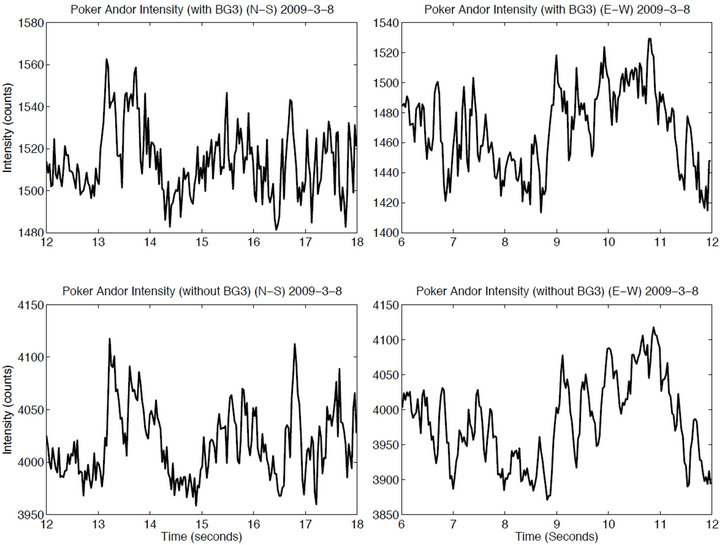
Figure 4. Intensity cuts taken through the center of each image in Figure 3. Each cut is a sum of 5 rows of pixels to reduce noise.
pear to be significantly altered by the use of BG3 filters, so their use is then a tradeoff between accurately detecting the brightest aurora without saturating and accurately measuring the intensity variations within the fainter auroral structures.
5. Acknowledgements
This work was supported by National Science Foundation Grant # ATM-0836410. The authors would like to thank John Alford of Andor Technology for sending them a loaner DU-888 EMCCD imager for this campaign
REFERENCES
- M. Samara and R. G. Michell, “Ground-Based Observations of Diffuse Auroral Frequencies in the Context of Whistler Mode Chorus,” Journal of Geophysical Research, Vol. 115, 2010, Article ID: A00F18. doi:10.1029/2009JA014852
- J. Semeter, M. Zettergren, M. Diaz and S. Mende, “Wave Dispersion and the Discrete Aurora: New Constraints Derived from High-Speed Imagery,” Journal of Geophysical Research, Vol. 113, 2008, Article ID: A12208. doi:10.1029/2008JA013122
- A. Vallance Jones, “Auror,” Reidel Publishing Company, Dordrecht, 1974. doi:10.1007/978-94-010-2099-2
- F. E. Roach and L. L. Smith, “The Worldwide Morphology of the Atomic Oxygen Nightglows,” Aurora and Airglow, Staffordshire, 15-26 August 1966, p. 29.
- A. G. Schott, “BG3 Transmission Curve and Data,” Advanced Optics, Hellertown, 1997.
- D. J. McEwan, E. Yee, B. A. Whalen and A. W. Yau, “Electron Energy Measurements in Pulsating Aurora,” Canadian Journal of Physics, Vol. 59, No. 8, 1981, pp. 1106- 1115. doi:10.1139/p81-146
- M. J. Smith, D. A. Bryant and T. Edwards, “Pulsations in Auroral Electrons and Positive Ions,” Journal of Atmospheric and Terrestrial Physics, Vol. 42, No. 2, 1980, pp. 167-178. doi:10.1016/0021-9169(80)90077-X
- M. Samara, R. G. Michell, K. Asamura, M. Hirahara, D. L. Hampton, and H. C. Stenbaek-Nielsen, “Ground-Based Observations of Diffuse Auroral Structures in Conjunction with Reimei Measurements,” Annales Geophysicae, Vol. 28, No. 3, 2010, pp. 873-881. doi:10.5194/angeo-28-873-2010
- G. Paschmann, S. Haaland and R. Treumann, “Auroral Plasma Physics,” Kluwer Academic Publishers, Dordrecht, 2003. doi:10.1007/978-94-007-1086-3