Advances in Remote Sensing
Vol. 1 No. 1 (2012) , Article ID: 19640 , 13 pages DOI:10.4236/ars.2012.11001
Satellite Derived Geospatial Irrigation Performance Indicators for Benchmarking Studies of Irrigation Systems
National Remote Sensing Centre (NRSC), Department of Space, Government of India, Hyderabad, India
Email: avsureshbabuisro@gmail.com, {shanker_m, vvrao}@nrsc.gov.in
Received April 15, 2012; revised May 20, 2012; accepted June 5, 2012
Keywords: Irrigation; Agriculture; Benchmarking of Irrigation Systems; Geospatial Techniques; Remote Sensing; GIS
ABSTRACT
Development of irrigation infrastructure and its efficient management is the primary concern for sustainable food production. The assessment of irrigation infrastructure creation, its utilization, diagnostic evaluation of the various performance indices (monitoring) are important to measure the efficiency. Benchmarking of Irrigation Systems (BIS) is for the diagnostic analysis of irrigation performance indicators comprising of Irrigation Infrastructure System (IIS), Agricultural System (AS), Water Delivery Dynamics (WDD). Since, the performance of an irrigation command varies with space and time, utilization of spatial information technologies viz. Remote Sensing (RS), Geographical Information Systems (GIS), Global Positioning Systems (GPS) useful to provide spatial information on several indices in the process of benchmarking (BM). Information requirements for BIS at different stages, utilization of spatial information technologies to derive irrigation performance indicators was discussed with suitable examples and demonstrated in this study. The studies carried out indicates that the geospatial approach for BIS enabled the improvements in data collection methods, diagnostic analysis, spatio-temporal visualisation of BM indicators at disaggregated canal level which would be useful for decision support during the corrective management measures. The conjunctive use of multi-date (medium resolution) satellite data, high spatial resolution data, field data on water deliveries was found to be an alternative to the conventional non-spatial approaches for BIS and thereby better water resources planning and management.
1. Introduction
Benchmarking (BM) of irrigation system is a process of performance evaluation using a set of defined indicators to determine the performance of various components of irrigation system namely Irrigation Infrastructure (IIS), Agricultural System (AS) and Water Delivery Dynamics (WDD). Conventional methods of collection of information on these systems are mostly non spatial in nature and are based on point information or eye estimates which appears to be a gap in information retrieval and processing mechanism. Further, updation of any spatial data through conventional field surveys are time consuming methods. Hence, requires an alternative mechanism to collect, process, organize and update the information pertaining to irrigation command to supplement the information requirements for BM studies. The study was focused to identify the list of benchmarking indices used for irrigation performance evaluation, methods for utilization of spatial information technologies to derive these BM indices that could be generated through geospatial approach.
2. Review
Traditionally, irrigation performance was expressed in terms of irrigation efficiency as a function of water deliveries (discharge from measurement device) which may often mislead the planners. Researchers have demonstrated the use of satellite remote sensing derived information in conjunction with canal flows data [1-3] for the evaluation of irrigation command. Evaluation was carried out in an irrigation water management scheme [4] in terms of water supply requirement ratios and other indices such as irrigation intensity, crop productivity and cropping pattern and compared with the historic values. An extensive review was conducted on satellite derived parameters for irrigation command studies [5-8] and the advantages and limitations were theoretically summarized. Indian National Committee on Irrigation Drainage (INCID), Government of India has published the list of various performance indices [9], related to agricultural crop production, water delivery system, economic performance etc and possible adaptation for benchmarking studies of any irrigation system [10]. Multi-date satellite data were analyzed to provide spatially information on irrigated area, cropping pattern, paddy yield to evaluate the performance of the agricultural system over several years and across the irrigation scheme [2,11-14]. Rice crop yield was estimated using satellite data [15]. Multitemporal remote sensing data-based crop inventory, vegetation spectral index profiles and crop evapotranspiration estimation were carried out over the Mahi Right Bank Canal data analyze the performance with respect to irrigation management [16]. Present practices and performance improvement of irrigation schemes in Maharashtra state of India was described in detail with field experiences [17]. Studies were conducted on the assessment of crop, water productivity and their dynamics across the span of 10 years in an irrigation system with multi-temporal datasets [18-22].
Overall review of literature indicated that the satellite data was used in isolation for deriving the various parameters required for the irrigation performance evaluation and rarely, unified approach was defined for the utilization of these technologies for benchmarking of irrigation systems (BIS). This paper describes about the concepts, methods implementation of geospatial approach for deriving BM indicators for BIS.
3. Information Requirements for BM
Bench marking studies requires several non spatial and spatial datasets to evaluate the performance of different components of irrigation system. The information needs for benchmarking of irrigation systems were also envisaged by International Commission on Irrigation & Drainage [23] which are basically divided into categories pertaining to cropping pattern (agricultural), water distribution, economical and socio-economic indicators (Table 1). Parameters shows that they are spatiotemporal in nature and mostly dependant on cropping pattern, water deliveries and socio-economic data. Hence, the focus needs to be put on the retrieval of spatio-temporal parameters pertaining to irrigation system. Utilisation of spatial information technologies for periodic retrieval of these parameters was discussed and demonstrated in this study.
4. Geospatial Approach for Benchmarking of Irrigation Systems
The study was taken up for the demonstration of geospatial approach in BM studies, the available field data, satellite data collected over different irrigation commands of India during research work was made use. The geospatial approach suggested for BIS was shown in Figure 1.
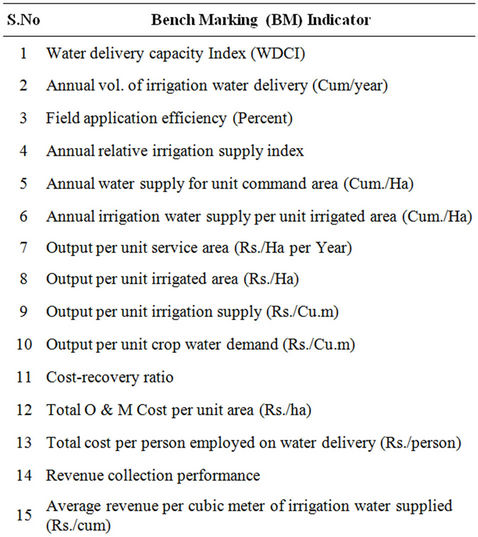
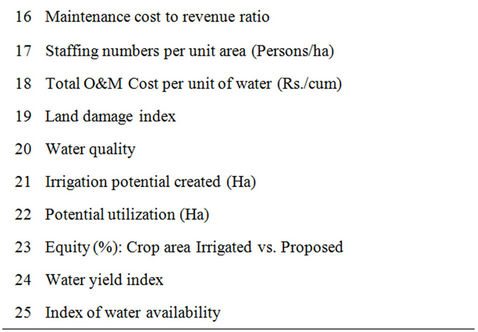
Table 1. List of benchmarking indicators for evaluating irrigation system.
4.1. Irrigation Infrastructure System (IIS)
Irrigation infrastructure system refers to the infrastructure for delivering water from source through conveyance and distribution system, i.e. canal network ensuring the hydraulic connectivity. Irrigation potential (IP) is defined as the area that can be irrigated/commanded by a canal. The objective of BM of IIS is to evaluate whether designed canal lengths were completed at the defined off take points (chianages) as per the plan/design, checking of hydraulic connectivity, from source to tail end. If lengths, chainages are met with designed values, then, it is said to be irrigation potential created under a canal. Use of satellite data and geospatial approach was found to be very much useful with the help of high resolution satellite data which is demonstrated here alongwith the methodology (Figure 2), image interpretation elements/keys (Figure 3),
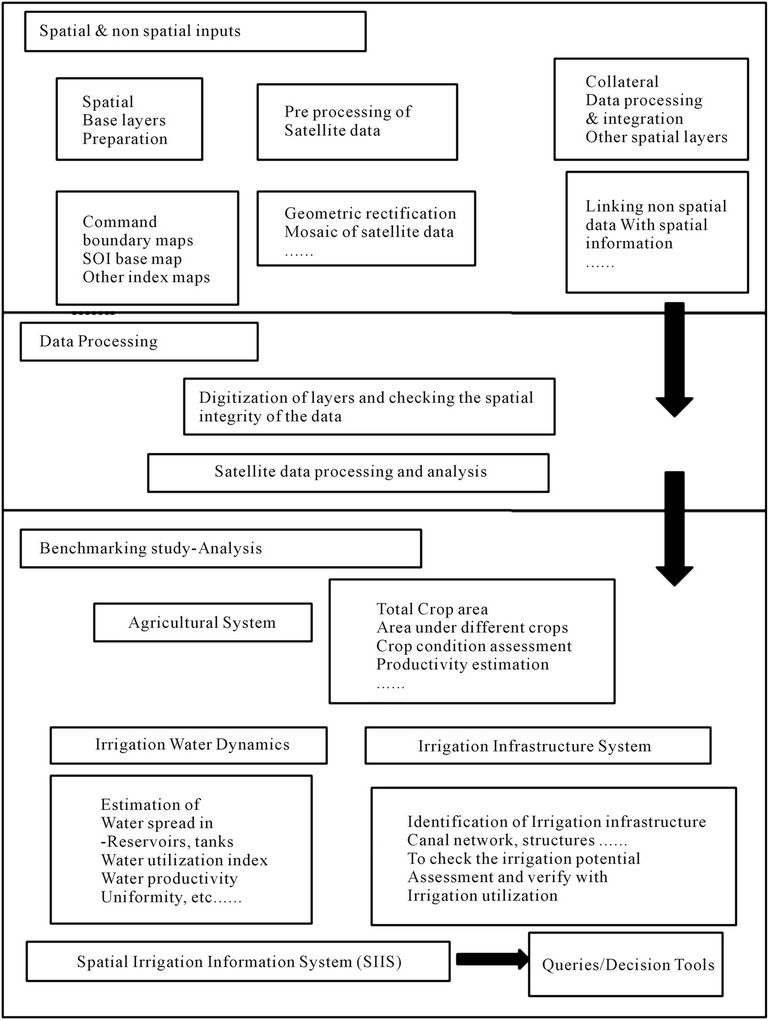
Figure 1. Geospatial approach for benchmarking of irrigation systems.
assessment of irrigation potential creation (Figure 4) with suitable examples .
Example: If a canal with length of 5.0 Km is planned to create irrigation potential of 1000 ha (as per detailed project surveys), it is verified with the acquisition of high resolution satellite data from IKONOS/Cartosat/Quick bird (with spatial resolutions 1 - 2.5 m) and delineated canal by displaying the image in 1:5000 scale and lengths and chainages were measured. The process is repeated for all the canals. If there are critical gaps such as pending cross drainage structures, pending canal stretches in along the canal due to land acquisition issues or pending road/rail crossings, pending tail portion works, etc. can be quantified during the process and the irrigation potential created is estimated accordingly. The methodology of quantifying the irrigation potential creation from the satellite derived lengths and of canals and status of hydraulic connectivity is shown through the illustration (Figure 4). An example was shown in Figure 5 depicting the delineation of canal network from high resolution satellite data, critical gap causing the gap in irrigation potential though the canal network completed and pending
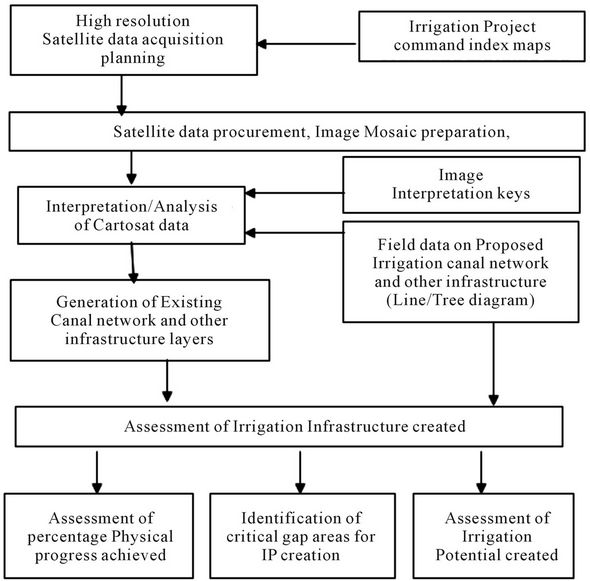
Figure 2. Methodology for the assessment of irrigation potential from high resolution satellite data.
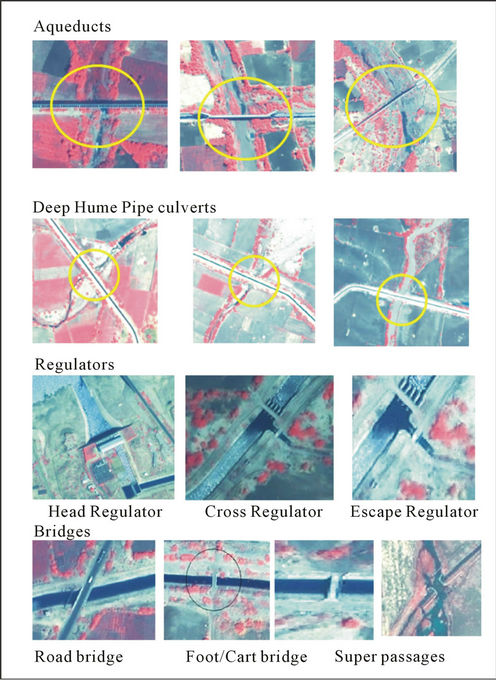
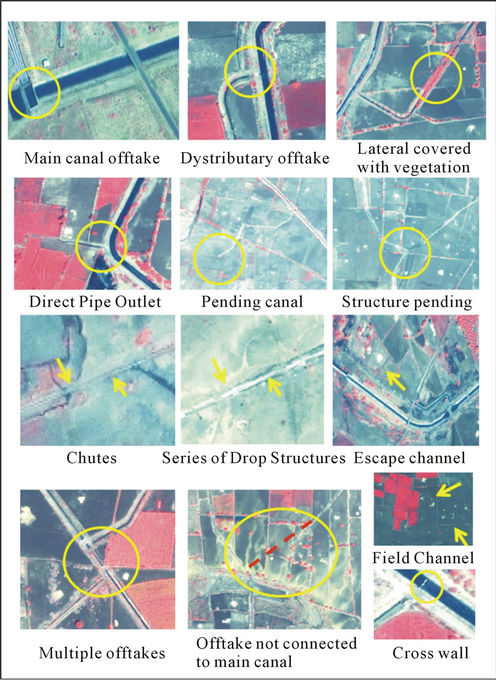
Figure 3. Irrigation infrastructure elements.
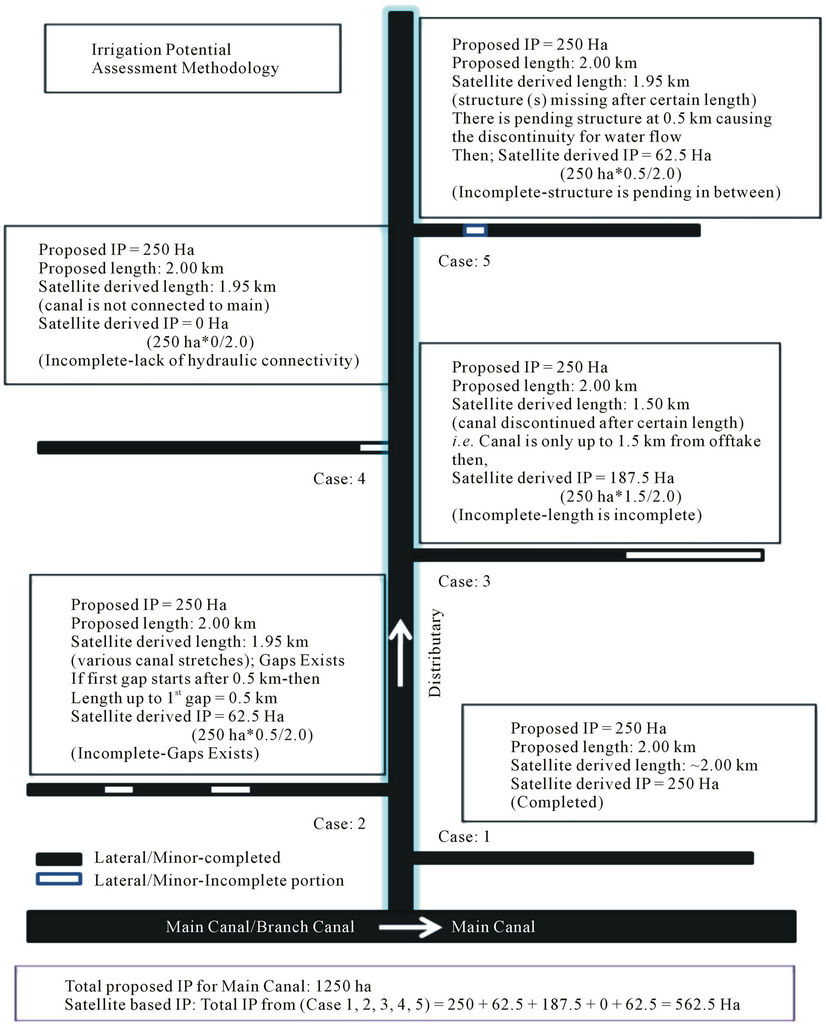
Figure 4. Illustration depicting the quantification of irrigation potential created in irrigation projects from irrigation infrastructure information.
hydraulic connectivity to a larger length of canal system
4.2. Agricultural System
Benchmarking indicators (Table 1) for performance assessment of an agricultural system deals with total crop area, cropping pattern, crop condition and crop production, crop deviations and socio-economic parameters. Many of these parameters require spatio-temporal information for its quantitative assessment which were generally obtained using statistical methods or eye estimates. Hence, satellite based technologies should be used for deriving performance indicators in spatial domain for benchmarking the agriculture system. Presently, satellite data of varying spatial, spectral and temporal resolutions are available. In general, data from medium spatial resolutions satellites are optimal for this purpose such as IRS LISS III, Landsat TM/ETM+, etc. The spatial information at disaggregated level (irrigation distributary/block/ zone/project) can be generated and used for identification
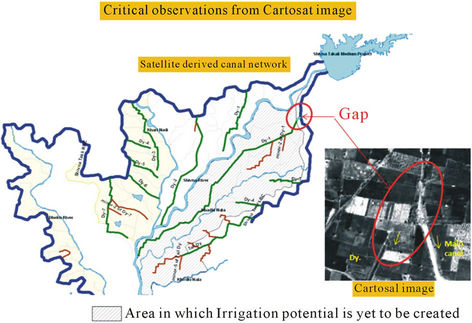
Figure 5. Assessment of irrigation potential in an irrigation command based high resolution satellite derived irrigation infrastructure.
of poor performing pockets within the command area.
4.2.1. Estimation of Crop Area & Cropping Pattern
Every irrigation system will have a designed cropping pattern and accordingly water deliveries are let into the system. Cropping pattern in an irrigation command determines the irrigation needs and hence the inventory of crop areas is useful to know whether the irrigation system is optimally used or not. Cropping pattern was derived from multi-date satellite data acquired during the cropping season. The concept was demonstrated through a study conducted at NRSC on the performance evaluation of Nagarjunasagar Left Canal command (NSLC), Andhra Pradesh, India which was in construction phase since 1980 s and reached its development stage in 1990- 91 and has reached optimal utilisation phase in 1998-99. This case study was carefully selected to demonstrate the utilisation of remote sensing techniques to quantify various crop parameters from historic data sets in developmental phase of an irrigation project. Multi-date satellite data (IRS 1C/1D LISS III for the year 1998-99 and IRS 1A/1B LISS II and Landsat TM for the year 1990-91) during the rabi season of the years 1990-91 and 1998-99 were selected, taking into consideration crop calendar (Figure 6) of major crops and availability of cloud free satellite data. The satellite data acquired were: 1998-99 Crop year : Dec (5th, 16th), Feb (18th, 21st), Mar (27th, 18th), Apr (15th, 19th), May (4th, 7th ) from IRS-1C/1D satellites and 1990-91: Dec (5th, 16th ), Jan (13th, 20st), Feb (14th, 22th), Mar(18th, 25th), Apr (10th, 19th) from IRS-1B/1C satellites.
Hierarchical crop classification methods were adopted for discrimination of different crops. The aim was to separate paddy, cotton, chillies, orchards, sugarcane and other irrigated dry (ID) crops. Crop area mask was derived (using Normalized Difference Vegetation Index (NDVI) for each image. Points kept in view for classification based on the crop calendar were 1) Orchards/sugarcane are present in all images (through the season) as they are perennial/annual crops 2) During December, 1998 rabi paddy grown area was mostly either fallow or at field preparation stage, two seasonal crops are standing, rabi ID crops were at the initial vegetative stage 3) During February and March paddy was in peak stage and spectrally distinguishable from other crops. A ID crop
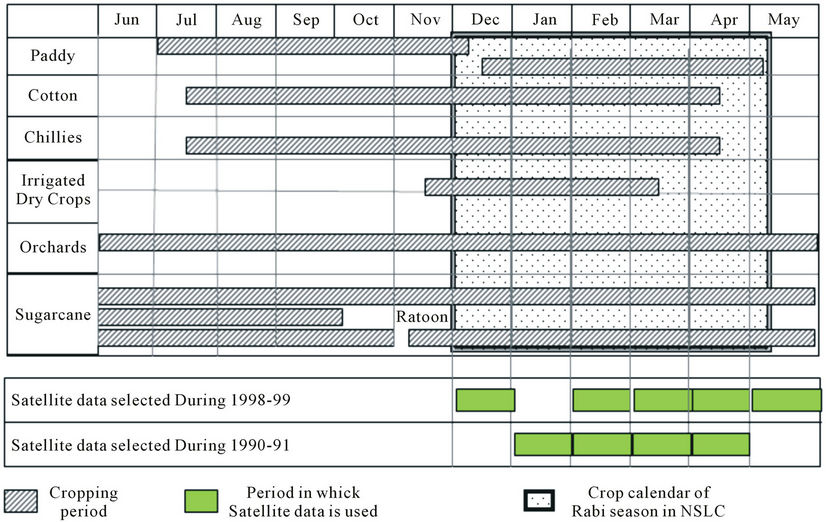
Figure 6. Crop calendar used for the selection of satellite images.
mask was identified using December image.
The satellite derived cropping pattern and the changes that took place within span of 10 years was estimated and shown in Figure 7. There was shift in cropping pattern from 1990-91 to 1998-99. Rice area was increased drastically from 17.94% to 55.98% accordingly, there was shift from ID crops to rice crop.
4.2.2. Quantitative Estimations on Crop Deviations
All canals are generally defined with specific cropping pattern depending availability of water in different seasons at the time initiation of the project. If the cropping pattern was deviated, the design water deliveries do not meet actual water requirement of the crops and hence, it leads to imbalance in irrigation water management. The geospatial approach suggested here with satellite derived cropping patterns at each of the canal level, and aggregated figures helped to identify crop deviations in the irrigation command (Figure 8). The crop variations could be because of replacement ID crops with paddy due to increased water availability in 1998-99 compared
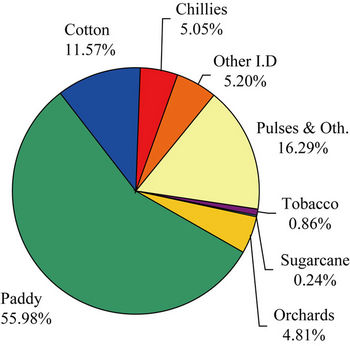 1998-99
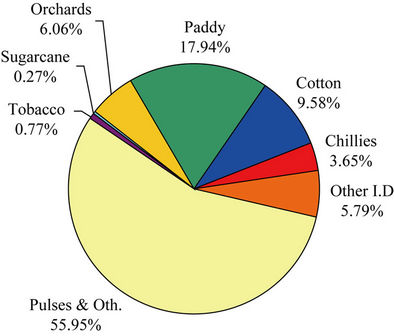 1990-91
Figure 7. Satellite derived cropping pattern in NSLC during 1990-91 and 1998-99.
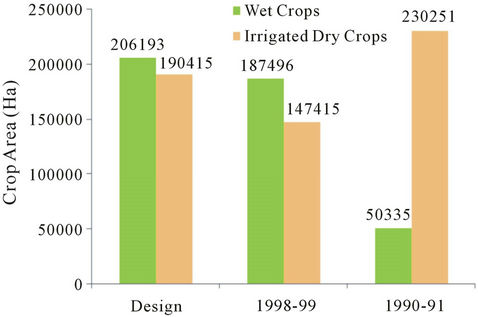
Figure 8. Overview of crop deviations in NSLC.
to 1990-91.
4.2.3. Irrigation Intensity (II)
Irrigation intensity is defined as the percentage of the culturable command area proposed to be irrigated seasonally/annually under an irrigation command. II indicates gap between the irrigation potential created and potential utilized. By knowing the intensity of irrigation for a crop season, the area irrigated during that particular crop season can be determined. Satellite derived cropping pattern information was used for the estimation of irrigation intensity. Irrigation intensity varied from 71% to 84% in NSLC from 1990-91 to 1998-99 which shows the improvement in utilizing established irrigation System. Spatial comparison of cropping pattern in NSLC in 1998 and 1991 is depicted in Figure 9 representing the variation in irrigation intensity.
4.2.4. Crop Condition
Crop condition during crop growth cycle was estimated based on Normalized Difference Vegetation Index (NDVI), an index calculated using Satellite Remote Sensing obtained reflected radiation in Near Infrared (IR) and Red (R) bands. NDVI ((NIR-R)/NIR+R)) which represents the integrated effect of various factors that influence crop production. Hence, the range of satellite derived NDVI (ranging from +0.2 to 0.7 in case of crops) was used for defining the levels of performance to assess the crop condition and to estimate the productivity at disaggregated level across the command area. The time composite maximum NDVI (maximum NDVI) estimated from multi-date satellite images of each pixel that was attained during the crop growth period was used for defining the crop condition. Rice crop condition was attempted considering the NDVI as: <0.40: low; 0.40 - 0.50—Good; >0.5—Very good).
Crop Yield Estimation & Crop Productivity Crop productivity is defined as production per unit area
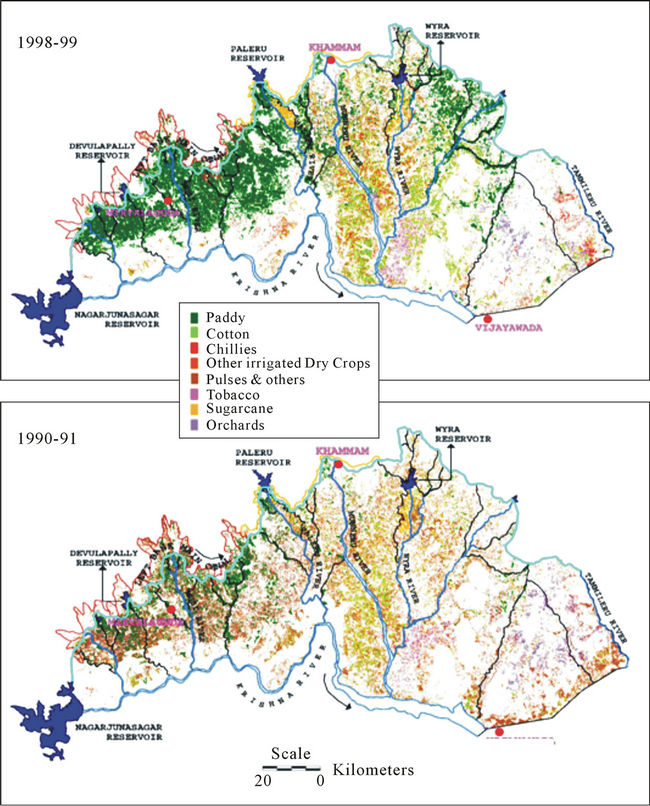
Figure 9. Comparison of cropping pattern in NSLC in 1998 and 1991.
(t/ha.). NDVI at critical crop growth stage, i.e. at the heading stage of rice crop correlates well with the dry yield (obtained from crop cutting experiments) and a regression model was developed. The relationship obtained for NDVI vs Paddy yield is shown in the Figure 10. Based on the regression model, NDVI values of pixel are used to transform into a quantitative (productivity) estimation of crop yield.
4.3. Studies on Irrigation Water Dynamics
Performance indicators of agricultural system, infrastructural systems can be integrated with water releases data and can be related with the actual utilisation of huge infrastructure. So far, satellite data was used for deriving the spatial cropping pattern, crop condition, productivity, etc. and the now the data was related field data on water deliveries in the crop season with Water Utilisation Index (WUI). Further, methodology for the assessment of the capacity of the reservoir, assessment of sedimentation using remote sensing was also addressed in this paper as part of monitoring water delivery system i.e. on the satellite derived information on the status of water storages in reservoirs.
4.3.1. Water Utilisation Index
Water Utilisation Index (WUI) is a measure of water delivery performance and constitutes one of the important spatial performance indicators of an irrigation system and is defined as area irrigated per unit volume of water delivered. WUI also forms basis for evaluating the adequacy of seasonal irrigation supplies in an irrigation system (inverse of WUI is delta, i.e. depth of water supplied to a given irrigation unit). WUI was estimated based on the canal flow information and the crop area statistics derived from the satellite data.
Estimation of WUI involves converting the areas under various crops in terms of a single major crop grown in the command area. In this present study, various crops
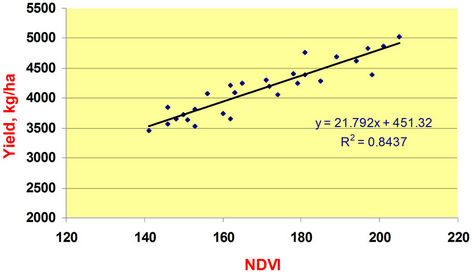
Figure 10. NDVI-yield relationship referred to estimate paddy yield.
were brought at par with wet crop (Rice) by taking operationally used equivalent wet crop conversion factors [21] mentioned below. The conversion factors were estimated based on the duties of water adopted from time to time in the project area taking into consideration of crop water requirements and irrigation efficiencies in the irrigation system.
Equivalent Wet Area: Area of {(rice + 2.0*Sugarcane + 0.5*Groundnut + 0.4*Cotton + 0.33*(Chillies & Tobacco) + 0.25 *(Grams+ Mango Orchards))} in the present study.
The Gross Irrigation Requirement (GIR) at the head or off-take points was estimated to vary between 1.50 to 1.70 m in the NSLC Command area as per the project estimates [22]. The delta during 1998-99 was estimated to be 108 cm and 153 cm during 1990-91 at command level. Therefore, the irrigation supplies during 1990-91 appears to be adequate to meet crop water requirements as it is closer to the GIR and irrigation service provided is intensive and optimal where as it was observed to be 153 cm which is indicates that the irrigation is extensive and sub optimal as it was much lower than GIR. This would have resulted in productivity variations during the two time periods. This fact was also confirmed by the yield estimates during the corresponding years i.e. paddy yield in 1998-99 (40.07 q/ha) compared to 1990-91 (45.48 q/ha) [23]. Water requirement and water utilisation depends mainly on the cropping pattern in an irrigation system. These dynamics can be studied through the analysis on spatial cropping pattern, production estimates, crop condition etc in relation with the corresponding water releases into canals at disaggregated level. The presence of spatio-temporal data always helps for better visualization of issues to benefit in the approaches required for diagnostic analysis and effective management.
5. Estimation of Water Storage in Reservoir
The availability of water for the purpose of irrigation depends upon the level of water storage in the reservoir which is dynamic in nature (having inter/intra annual variability) depending on the rainfall that occurs during the season in the catchment and sedimentation characteristics of the catchment which influences the capacity of the reservoir to have designed storage. Water storage in a reservoir is a function of water spread area and the corresponding elevation or reservoir level. Elevation-AreaCapacity (EAC) curves were generated traditionally based on pre-impoundment survey on bottom profile of the reservoir. BM studies focuses on the capacity of reservoir, storages available for utilisation vs water requirement (based cropping pattern, crop water requirements). Already SRS based cropping pattern was discussed in this paper. This section was used to demonstrate how the multi-date temporal satellite data and the concurrent information on reservoir levels was used for the development of EAC curves and comparison with earlier surveys.
Multi-date satellite remote sensing data provide information on elevation contour areas directly in the form of water spread areas. Any reduction in reservoir water spread area at a specified elevation observed by the satellites is indicative of sediment deposition. Thus, by monitoring the changes of water spread areas at various operating levels of the reservoir, the quantity of sediment load that has settled down over a period of time can be assessed. Hence, it helps in updating the existing areacapacity curves and establishing new area-capacity curves accounting the storage loss due to sedimentation for the period either from the time of impounding or from the previous hydrographic survey to the year of satellite data.
Water-spread areas estimated from satellite data were then used to calculate the reservoir capacity between two successive elevations by the following prismoidal formula.
V = h/3*(A1 + A2 + ÖA1*ÖA2)
where, “V” is the volume between two successive elevations h1 and h2
“h” is the elevation difference (h1 – h2)
“A1 & A2” are areas of reservoir water-spread at elevations h1 & h2.
Cumulative volumes were calculated by adding the successive volumes between elevations. The reservoir storages assessed with this method is depicted through Figure 11. A study is demonstrated for SRSP reservoir, Andhra Pradesh, India to quickly estimate the water spread at different levels and estimate the capacity and compared with the design to know the loss of capacity in reservoir It is observed that the loss in storage capacity is 34% of the original storage, however, the targeted irrigation potential is not yet created completely and hence this information is critical for planning the future. Such
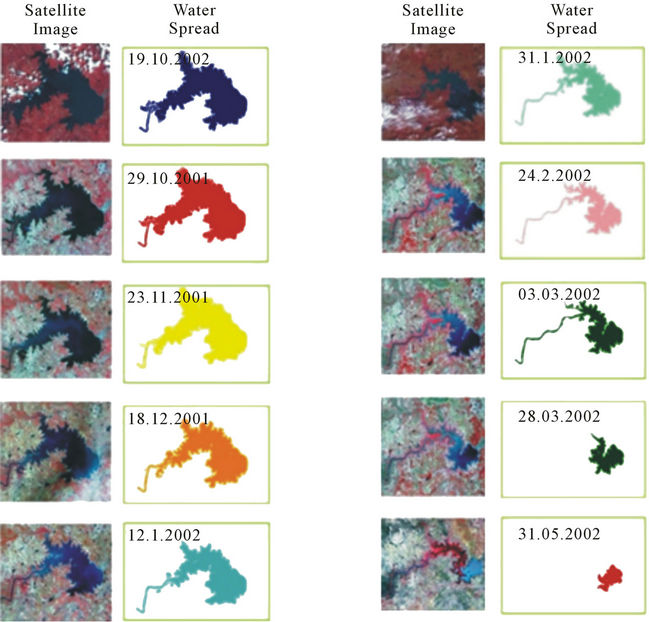
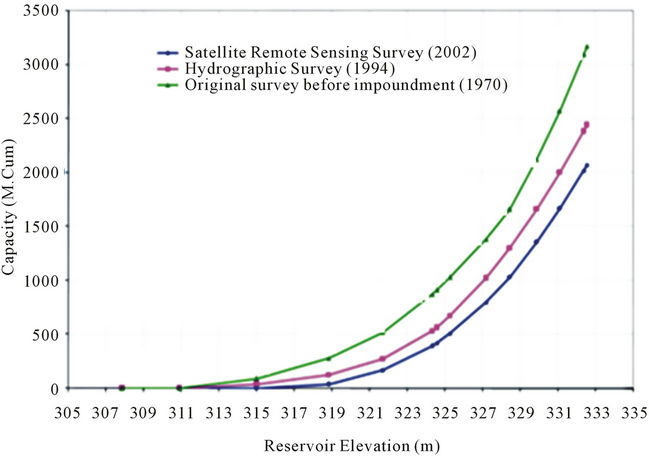
Figure 11. Temporal variation of water spread area in SRSP reservoir and capacity estimated at different operating levels of reservoir.
problems when analysed with the help of satellite data, will be possible to know the health of reservoir and will guide the reservoir operations and plan for remedial catchment treatment methods.
6. Results
Several satellites/sensors provided opportunities for multi-date satellite data acquisition and hence, the use of SRS, GIS and to explore and establish a procedure for implementing the geospatial approach for benchmarking studies of irrigation systems was demonstrated. The approach was found to be useful for operational implementation basis to supplement/complement the field based mechanisms for benchmarking of irrigation systems. A summary (Table 2) was presented depicting various benchmarking indicators used for performance evaluation of irrigation command and the utility of space inputs which can be used operationally on regular basis after the experiences gained in the present study. An unified approach for the applications of spatial information technologies namely Remote sensing, GIS and GPS and concept of Spatial Irrigation Information System defined in this study can be followed for benchmarking study of an irrigation system by deriving the irrigation spatial database from space based inputs integrated with other collateral data. Detailed studies carried out to explore the opportunities for geospatial approach for benchmarking of irrigation systems and the experience gained is used to prepare the conceptual diagram provided in Figure 12.
The geospatial approach followed in this study envisages the use of multi-date date satellite data and various satellite derived spatial irrigation performance indicators for the benchmarking studies and utilisation of the same for the development of spatial irrigation database for the efficient diagnostic analysis of irrigation system. Spatial Irrigation Database comprises of spatio-temporal information on the water distribution network (canals) respective irrigation ayacut boundary of each canal, data on water drawls, (monthly, seasonally), system design parameters, crop areas, cropping pattern, spatial irrigation performance indicators. etc. integrated under spatially referenced environment (GIS layers). These parameters when arranged in GIS across the irrigation command with the information at disaggregated (from branch canal to minor/major) level, it will be useful visualization of performance levels across the irrigation command and can facilitate quick diagnostic analysis of problem pockets during benchmarking studies. All the satellite derived inputs, field data collected for deriving various benchmarking indicators to aid in benchmarking process.
7. Summary and Conclusion
Geospatial approach for benchmarking of irrigation systems was found to be very much useful to evaluate the performance of irrigation command and to know how the performance is varying across the disaggregated units within the command and identify the problem pockets and offers scope to look into the for the alternatives for corrective management. Utilisation of satellite data helps to know the existence of crops, cropping pattern, sowing progress at disaggregated level in an irrigation command/ regional-river basin/district/state/country level in spatial domain because of the synoptic coverage and multi-date satellite data acquisition from various satellites/sensors. High resolution satellite data was found to be very much useful for inventory of irrigation infrastructure viz. entire canal network including primary, secondary & tertiary canal networks, outlets, cross drainage structures, other infrastructure etc. The methods suggested proved to be the alternative for monitoring the status of ongoing projects or verification of existing projects and to identify the infrastructural gaps/requirements in the existing projects. Finally, the methods discussed with suitable examples, flow charts provided will enhance the scope guide the researchers to take up an irrigation command and analyze and use in operational mode.
8. Acknowledgements
The authors are thankful to Dr. Vinay Kumar Dadhwal,
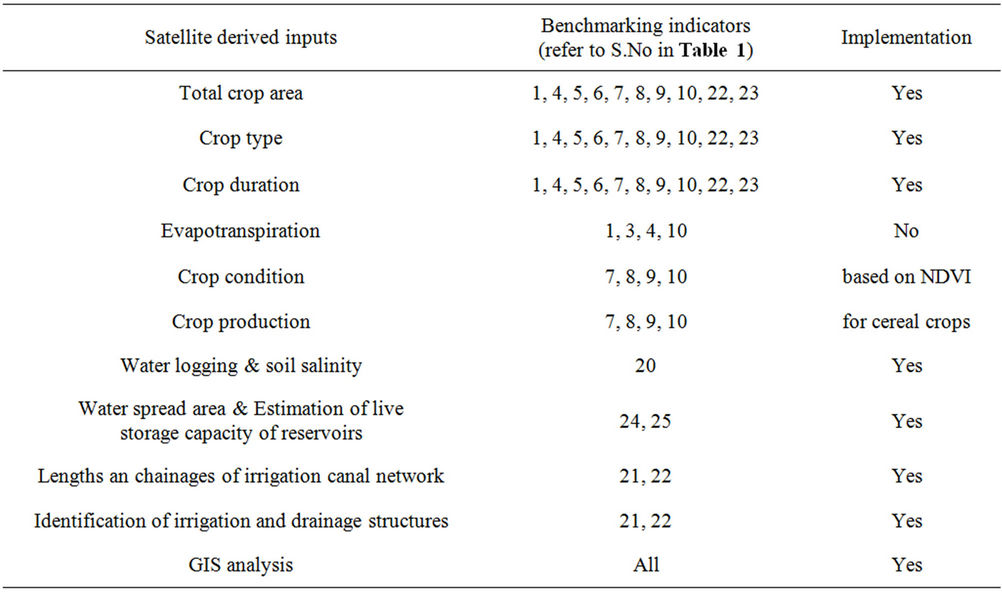
Table 2. Operationally derivable benchmarking indicators through spatial approach.
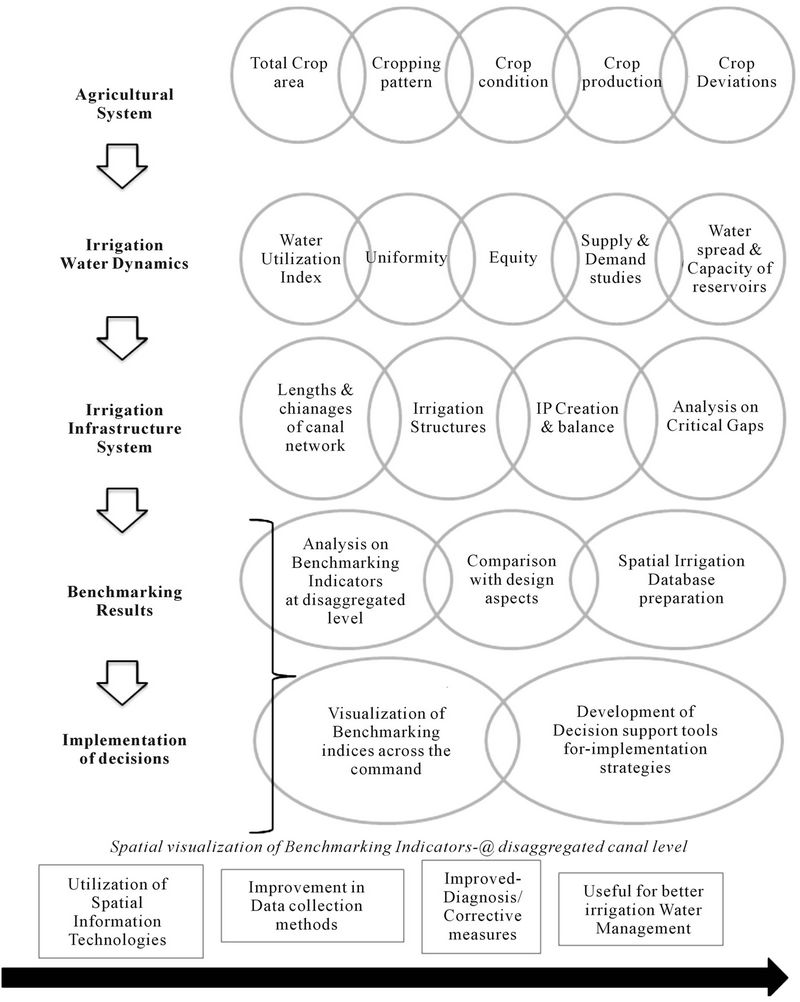
Figure 12. Operationally viable geospatial analysis approach for benchmarking of irrigation system.
Director and Dr Y.V.N. Krishnamurthy, Deputy Director, Remote Sensing Applications Area, National Remote Sensing Centre, ISRO, Dept of Space, Govt of India for providing the necessary guidance and support.
REFERENCES
- C. J. Perry, “The IWMI Water Resources ParadigmDefinitions and Implications,” Agriculture and Water Management, Vo. 40, No. 1, 1999, pp. 45-50. doi:10.1016/S0378-3774(98)00102-4
- P. S. Rao, “Review of Selected Literature on Indicators of Irrigation Performance,” IWMI Research Paper No. 13, International Water Management Institute, Colombo, Sri Lanka, 1993, pp. 1-75. http://publications.iwmi.org/pdf/H_13467i.pdf
- P. P. Nageswara Rao and A. Mohankumar, “Cropland Inventory in the Command Area of Krishnarajasagar Project Using Satellite Data,” International Journal of Remote Sensing, Vol. 15, No. 6, 1994, pp. 1295-1305. doi:10.1080/01431169408954162
- P. B. S. Sarma and V. Venkateshwar Rao, “Evaluation of an Irrigation Water Management Scheme—A Case Study,” Agricultural Water Management, Vol. 32, No. 2, 1997, pp. 181-195. doi:10.1016/S0378-3774(96)01248-6
- M. G. Bos, “Performance Indicators for Irrigation and Drainage,” Irrigation and Drainage Systems, Vol. 11, No. 2, 1997, pp. 119-137. doi:10.1023/A:1005826407118
- W. G. M. Bastiaanssen, “Remote Sensing in Water Resources Management: the State of the Art,” International Water Management Institute (IWMI), Colombo, Sri Lanka, 1998. http://publications.iwmi.org/pdf/H022865.pdf
- W. G. M. Bastiaanssen and M. G. Bos, “Irrigation Performance Indicators Based on Remotely Sensed Data: A Review of Literature,” Irrigation and Drainage Systems, Vol. 13, No. 4, 1999, pp. 291-331. doi:10.1023/A:1006355315251
- W. G. M. Bastiaanssen, S. Thiruvengadachari, R. Sakthivadivel and D. J. Molden, “Satellite Remote Sensing for Estimating Productivities of Land and Water,” International Journal of Water Resources Development, Vol. 15, No. 1, 1997, pp. 181-186. doi:10.1080/07900629949005
- Indian Committee on Irrigation and Drainage, “Indicators for Irrigation Performance Assessment,” Technical Bulletin, New Delhi, 2008.
- Indian Committee on Irrigation and Drainage, “Guidelines for Benchmarking of Irrigation Systems in India,” Technical Bulletin, New Delhi, 2002.
- W. Wolters, A. W. Zevenbergen and M. G. Bos, “Satellite Remote Sensing in Irrigation,” Irrigation and Drainage Systems, Vo. 5, No. 4, 1991, pp. 307-323. doi:10.1007/BF01102829
- S. Thiruvengadachari, “Use of Satellite Remote Sensing in Irrigation System Management,” Proceeding of Symposium on management information systems in irrigation and drainage, ICID, New Delhi, 1996.
- R. Sakthivadivel, S. Thiruvengadachari, U. Amerasinghe, W. G. M. Bastiaanssen and D. J. Molden, “Performance Evaluation of the Bhakra Irrigation System, India, Using Remote Sensing and GIS Techniques,” IWMI Research Report No. 28, International Water Management Institute, Colombo, Sri Lanka, 1999, pp. 1-31. http://www.iwmi.cgiar.org/Publications/IWMI_Research_Reports/PDF/pub028/REPORT28.PDF
- V. V. Rao and A. K. Chakraborti, “Water Balance Study and Conjunctive Water Use Planning in an Irrigation Canal Command Area: A Remote Sensing Perspective,” International Journal of Remote Sensing, Vo. 21, No. 17, 2000, pp. 3227-3238. doi:10.1080/014311600750019859
- V. K. Dadhwal, “Remote Sensing and GIS for Agricultural Crop Acreage and Yield Estimation,” Proceedings of WG VII/2 Workshop on Application of RS and GIS for Sustainable Development, International Archives in Photogrammetry and Remote Sensing, Vol. XXXII-7/W9, 1999, pp. 58-67. http://www.isprs.org/publications/archives.aspx
- S. S. Ray, V. K. Dadhwa and R. R. Navalgund, “Performance Evaluation of an Irrigation Command Area using Remote Sensing: A Case Study of Mahi Command, Gujarat, India,” Agricultural Water Management, Vol. 56, 2002, pp. 81-91. doi:10.1016/S0378-3774(02)00006-9
- S. V. Sodal, “Present Practices and Opportunities for Performance Improvement of Irrigation Schemes in Maharashtra State of India (POPIIS),” Irrigation and Drainage, Vol. 53, No. 2, 2004, pp. 175-183.
- A. V. Suresh Babu, “Benchmarking of irrigation systems Through Remote Sensing and Geographical Information Systems,” Ph.D. Thesis, Jawaharlal Nehru Technological University, Hyderabad, 2008.
- A. V. Suresh Babu, V. Venkateshwar Rao and I. V. Muralikrishna. Satellite Remote Sensing Derived Spatial Water Utilisation Index (WUI) for Benchmarking of Irrigation Systems,” Journal of the Indian Society of Remote Sensing, Vol. 35, No. 1, 2007, pp. 81-91. doi:10.1007/BF02991836
- A. V. Suresh Babu, V. Venkateshwar Rao and I. V. Muralikrishna, “Spatial Cropping Pattern Analysis for Benchmarking of Irrigation Command—Remote Sensing Approach,” The Andhra Agricultural Journal, Vol. 54, No. 3, 2007, pp.144-148.
- Irrigation & CAD Department, “Annual Report,” Nagarjuna Sagar Project (NSP), Irrigation & CAD Dept. Govt. of Andhra Pradesh State, India, 1991.
- Irrigation & CAD Department, “Annual Report,” Nagarjuna Sagar Project (NSP), Irrigation & CAD Dept. Govt. of Andhra Pradesh State, India, 1999.
- National Remote Sensing Centre, “Satellite Remote Sensing based Evaluation Study of Nagarjunasagar Left Canal Irrigation Command,” Technical Report, ISRO, India, 2005.