Advances in Nanoparticles
Vol. 1 No. 3 (2012) , Article ID: 25154 , 6 pages DOI:10.4236/anp.2012.13003
Technical Note: Synthesis and Characterization of Anisotropic Gold Nanoparticles
Biotechnology Division, Mintek, Randburg, South Africa
Email: TamsynR@mintek.co.za
Received August 26, 2012; revised October 12, 2012; accepted October 21, 2012
Keywords: Gold; Nanoparticles; Anisotropic; Photoluminescence; UV-Vis Spectroscopy
ABSTRACT
Anisotropic gold nanoparticles were synthesized in a simple, environmentally benign process under ambient conditions of temperature and atmospheric pressure using bovine serum albumin (BSA) as both the reductant and biotemplate. Two types of anisotropic nanoparticles were produced in the system, namely larger two dimensional plates and smaller three-dimensional nanoparticles. Since the characteristics of nanoparticles are largely determined by their morphology, a simple centrifugation step was included to roughly separate the larger plate-like particles from the smaller more compact particles. In an attempt to identify potential applications, the properties of the particles were determined by TEM, SEM, STEM-EDS, UV-Vis spectroscopy and photoluminescence. The results of this study identified several optical properties of gold nanoparticles.
1. Introduction
Metal nanoparticles (NPs) in the range of one to a few hundred nanometers are stated to have novel magnetic, electronic and optical properties dependent on their shape, size and composition [1]. This makes them a desirable commodity in the medical, pharmacological and biotechnological industries for use in various applications including drug delivery [2,3], hyperthermal cancer therapies [4] and diagnostic devices [5].
There are a number of advantages to the use of Au-NPs, particularly in biological systems including the following; Au-NPs: 1) bind readily to sulfhydryl groups which allow for simple NP functionalization by the conjugation of various biomolecules and other ligands; 2) are resistant to oxidation; 3) possess surface plasmons (in some cases multiple plasmon peaks depending on their morphology) which allow the Au-NP, and hence the attached ligand/molecule to be monitored by UV-Vis spectroscopy; 4) are biocompatible; 5) are size tunable for variation in Au-NP properties; 6) are electron dense due to the high atomic number of gold, making the Au-NPs easily identifiable by analysis with electron-microscopes and 7) laser illumination of the particles results in an increase in particle temperature due to energy absorption by the surface plasmons [3,4,6-9].
Anisotropic metal NPs of varying size distributions have been synthesized via environmentally-benign approaches using both prokaryotic and eukaryotic organisms including bacteria, fungi, actinomycetes and yeasts [10-12]. The use of biotemplates has also come under the spotlight in an attempt to synthesize nanoparticles by exploiting the structural properties of various proteins/ peptides and viruses to act as scaffolding for the nucleation process [13-15].
Bovine serum albumin (BSA) is one such biological template which has been successfully used by Basu and colleagues (2008) in the production of anisotropic gold nanotriangles [15]. There are a number of advantages to its use in a biological, medical and biotechnological context including the fact that it is an inert, stable protein that is often used to stabilize enzymes and proteins in low concentrations (<1 mg/ml) [16]; and is known to increase the solubility of Au-NPs in aqueous solutions when coated/conjugated to the NPs [17]. This in turn negates the need for inorganic stabilizers such as polyvinylpyrrolidone (PVP).
Although a large amount of literature exists covering the synthesis of a range of nanoparticle compositions and morphologies by various methods, surprisingly little information exists on the characterization of the particles produced.
In this study nanoparticles were produced according to the method of Basu et al. 2008, optimized in our laboratory and were characterized by TEM, SEM, STEM-EDS, UV-Vis spectrophotometry and photoluminescence in an attempt to identify potential applications.
2. Methods and Materials
2.1. Nanoparticle Synthesis
A heterogeneous mixture of anisotropic Au-NPs were synthesized using the BSA protocol described by Basu and colleagues (2008). The method was optimized for BSA template (8.3 µM) and gold chloride (Au3+) (0.25 mM) precursor concentration in our laboratory at 25˚C over 96 hrs [15]. The reproducibility of the particle synthesis was also investigated by performing the method in triplicate.
2.2. Particle Separation
A number of methods were evaluated in an attempt to separate the larger nanoplates from the smaller nanoparticles. These included differential centrifugation; centrifugation in combination with a glycerol density gradient; agarose gel electrophoresis and size exclusion chromatography.
The particles described in the paper were separated using differential centrifugation. After 96 hours incubation in the synthesis medium, a sample (25 ml) was collected, stored and labelled as the “Original” sample. The remaining solution (25 ml) was centrifuged at 1500 rpm for 5 minutes. The supernatant was labelled “Small NPs”, while the pellet was redispersed in dH2O and labelled “Large NPs”.
2.3. UV-Vis Analysis
The UV-Vis spectra of the partially purified colloidal solutions were determined and characterized on a Perkin Elmer LAMDA 750S UV/Vis Spectrometer from 200 - 1200 nm (1 nm intervals).
2.4. Photoluminescence
Photoluminescence spectra of the partially purified colloidal solutions were recorded by a Perkin Elmer, LS 55 Fluorescence Spectrometer covering a wavelength range from 300 - 680 nm with an excitation wavelength of 325 nm.
2.5. Transmission Electron Microscopy (TEM), Scanning Transmission Electron Microscopy (STEM) and Energy Dispersive X-Ray Spectroscopy (EDS)
Immediately upon sampling, 7.5 µl samples were applied to carbon-coated copper grids and allowed to air-dry (in the dark) prior to TEM analysis, to determine particle morphology. Grids were analysed using a JEOL JEM- 2100F transmission electron microscope with an operating voltage of 200 kV. Item analysis image processing software was used to measure between 100 200 particles in each sample to determine the size distribution and average size of the various anisotropic particles present.
The STEM-EDS analysis was performed using a spot size of 0.5 nm (high resolution) with an acquisition time of 220 seconds. The INCAx-sight (Oxford Instruments) EDS analysis software was used to obtain and identify the elemental spectra of various points of interest.
2.6. Scanning Electron Microscopy (SEM)
A high resolution, Zeiss ULTRA plus Field Emission Gun Scanning Electron Microscope (FEG-SEM) operating at low electron voltages of between 0.6 - 1.0 kV was used to image and characterize the surfaces of the AuNPs.
3. Results and Discussion
3.1. Nanoparticle Synthesis and Separation
The method described by Basu et al. (2008) was optimized to produce the highest concentration of compact nanoparticles within the narrowest size distribution. In addition, the effect of alternating two different acids during pH adjustment, namely weak acetic acid and 50% HCl, on particle morphology was investigated. The results showed that acetic acid promoted the synthesis of the smaller more compact particles (Figures 1(a) and 2(a)), while the use of HCl suppressed the formation of the smaller particles while subsequently promoting the growth of very large, well-formed anisotropic nanoplates in the micrometer size range (up to 10 µm) (Figure 2(b)). Unfortunately the size variations of the plate-like particles were extremely large hence the method utilizing acetic acid was chosen as the method of choice (results not shown).
Even with optimization, two types of particles were produced; namely the smaller, more compact particles and the larger, thinner plates. Since the properties of nanoscale materials are largely dependent on the particle size and morphology, a number of separation methods were identified and investigated.
All of the separation methods tested except for centrifugation in combination with a glycerol density gradient provided poor separation efficiencies. Further investtigations into optimizing the most promising method were undertaken but difficulties in extracting the fractionated particles from the glycerol gradient resulted in the method being rejected. In the end, the simplest method of differential centrifugation was chosen even though only partial separation was achieved.
3.2. TEM, SEM and STEM-EDS
Figure 1 illustrates TEM images taken of the Au-NPs
 (a)
(a)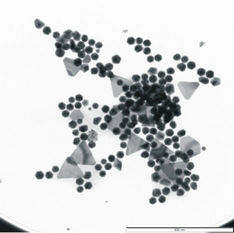 (b)
(b)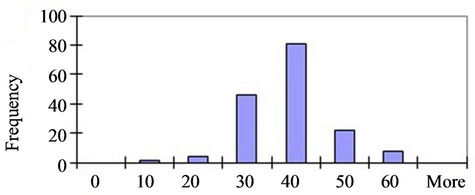 (c)
(c)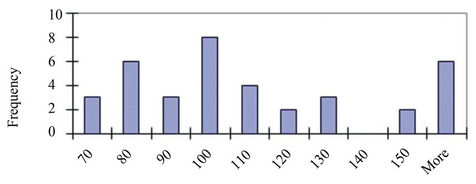 (d)
(d)
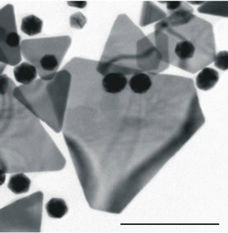
Figure 1. (a) TEM images of nanoparticles and nanoplates present in the Original sample (Scale bar = 500 nm). (b) Magnified image of a number of nanoplates illustrating the thinness of the particles (Scale bar = 200 nm). (c) and (d) Size distributions of the Small (<60 nm) and Large (>60 nm) NPs respectively.
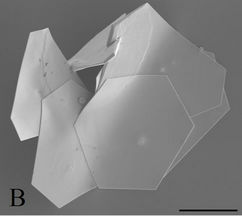
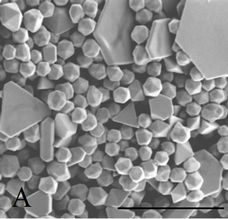
Figure 2. SEM images. (a) Range of well-formed anisotropic particles present in the Original sample (Scale bar = 200 nm). (b) Example of very large microplates produced when using HCl (Scale bar = 2 µm).
identified in the Original solution. Below the images are graphic representations of the size distributions of the Small NPs (<60 nm) and Large NPs (>60 nm) respectively. From the images, it is clear that the original sample is a heterogeneous mixture of particles. The various particles observed have clean, straight edges and are anisotropic in nature. The particle morphologies appear to be of two types, namely the two-dimensional (2D) triangular, truncated-triangular or hexagonal plates and the more compact three-dimensional (3D), rounded particles.
The nanoplates observed appear to be exceptionally thin (a few nanometers), since overlapping particles can be seen beneath them (Figure 1(b)).
In addition, these particles exhibit intriguing lines of light and dark which undulate when observed in real time and are expected to be caused by dispersion of the electron beam due to the bending of the particle [18].
On closer inspection, the SEM images in Figure 2(a) clearly show the geometric nature of both the larger plates and the smaller particles which are in fact, not merely rounded but (mostly) icosahedral (20-sided) in nature with other geometric morphologies such as truncated-icosahedrons and pyramids also present in smaller quantities.
The reproducibility of the process was demonstrated by performing the synthesis in triplicate and comparing the results using TEM analysis. The average size of both the Small NPs and Large NPs were determined using image processing software where between 100 - 200 particles were analyzed from each replicate. The average particle sizes were found to compare closely to one another (Figure 3). In addition, the Small NPs were found to dominate in all three cases at relative concentrations varying between 76% - 82%.
In addition, the elemental composition of the various particles observed in the colloidal sample were analyzed by scanning transmission electron microscopy (STEM) in combination with energy dispersive x-ray spectroscopy (EDS) and were positively identified as elemental Au (0) (Figure 4).
Since nanoparticle morphology is well known to drastically affect the properties of the sample, partial separation of the two vastly different particles was performed prior to further characterization.
4. UV-Vis Spectra
The optical and structural properties of nanoparticles are often investigated by UV-Vis adsorption spectrophotometry. The characteristics of the surface plasmon absorption bands are known to be related to the diameter and aspect ratio of metal nanoparticles [19].
Three samples (Small NPs, Large NPs and Original) were analysed for their UV-Vis spectra from 200 - 1200 nm (Figure 5). All three samples exhibited a peak at 280 nm which is due to the presence of the protein template (BSA). Since all three samples exhibited peaks at >700 nm, (755 nm, 915 nm, 1015 - 1025 nm) this indicates that only a partial separation of the particles was attained.

Figure 3. Comparing the average particle sizes for both the Small NPs and Large NPs from the three replicate tests.
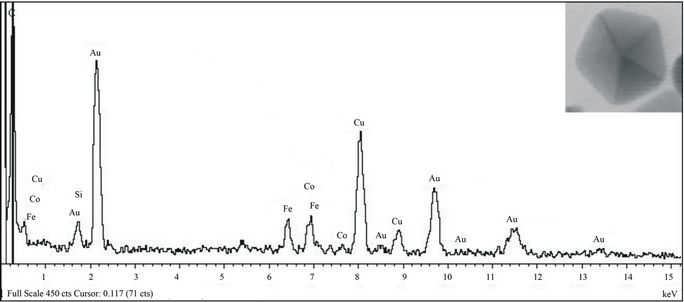
Figure 4. EDS spectrum of an anisotropic gold nanoparticle (Inset) confirming elemental gold composition.
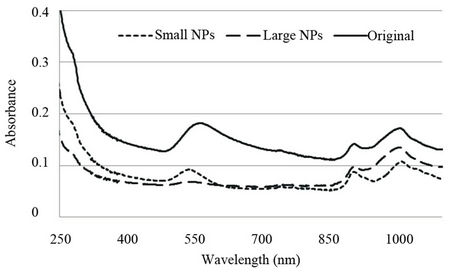
Figure 5. The UV-Vis spectra of the various colloidal solutions.
The peaks at the longer wavelengths can be attributed to the presence of nanoplates [20]. These peaks are attributed to the anisotropic triangular shapes of the plates as each apex is expected to produce its own plasmon resonance peak [9]. The colloid colour of the Large NP sample was a light orange hue which has been identified as a characteristic of the larger Au-nanoplates [20]. A subdued peak at 550 nm is also present.
For the Small NPs, a strong peak was present at 550 nm which correlates to literature attributing this peak to the smaller, rounded particles [21]. This wavelength is located within the visible colour spectrum and relates to the colour red. Visually this was confirmed by the pink hue of the Small NPs colloid. The presence of the multiple peaks (in this sample), attributed to the nanoplates, indicates the separation was only partial.
As expected, the Original sample contained both the multiple peaks at the longer wavelengths attributed to the nanoplates as well as the peak around 550 nm attributed to the smaller rounded nanoparticles, although it had been red-shifted to 570 nm.
Red-shifts of absorbance peaks indicate the presence of NPs with a larger average particle size and vice versa for blue-shifts [22].
5. Photoluminescence
Bulk metal does not usually possess photoluminescent (PL) properties due to the absence of band gaps in the atomic solid-state structure. The reduction in size to the nanometer level however allows discrete energy levels to become accessible. This results in metal nanoparticles exhibiting photoluminescence that has been shown to correlate strongly with their plasmon resonance [19,23].
In this study, all three samples were shown to possess PL properties albeit at different degrees of intensity in addition to emission peak variance. The excitation of the samples at 325 nm resulted in the emission spectra recorded in Figure 6 with the emission peak maxima identified in Table 1.
The Original sample exhibited a single high intensity peak at 418 nm while the Small NP sample displayed a similar, lower intensity peak at 413 nm. Liu et al., (2008) reported similar results with very small gold nanoparticles (5.1 nm) stabilized with BSA, excited at 320 nm exhibiting an emission peak at 404 nm. The Large NPs on the other hand exhibited a flattened spectrum with three peaks of a relatively lower intensity at 362 nm, 411 nm and 454 nm. It appears that the smaller the particles, the more intense the PL and vice versa. Similar results were reported by Philip (2008) for polyethylene glycol (PEG) and citrate stabilized gold nanoparticles and by Smitha et al. (2008) for silver nanoparticles [24].
The correlation of the plasmon resonances to PL of nanoparticles may explain why the Large NPs had multiple PL peaks since they also exhibited multiple surface plasmon resonance peaks due to their well-defined anisotropy (Figures 1(b) and 5,).
6. Conclusions
Anisotropic gold nanoparticles and nanoplates were produced using the BSA synthesis method. The shapes of particles produced ranged from two-dimensional hexagons and pentagons to three-dimensional icosahedrons and pyramids.
The presence of multiple plasmon peaks observed in all three samples during UV-Vis characterization indicates a potential application in the area of biochemical sensors. The multiple peaks at the longer wavelengths (>700 nm) are attributed to the large anisotropic plates while the peak at 540 - 550 nm is attributed to the smaller gold nanoparticles. It appears that a particle separation step is not essential as there is no interference between the absorbance regions and higher absorbance is
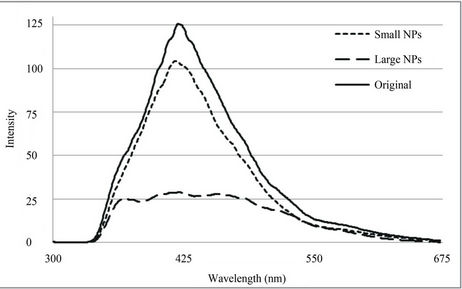
Figure 6. Photoluminescence emission spectra of the different colloidal samples at an excitation wavelength of 325 nm.
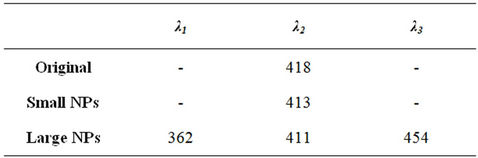
Table 1. Photoluminescence emission peak maxima of the different samples.
observed with the Original heterogeneous sample.
The presence of a single high intensity PL peak for the Original (418 nm) and Small NP (413 nm) samples after irradiation at 325 nm indicate both may be useful for biolabelling applications as potential alternatives to organic fluorophores. Hence a particle separation step is not necessary although the removal of the Large NPs did result in a ~25% reduction in PL intensity. The Large NP sample exhibited multiple PL peaks albeit with comparatively low intensity. This may exclude the larger particles from being utilised in similar applications.
7. Acknowledgements
The authors would like to thank Mintek for financial support and permission to publish the results. We would also like to extend our appreciation to the Microscopy Unit of the University of Pretoria for their endless assistance and use of equipment and to the council for scientific and industrial research (CSIR) for performing the characterizations.
REFERENCES
- P. Mukherjee, S. Senapati, D. Mandal, A. Ahmad, M. I. Khan, R. Kumar and M. Sastry, “Extracellular Synthesis of Gold Nanoparticles by the Fungus Fusarium oxysporum,” ChemBioChem, Vol. 3, No. 5, 2002, pp. 461-463.
- J. Panyam and Y. Labhasetwar, “Biodegradable Nanoparticles for Drug and Gene Delivery to Cells and Tissue,” Advanced Drug Delivery Reviews, Vol. 55, No. 3, 2003, pp.329-347. doi:/10.1016/S0169-409X(02)00228-4
- Z. P. Xu, Q. H. Zeng, G. Q. Lu and A. B. Yu, “Inorganic Nanoparticles as Carriers for Efficient Cellular Delivery,” Chemical Engineering Science, Vol. 61, No. 3, 2006, pp. 1027-1040. doi:/10.1016/j.ces.2005.06.019
- D. Pissuwan, C. H. Cortie, S. M. Valenzuela and M. B. Cortie, “Gold Nanosphere-Antibody Conjugates for Hyperthermal Therapeutic Applications,” Gold Bulletin, Vol. 40, No. 2, 2007, pp.121-129. doi:/10.1007/BF03215568
- Z. Guo, Y. Zhang, Y. DuanMu, L. Xu, S. Xie and N. Gu, “Facile Synthesis of Micrometer-Sized Gold Nanoplates through an Aniline-Assisted Route in Ethylene Glycol Solution,” Colloid Surface A, Vol. 278, No. 1-3, 2006, pp. 33-38. doi:/10.1016/j.colsurfa.2005.11.075
- A. V. Singh, B. M. Bandgar, M. Kasture, B. L. V. Prasad and M. Sastry, “Synthesis of Gold, Silver and Their Alloy Nanoparticles Using Bovine Serum Albumin as Foaming and Stabilizing Agent,” Journal of Materials Chemistry, Vol. 15, No. 48, 2005, pp. 5115-5121. doi:/10.1039/b510398c
- K. Fujiwara, H. Watarai, H. Itoh, E. Nakahama and N. Ogawa, “Measurement of Antibody Binding to Protein Immobilized on Gold Nanoparticles by Localized Surface Plasmon Spectroscopy,” Analytical and Bioanalytical Chemistry, Vol. 386, No. 3, 2006, pp. 639-644. doi:/10.1007/s00216-006-0559-2
- A. Mocanu, I. Cernica, G. Tomoaia, L. D. Bobos, O. Horovitz and M. Tomoaia-Cotisel, “Self-Assembly Characteristics of Gold Nanoparticles in the Presence of Cysteine,” Colloid Surface A, Vol. 338, No. 1-3, 2009, pp. 93-101. doi:/10.1016/j.colsurfa.2008.12.041
- L. Au, B. Lim, P. Colletti, Y. Jun and Y. Xia, “Synthesis of Gold Microplates Using Bovine Serum Albumin as a Reductant and Stabilizer,” Asian Journal of Chemistry, Vol. 5, No. 1, 2010, pp.123-129. doi:/10.1002/asia.200900468
- A. Ahmad, S. Senapati, M. I. Khan, R. Kumar, R. Ramani, V. Srinivas and M. Sastry, “Intracellular Synthesis of Gold Nanoparticles by a Novel Alkalotolerant Actinomycete, Rhodococcus Species,” Nanotechnology, Vol. 14, No. 7, 2003, pp. 824-828. doi:/10.1088/0957-4484/14/7/323
- P. Mukherjee, A. Ahmad, D. Mandal, S. Senapati, S. R. Sainkar, M. I. Khan, R. Ramani, R. Parischa, P. V. Ajayakumar, M. Alam, M. Sastry and R. Kumar, “Bioreduction of AuCl4– Ions by the Fungus, Verticillium sp. and Surface Trapping of the Gold Nanoparticles Formed,” Angewandte Chemie International Edition, Vol. 40, No. 19, 2003, pp. 3585-3588. doi:/10.1002/1521-3773(20011001)40:19<3585::AID-AN IE3585>3.0.CO;2-K
- M. Sastry, A. Ahmad, M. Islam Khan and R. Kumar, “Biosynthesis of Metal Nanoparticles Using Fungi and Actinomycete,” Current Science, Vol. 85, No. 2, 2003, pp. 162-163.
- H. Yoshimura, “Protein-Assisted Nanoparticle Synthesis,” Colloids and Surfaces A, Vol. 282-283, 2006, pp. 464-470. doi:/10.1016/j.colsurfa.2006.01.037
- D. Takagi, A. Yamazaki, Y. Otsuka, H. Yoshimura, Y. Kobayashi and Y. Homma, “Gold Filled Apo-Ferritin for Investigation of Single-Walled Carbon Nanotube Growth on Substrate,” Chemical Physics Letters, Vol. 445, No. 4-6, 2007, pp. 213-216. doi:/10.1016/j.cplett.2007.07.104
- N. Basu, R. Bhattacharya and P. Mukherjee, “Protein-Mediated Autoreduction of Gold Salts to Gold Nanoparticles,” Biomedical Materials, Vol. 3, No. 3, 2008, p. 034105. doi:/10.1088/1748-6041/3/3/034105
- M. D. Gouda, M. A. Kumar, M. S. Thakur and N. G. Karanth, “Enhancement of Operational Stability of an Enzyme Biosensor for Glucose and Sucrose using Protein Based Stabilizing Agent,” Biosensors and Bioelectronics, Vol. 17, No. 6-7, 2002, pp. 503-507. doi:/10.1016/S0956-5663(02)00021-0
- N. Wangoo, K. K. Bhasin, R. Boro and C. Raman Suri, “Facile Synthesis and Functionalization of Water-Soluble Gold Nanoparticles for a Bioprobe,” Analytica Chimica Acta, Vol. 610, No. 1, 2008, pp. 142-148. doi:/10.1016/j.aca.2008.01.033
- X. Bai, L. Zheng, N. Bin Dong and H. Liu, “Synthesis and Characterization of Microscale Gold Nanoplates Using Langmuir Monolayers of Long-Chain Ionic Liquid,” Crystal Growth and Design, Vol. 8, No. 10, 2008, pp. 3840-3846. doi:/10.1021/cg800549e
- D. Philip, “Synthesis and Spectroscopic Characterization of Gold Nanoparticles,” Spectrochimica Acta Part A, Vol. 71, No. 1, 2008, pp 80-85. doi:/10.1016/j.saa.2007.11.012
- T. Tang and I.W. Hamley, “Multiple Morphologies of Gold Nanoplates by High Temperature Polyol Synthesis,” Colloids and Surfaces A: Physical and Engineering Aspects, Vol. 336, No. 1-3, 2007, pp. 1-7.
- S. Shankar, A. Rai, A. Ahmad, and M. Sastry, “Rapid Synthesis of Au, Ag, and Bimetallic Au Core—Ag Shell Nanoparticles Using Neem (Azadirachta indica) Leaf Broth,” Journal of Colloid and Interface Science, Vol. 275, No. 2, 2005, pp. 496-502. doi:/10.1016/j.jcis.2004.03.003
- X. Bai, L. Zheng, N. Li, B. Dong and H. Liu, “Synthesis and Characterization of Microscale Gold Nanoplates Using Langmuir Monolayers of Long-Chain Ionic Liquid,” Crystal Growth and Design, Vol. 8, No. 10, 2008, pp. 3840-3846. doi:/10.1021/cg800549e
- L. Liu, H-Z. Zheng, Y-M. Huang, S-M. Chen and Y-F, Hu, “Photoluminescence from Water-Soluble BSA-Protected Gold Nanoparticles, Spectrochimica Acta Part A, Vol. 69, No. 3, 2003, pp. 701-705. doi:/10.1016/j.saa.2007.05.022
- S. L. Smitha, K. M. Nissamudeen, D. Philip and K. G. Gopchandran, “Studies on Surface Plasmon Resonance and Photoluminescence of Silver Nanoparticles,” Spectrochimica Acta Part A, Vol. 71, No. 1, 2008, pp 186-190. doi:/10.1016/j.saa.2007.12.002