American Journal of Plant Sciences
Vol.5 No.9(2014), Article ID:44442,8 pages DOI:10.4236/ajps.2014.59125
Analysis of Rice Grain Quality-Associated Quantitative Trait Loci by Using Genetic Mapping
Byung-Wook Yun, Min-Gyu Kim, Tri Handoyo, Kyung-Min Kim*
Division of Plant Biosciences, School of Applied Biosciences, College of Agriculture & Life Science, Kyungpook National University, Daegu, South Korea
Email: *kkm@knu.ac.kr
Copyright © 2014 by authors and Scientific Research Publishing Inc.
This work is licensed under the Creative Commons Attribution International License (CC BY).
http://creativecommons.org/licenses/by/4.0/


Received 3 February 2014; revised 4 March 2014; accepted 14 March 2014
ABSTRACT
The main objective of this research was to identify quantitative trait loci associated with rice qualities to provide reliable information for marker-assisted selection and development of new varieties. In total, 120 doubled haploid (DH) lines developed by another culture from the F1 hybrid of a cross between “Cheongcheong”, a Tongil variety, and “Nagdong”, a japonica variety, were used. A microsatellite linkage map of 222 markers spanned 2082.4 centimorgans (cM) and covered 12 rice chromosomes with an average interval of 9.4cM between markers. Eight quantitative trait loci (QTLs) were associated with rice quality, consisting of two QTLs on chromosomes 1 and 9 for amylose content; three QTLs on chromosomes 8, 9, and 10 for protein content; and three QTLs on chromosomes 2, 3, and 6 for lipid content. PCR expression levels measured using the SSR markers RM23914 for proteins and RM6266 for lipids, and RM586 showed a higher degree of amplification. The present study should be useful for improving the nutritional quality of rice by means of marker-assisted selection.
Keywords:Grain Quality; QTL; Rice; Genetic Map; Doubled Haploid

1. Introduction
Rice plays an important role as not only a primary food resource worldwide but also as a staple food in Korea. Development of the Tongil variety from a cross between indica and japonica in the late 1960s contributed to the self-sufficiency of South Korea achieved in the 1980s. Since 1980, the market has required high-quality rice for diverse consumers. Therefore, improvement of the chemical compounds and physical characteristics of rice to fit customer preference is crucial. Rice quality consists of appearance, nutrition, and palatability of cooked rice in addition to conformation and color of whole kernel rice. The major components of rice, i.e., carbohydrates (72% - 75%), proteins (7% - 10%), and lipids (1%), are important for nutrition content, and the particular amino acid composition of the proteins and fatty acid composition of the lipids are important. For palatability of cooked rice, texture and smell are important. Texture affected by the degree of solidity, adhesion, and cohesion with the ratio between amylose and amylopectin, also affects the mouth feel of rice. Smell is also an important factor that affects the taste of cooked rice. The period of storage after harvest can have a stronger effect on the smell of cooked rice than differences between varieties [1] . Generally, the taste of rice was determined by protein and amylose. Rice with a good taste has protein content under 7% and water content between 15.5% and 16.5%. When rice is cooked, rice with higher protein content is harder, less elastic, and less viscous. In addition, unsaturated fatty acids of rice affect the appearance of the rice grain and palatability of cooked rice [2] -[5] . Such fatty acids include palmitic acid, oleic acid, and linoleic acid [6] . Usually, high contents of lipid in foods have a negative effect on the body; however, the fat content of rice is low and almost entirely comprises unsaturated fatty acids [7] .
In this study, we investigated the growth characteristics and physicochemical properties of the CNDH rice variety, which were known to taste good and we examined quantitative trait loci (QTLs) associated with good taste of cooked rice.
2. Materials and Methods
2.1. Plant Material
The DH population consisted of 133 lines derived from a cross of “Cheongcheong” and “Nagdong” and was cultivated on the experimental field of Kyungpook National University in Gunwi-gun for three years (2010- 2012) by the Institute of Crop Breeding of the College of Agriculture and Biosciences, Kyungpook National University. All CNDH plants and their parents planted with one plant per line, and the planting density was 30 × 15 cm. The amount of fertilizer applied was N-P2O5-K2O = 9.0-4.5-5.7 kg/10a. Plants of lines with remarkable sterility and separate lines were excluded, and 120 CNDH lines were thus used to identify QTLs associated with the palatability of cooked rice.
2.2. Investigation of Growth Characteristics
Growth characteristics evaluated on the experimental field of Kyungpook National University at Gunwi in 2012. The plant materials sowed on April 20, 2012 and planted with a density of 25 × 15 cm based on one plant per line on May 20, 2012. The amount of fertilizer applied to the main paddy was N-P2O5-K2O = 9.0-4.5-5.7 kg/10a. Phosphate and potassium were used as a foundation, and nitric fertilizer consisting of 70% foundation and 30% topdressing at the tillering stage was used. Spreading of herbicides and insecticides for preventing disease and pest management followed standard cultivation methods used for rice. To investigate the growth characteristics of plant materials, plant length, panicle length, number of spikelets per panicle, and percentage of fertile grain investigated in five plants.
2.3. Analysis of the Main Components of Rice
The content of the main compounds of rice grain, i.e., amylose, lipids, proteins, and starch, was analyzed by near infrared spectroscopy (NIRS). Near infrared spectroscopy (FOSS NIR Systems 6500, USA) performed three times after removal of damaged grains, green and red kernels, and broken grains.
2.4. DNA Extraction
After cultivation of the CNDH population with the Cheongcheong and Nagdong strains for three weeks in a greenhouse, we applied the following method of Chen and Ronand [8] . The genomic DNA of the doubled haploid population extracted by cetyltrimethyl ammonium bromide (CTAB) from fresh leaves of DH individuals and parents cultured for three weeks in the green house at 25˚C. A 2-mLmicrotube (Sorenson, Co. ltd.) contains 0.1 g of leaves and a tungsten ball frozen in liquid nitrogen for 5 minutes for each line. A Tissue Lyzer (GIAGEN, Cat. No. 85220) was applied to grind the samples into powder at a vibrational frequency of 20 shakes per sec for 30 sec, after which 750 μL of 2 × CTAB buffer (2% CTAB, 0.1M Tris, pH 8.0, 1.4M NaCl, 1% PVP) was added to the tubes. After vortexing, the tubes incubated in a water bath at 65˚C for 20 minutes.
After the tubes were removed from the water bath, 750 μL of PCI (phenol:chloroform:isoamylalcohol = 25:24:1) was added to the tubes and the tubes were shaken for 20 min at room temperature prior to centrifugation, after which 500 μL of the supernatant wasremoved and placed into a new microtube (1.5 ml). Isopropanol (350 μL) added to the tubes with shaking for 5 min before freezing at −72˚C for 2 h. The tubes centrifuged at 14,000 rpm for 10 min to obtain a pellet at the bottom of each tube. The pellet washed with 70% ethanol twice and dried at room temperature. Finally, 20 μL of distilled water was added to each tube and then used for analysis of DNA polymorphisms after the concentration of each sample adjusted to 20 ng/μL.
2.5. Construction of a Genetic Map and QTL Analysis
To analyze the QTLs associated with rice quality, we used 788 SSR (simple sequence repeat) markers from the Department of Functional Crops in the Rural Development Administration. A total volume of 12 μL contained 2 μL of 10 – 20 ng/μL template DNA, 1μLof each primer at 5 - 10 pM, 0.375 μLcontaining 0.1 unit of Taq polymerase (Inclonebiotech Co., IN5001), 0.375μL of dNTP mix, 2.4 μL of 10 × Ex buffer, and 17.125 μL of nuclease-free water (Qiagen, Cat. No.129114).PCR was conducted using a T1 Thermocycler (Applied Biometra, Germany) with an initial 5 min at 96˚C followed by 35 cycles of 15 sec at 96˚C, 30 secat 55˚C, and 1 min at 72˚C. PCR products were stored at 4˚C after a final 7 min at 72˚C. PCR products were separated by electrophoresis (Nihon Eido Co. NA-1114) using an 8% natural acrylamide gel at 350 V for 90 min. We checked for DNA polymorphisms by applying EtBr for 5 min under UV light to construct a genetic map.
WinQTL cartographer software (WinQTLcart version 2.5) used for QTL analysis. Composite interval mapping (CIM) was used for whole-genome scanning by WinQTLcart 2.5 at a threshold of LOD 2.5 [9] after all of the required data were used for analysis.
3. Results and Discussion
3.1. Analysis of Growth Characteristics
Regarding the growth characteristics of the doubled haploid population derived from the cross between “Cheongcheong” and “Nagdong” (CNDH), the plant height was lower than that in the parent strains. The panicle length is lower than that in “Cheongcheong” and higher than that in “Nagdong”. The number of spikelets per panicle, the weight of 1000 seeds, and the yield in the CNDH population were lower than those in “Cheongcheong” and “Nagdong” (Table 1), and the data from the CNDH plants showed continuous variation with an approximately normal distribution. The amylose content of the CNDH population was 16.8%, whereas that of “Cheongcheong” and “Nagdong” was 15.3% and 18.4%, respectively. The protein content of CNDH population was 8.2%, whereasthat of “Cheongcheong” and “Nagdong” was 7.7% and 6.4%, respectively. The lipid content of CNDH was 3.1%, whereas that of “Cheongcheong” and “Nagdong” was 3.1% and 3.4%, respectively (Table 2).
3.2. Analysis of the Main Components in Rice
The frequency distribution of the contents of amylose, protein, and lipids in unpolished CNDH population as determined by NIRS showed in Figure 1. The content of amylose, protein, and lipids presented continuous variation and the results indicated trait related to rice quality are quantitative characteristics governed by multiple genes [4] [10] [11] .
The correlation analysis of amylose, protein and lipid associated with rice quality show on table 3 that correlation coefficient of protein is significant in level of 1% (0.326**) for the amylose.
3.3. QTL Analysis
Analysis of QTL sassociated with amylose content indicated that two QTLs are located at markers RM8111- RM14323 on chromosome 1 with a LOD score of 2.03 and at markers RM219-RM23914 on chromosome 9

Table 1. Analysis of general growth characteristics between parents and the DH population.
aThe data are presented as the mean ± SD.
Table 2. Chemical properties in brown rice of CNDH plants.
aMeasured by NIRS. bThe data are presented as the mean ± SD.
Table 3. Phenotypic correlations for rice quality components in CNDH plants.
**significant at the 0.01 level.
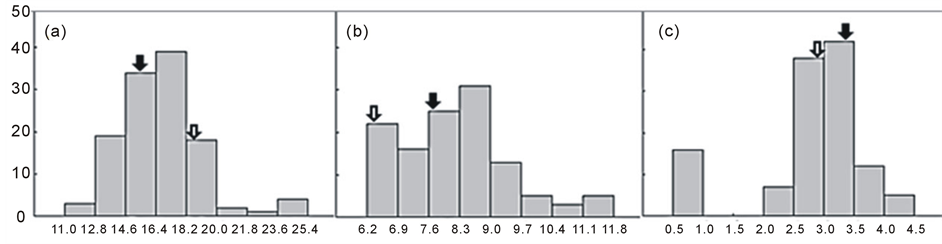
Figure 1. Frequency distributions of chemical properties in brown CNDH rice.A: Amylose (%), B: Protein (%), C: Lipid (%), :Cheongcheong,
  : Nagdong.
with a LOD score of 2.88. We named these QTLs qAml-1 and qAml-9. In the QTL analysis of protein content, three QTLs were located at RM506-RM1235 on chromosome 8 with a LOD score of 2.57, RM219-RM23914 on chromosome 9 with a LOD score of 2.66, and RM24934-RM25128 on chromosome 10 with a LOD score of 6.13, respectively. These QTLs named qPro-8, qPro-9, and qPro-10. In the analysis of lipid content, three QTLs detected on chromosomes 2, 3, and 6. RM5619-RM1211 on chromosome 2 had an LOD score of 2.78. RM15448-RM6266 on chromosome 3 had an LOD score of 2.13. A QTL related to lipids between RM586 and RM1163 on chromosome 6 had an LOD score of 2.70. These three QTLs named qLip-2, qLip-3, and qLip-6 (Table 4). All of the QTLs detected in this study placed on the constructed genetic map (Figure 2). The position of the QTLs showed in Figure 2. qAml-1 and qAml-9 were located at different positions compared with QTLs related to rice quality on chromosome 7 [12] . Other studies have found QTLs associated with protein and lipid content on chromosomes 5 and 7, respectively. The three QTLs related to protein and lipid content was located at different positions from those reported in previous studies [13] [14] . These differences likely resulted from the difference in genetic stock. Twenty lines with a high amylose, protein, and lipid content investigated with regard to the index of coincidence of markers based on the QTL analysis. There were no markers for amylose with a coincidence higher than 70%. For RM23914, the index of coincidence was 75% for the 20 lines with the highest protein content; the index of coincidence was 80% for RM25128 and RM25219 (Table 5, Figure 3). For low
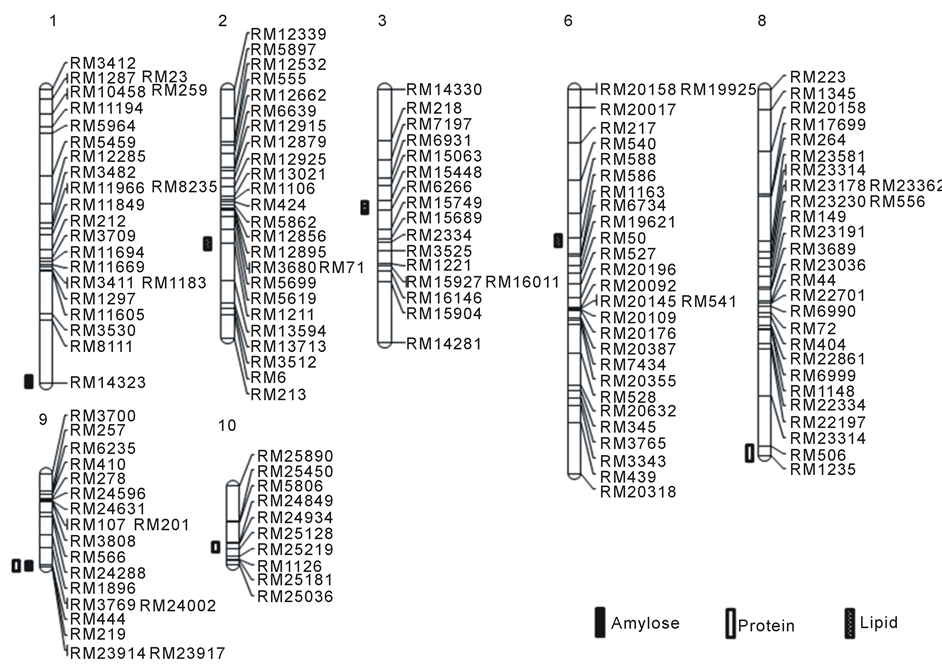
Figure 2. Chromosomal location of QTLs for amylose, protein, and lipid content of rice. Number is chromosome no.
Table 4. QTLs detected for rice quality in a double-haploid population of 120 plants.
aInterval markers are the markers within the significance threshold on each border of the QTL range. bThe proportion of the evaluated phenotype variation attributable to a particular QTL was estimated by the coefficient of determination (R2). cPositive values of the additive effect indicate that alleles from the “Chungchung” strain increase magnitude of the trait.
Table 5. Relationship between 20 selected CNDH lines and the QTLs in the parent genotype.
aCheongcheong is the maternal line. bNagdong is the fetal line; each sample’s correspondence with chromosome markers is shown.
protein content, RM506 and RM1235 presented 70% coincidence, and RM23914 with RM25128 presented 80% of coincidence (Table 6, Figure 3). Among QTLs related to lipids, RM1211 and RM1163 presented 70% and 75% coincidence, respectively, and RM15448 with RM6266 and RM586 presented 80% coincidence in the 20 lines having the highest lipid content (Table 7, Figure 4), whereas RM5619 presented 75% coincidence in the 20 lines having the lowest lipid content (Table 8, Figure 4).
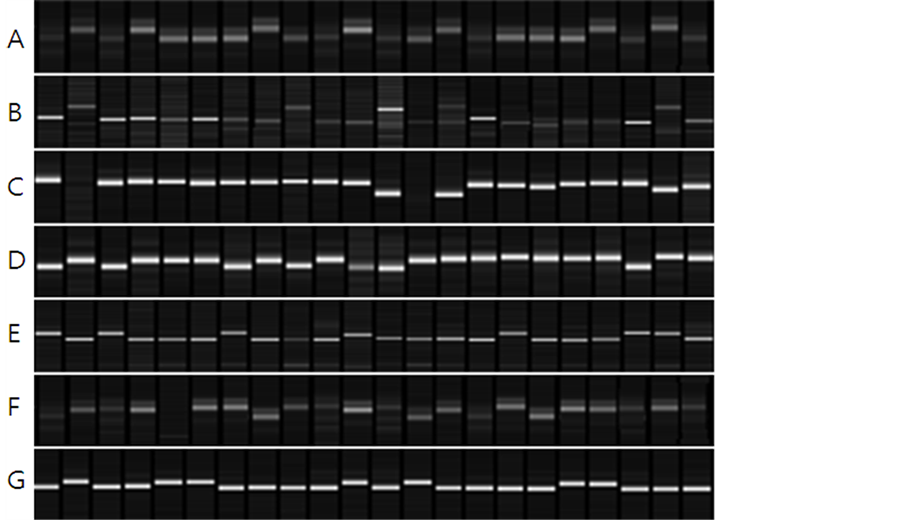
Figure 3. Relationship between 20 selected CNDH lines and QTLs in the parent genotype. A: RM23914 band represents protein, B: RM25128 band represents protein, C: RM25219 band representsprotein, D: RM506 band represents protein, E: RM1235 band represents protein, F: RM23914 band represents protein. G: RM25128 band represents protein.
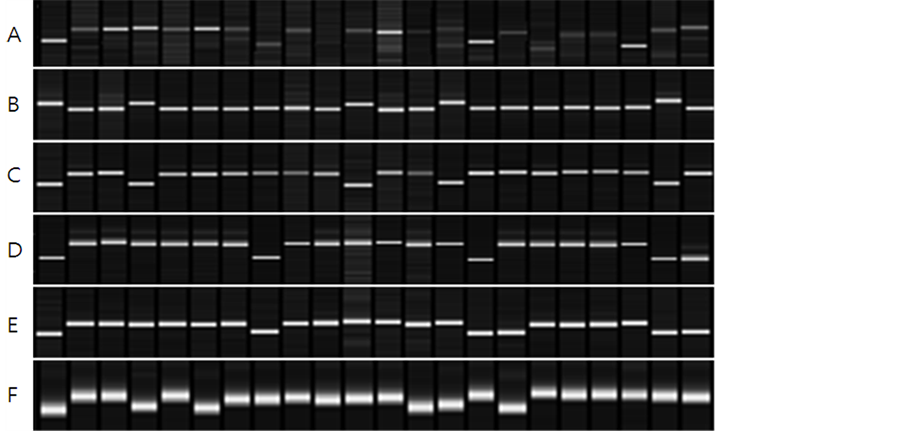
Figure 4. Relationship between 20 selected CNDH lines and QTLs in the parent genotype. A: RM1211 band represents lipid, B: RM15448 band represents lipid, C: RM6266 band represents lipid, D: RM586 band representslipid, E: RM1163 band represents lipid, F: RM5619 band represents lipid.
Table 6. Relationship between 20 selected CNDH lines and QTLs in the parent genotype.
aCheongcheong is the maternal line. bNagdong is the fetal line; each sample’s correspondence with chromosome markers is shown.
Table 7. Relationship between 20 selected CNDH lines andQTLs in the parent genotype.
aCheongcheong is the maternal line. bNagdong is the fetal line; each sample’s correspondence with chromosome markers is shown.
Table 8. Relationship between 20 selected CNDH lines andQTLs in the parent genotype.
aCheongcheong is the maternal line.bNagdong is the fetal line; each sample’s correspondence with chromosome markers is shown.
Acknowledgements
This work was supported by a grant from the Next-Generation BioGreen 21 Program (No. PJ0095052014), Rural Development Administration, Republic of Korea. This research was supported by the Kyungpook National University Research Fund, 2013.
References
- Lee, S.H. (2005) Analysis of Rice Quality and Environmental Factors Based on Different Agricultural Regions in Gyeongbuk Province. Ph D. Dissertation Thesis, Kyungpook National University, Daegu.
- Qi, Z.B., Li, B.J., Yang, W.G. and Wu, X.F. (1983) A Study on Thegenetic of Exterior Quality and Fat of the Rice Grains. Acta Genet Sinica, 10, 452-458.
- Wu, S.Z., Huang, C.W., Ou, L.C. and Liu, J.Z. (1985) Studies on Varietal Characteristics in Culture of Oryza sativa. Ⅲ. A Study on Grain Quality Character of Rice Varieties. Scientia Agricultura Sinica, 18, 1-7.
- Chen, J.G. and Zhu, J. (1997) Genetic Analysis of Fat Content in Indica-Japonica Intersubspecific Hybrid Rice. Journal of Tropical and Subtropical Botany, 6, 347-351.
- Liu, W., Zeng, J., Jiang, G. and. He, Y (2009) QTLs Identification of Crude Fat Content in Brown Rice and Its Genetic Basis Analysis Using DH and Two Backcross Populations. Euphytica, 169, 197-205. http://dx.doi.org/10.1007/s10681-009-9922-7
- Zhou, Z.K., Blanchard, C., Helliwell, S. and Robards, K. (2003) Fatty Acid Composition of Three Rice Varieties Following Storage. Journal of Cereal Science, 37, 327-335. http://dx.doi.org/10.1006/jcrs.2002.0502
- Geum, J.S. (2010) Nutrition of Rice and Processed Rice Products. Food Preservation and Processing Industry, 9, 55- 60.
- Chen, D.H. and Ronald, P.C. (1999) A Rapid DNA Minipreparation Method Suitable for AFLP and other PCR Applications. Plant Molecular Biology Reporter, 17, 53-57. http://dx.doi.org/10.1023/A:1007585532036
- Zeng, Z.B. (1994) Precision Mapping of Quantitative Trait Loci. Genetics, 136, 1457-1468.
- Kang, H.J., Cho, Y.G., Lee, Y.T., Kim, Y.D., Eun, M.Y. and Shim, J.U. (1998) QTL Mapping of Genes Related with Grain Chemical Properties Based on Molecular Map of Rice. Korean Journal of Crop Science, 43, 199-204.
- Qi, Z.B., Li, B.J., Yang, W.G. and Wu, X.F. (1983) A Study on the Genetic of Exterior Quality and Fat of the Rice Grains. Acta Genetica Sinica, 10, 452-458.
- Bao, J.S., He, P., Xia. Y.W., Chen, Y. and Zhu, L.H. (1999) Starch RVA Profile Parameters of Rice Are Mainly Controlled by Wx Gene. Chinese Science Bulletin, 44, 2047-2051. http://dx.doi.org/10.1007/BF02884919
- He, P., Li, S.G., Qian, Q., Ma, Y.Q., Li, J.Z., Wang, W. M., Chen, Y. and Zhu, L. H. (1999) Genetic Analysis of Rice Grain Quality. TAG Theoretical and Applied Genetics, 98, 502-508. http://dx.doi.org/10.1007/s001220051098
NOTES

*Corresponding author.