American Journal of Plant Sciences
Vol.5 No.5(2014), Article ID:43555,11 pages DOI:10.4236/ajps.2014.55066
Effects of Rising Temperature on Secondary Compounds of Yeheb (Cordeauxia edulis Hemsley)
Meseret C. Egigu1*, Mohamed A. Ibrahim2, Johanna Riikonen3, Asha Yahya4, Toini Holopainen2, Riitta Julkunen-Tiitto5, Jarmo K. Holopainen2
1Department of Biology, Haramaya University, Dire Dawa, Ethiopia
2Department of Environmental Science, University of Eastern Finland, Kuopio Campus, Kuopio, Finland
3The Finnish Forest Research Institute, Suonenjoki, Finland
4Department of Crop Production Ecology, Swedish University of Agricultural Sciences (SLU), Uppsala, Sweden
5Department of Biology, University of Eastern Finland, Joensuu, Finland
Email: *meseretc2001@yahoo.co.uk
Copyright © 2014 by authors and Scientific Research Publishing Inc.
This work is licensed under the Creative Commons Attribution International License (CC BY).
http://creativecommons.org/licenses/by/4.0/


Received 25 November 2013; revised 15 January 2014; accepted 11 February 2014
ABSTRACT
The effects of temperature on net photosynthesis and stomatal conductance, emission of foliar volatile organic compounds (VOCs), and phenolics were investigated after exposing Cordeauxia edulis seedlings to control (27/19˚C) and three levels of elevated (32/23, 37/27, or 42/31˚C) day/night temperature regimes in controlled growth chambers. Emissions of foliar VOC were measured on 7th and 14th day (d) of exposures, whereas net photosynthesis and stomatal conductance were measured on the 8th and 15th d. Net photosynthesis and stomatal conductance were not significantly affected by elevated temperatures. Emission rate of isoprene increased by 4-fold with 10˚C rise from the control on 7th d of exposure. Emission rates of monoterpenes, sesquiterpenes and total isoprenoids increased to 2 - 5-fold higher than that of control plants with 5˚C rise. Foliar isoprene emission peaked at daytime maximum of 37˚C and the monoand sesquiterpenes at 32˚C. Few individual foliar phenolics, and total foliar phenolics showed significant concentration differences between treatments. Although high VOC emissions under warming appeared to help plants to sustain abiotic stresses, arid/semi-arid species might substantially release highly reactive compounds that affect atmospheric chemistry. Hence, more studies are required on plant species of arid/semi-arid ecosystems of Africa to estimate the emission patterns and their role in atmospheric chemistry under the predicted future atmospheric warming.
Keywords:Cordeauxia edulis; Climatic Warming; Elevated Temperature; Gas Exchange; Isoprenoids; Phenolics

1. Introduction
Isoprenoids and phenolics are two important groups of plant secondary compounds, which are suggested to protect plants against abiotic stresses through their antioxidant properties to remove reactive oxygen species (ROS) before they oxidize cell walls and membranes [1] [2] . Volatile isoprenoids are among volatile organic compounds (VOCs) that plants release into the atmosphere in substantial amounts [3] . Volatile isoprenoids include highly reactive compounds such as isoprene, monoterpenes (MTs), and sesquiterpenes (SQTs) [4] . Quality and quantity of volatile isoprenoids and plant phenolics may be altered with changing abiotic environmental factors [5] -[8] . Temperature and photosynthetically active radiations are two of such important abiotic factors affecting the production of plant secondary compounds [9] -[12] . Across Africa, the high scenario prediction shows that temperature increases by about 0.5˚C per decade. This value is expected to be higher in semi-arid and arid regions [13] .
Because of its influence on Henry’s law constant by partitioning of compounds between the gas and liquid phase, rising temperature increases vapor pressure and emission rate of volatile isoprenoids [10] . The rise of temperature could also increase the emission of isoprenoids by increasing the activities of enzymes that synthesize them [9] [14] . However, the activities of enzymes increase only to optimum temperature level after which further rise may inactivate the enzymes, and result in reduced production of isoprenoids [15] [16] .
Elevated temperatures could also increase the production of phenolics in plants, probably through the activation of their catalytic enzymes [17] [18] . For example, more concentration of some individual phenolic was found in fruits of strawberry plants at 30/22˚C than at 18/12˚C (day/night) growth temperatures [17] . Similarly, more soluble phenolics were measured in sugarcane (Saccharum officinarum) sprouts grown at 40/35˚C than those grown at 28/23˚C (day/night) temperatures [18] .
In order to sustain temperature stress, plants use different protective mechanisms ranging from structural to biochemical. One of the biochemical mechanisms could be through synthesis of heat shock proteins [19] . Other important biochemical defense mechanism is through enhanced production of secondary compounds [1] [2] . Volatile organic compounds (e.g., isoprene) are suggested to maintain membrane integrity by linking lipid-lipid, lipid-protein, and/or protein-protein attachments so that chloroplast membrane remains intact [20] . Isoprenoids and phenolics may also alleviate cellular oxidative stress, and help to avoid membrane damage [21] [22] . Hence, they enable plants to be thermotolerant and maintain their photosynthesis at elevated temperatures [23] -[25] .
Studies on species-specific VOC emission potentials have been conducted in woodlands and rainforest ecosystems of Africa under field conditions [26] -[28] . To our knowledge, there has been no investigation of VOC emission patterns relating to physiological parameters in plant species of arid/semi-arid ecosystems of Africa in response to elevated growth temperatures. The present study was conducted on Cordeauxia edulis Hemsley (Fabaceae) maintained under controlled conditions in growth chambers. Cordeauxia edulis is a multipurpose evergreen shrub adapted to arid and semi-arid ecosystems of east Africa (Ethiopia and Somalia) [29] . We hypothesized that production of secondary compounds by plants of arid/semi-arid ecosystems of Africa increases under elevated temperatures, and thus help to sustain plant’s physiological performance.
2. Materials and Methods
2.1. Plant Material and Experimental Design
One-year-old seedlings of Cordeauxia edulis grown in 7.5-l pots filled with sand soils (size 0.1 - 1.2 mm) under greenhouse conditions [ca. 60% relative humidity (r.h.), 18:6 h Light: Dark (L:D) photoperiod, day/night 23/18˚C, and ca. 350 μmol·m−2·s−1 light intensity] in the University of Eastern Finland at Kuopio Campus were used in this study. Based on the years 2008 and 2009 temperature data (National Meteorological Service Agency of Ethiopia (NMA)), the day/night average temperatures at actual growing areas are about 27/19˚C. Therefore, these values were considered as control and compared with three day/night elevated temperature regimes of 32/23˚C, 37/27˚C, or 42/31˚C. For simplicity, only daytime temperatures will be mentioned hereafter. Seedlings (6 replicates per group) were randomly assigned to these treatment groups, and all of them were left in the treatment chamber (Bioklim 2600T, Kryo-Service Oy, Helsinki, Finland) conditions adjusted to the control temperature for three days. Thereafter, seedlings of elevated temperature treatments were subjected to their respective treatment levels. Except temperature, other variables of the chambers were set at similar conditions [ca. 50% r.h., L12:D12 photoperiod, and ca. 400 μmol·m−2·s−1 photosynthetically active radiation (PAR)] for all treatments. While in the treatment chambers, seedlings were watered every other day with equal amount of tap water. To avoid pronounced moisture variation between treatments, soil moisture status was regularly monitored visually at soil surface and kept always moist by adding water as necessary. To avoid bias by the chamber effect on treatment groups, seedlings of all treatments were rotated (twice per week) between the chambers to let them equally experience all chambers with previous chamber temperature level adjusted to fit to the current treatment group. Also, position of each seedling was regularly changed within the chambers to eliminate position effect on individual seedlings. The experiment lasted for two weeks.
2.2. Collection and Analysis of Volatile Organic Compounds (VOCs)
Volatile organic compounds were collected in the lab at room temperature (ca. 24˚C) using a dynamic bag enclosure method. The collection was done outside the treatment chambers because of technical difficulties to arrange equipment setups for VOCs collection and gas exchange measurements. Foliar VOCs were collected on the 7th and 14th d of exposures. For VOCs collection, seedlings were enclosed by an oven-cleaned (1 h, at 120˚C) 3-l multi-purpose polyethylene terephthalate (PET) cooking bags (Look, Terinex Ltd., UK). After fixing the PET bags, air filtered through charcoal filter and MnO2 scrubber was pumped into the bags at a flow rate of ca. 300 ml per min. The bags were then connected to suction tubes that drew air through stainless steel tube filled with 150 mg Tenax TA adsorbent (Supelco, Bellefonte, PA, USA) at a rate of ca. 200 ml per min, and samples were collected for 1 h.
After collection, samples were analyzed by gas chromatograph and mass spectrometer (GC-MS) (GC type 6890, MSD 5973; Hewlett Packard, Wilmington, DE, USA). The MS was in an electron impact ionization mode (EI) at 70 eV, mass scanning range of m/z 33–300, and scanning rate at 5.24 s−1. Adsorbed compounds were thermally released from the adsorbent using automated thermal desorption system (Model ATD400; Perkin-Elmer, Norwalk, CT, USA) at 250˚C for 10 min, cryofocused in a cold trap at −30˚C, and injected onto an HP-5MS capillary column (length 50 m, internal diameter 0.2 mm, film thickness 0.33 μm; Agilent J&W, Davis, CA, USA). The temperature of the column was first held at 40˚C for 1 min. Then, the temperature rose to 210˚C at 5˚C per min and to 250˚C at 20˚C per min. The carrier gas used was helium.
Compound identification was made by comparing its mass spectra with those in the Wiley library and authentic external standard compounds. Moreover, its retention index (RI) was compared to that of the National Institute of Standards and Technology (NIST) Chemistry web book (http://webbook.nist.gov/chemistry/) and to published articles on volatiles of the same plant species analyzed using the same stationary phase [30] [31] . Only compounds with quality values (Q.V) from Wiley library of ≥ 90 were considered.
The external standard compounds for terpene identification were isoprene, tricyclene, α-pinene, 1,8-cineole, linalool, longifolene, α-humulene, terpinolene, δ-cadinene (Fluka; Buchs, Switzerland); camphene (Aldrich; Milwaukee, WI, USA); δ-3-carene, camphor, borneol, terpinen-4-ol, α-terpineol, β-pinene, and γ-terpinene (Aldrich; Steinheim, Germany); β-myrcene, limonene, sabinene (Sigma; St. Louis, MO, USA); bornyl acetate (Chemos GmbH; Regenstauf, Germany); and (E)-β-farnesene (Bedoukian Research; Danbury, CT, USA). The external standards for C6 green leaf volatiles (GLVs) were (E)-2-hexenal, (Z)-3-hexen-1-ol, 1-hexanol, (Z)-3- hexenyl acetate, (Z)-3-hexenyl butyrate, (Z)-3-hexenyl isovalerate, and (Z)-3-hexenyl tiglate (Aldrich). While the compounds for which we had standards were quantified readily in reference to the standards, those MTs for which we lacked standards were tentatively quantified by relating their peak areas to that of α-pinene assuming their responses would be the same as that of α-pinene. Similarly, (E)-β-farnesene was used to tentatively quantify those SQTs for which we lacked pure standards [30] -[32] . Finally, the emission rates were calculated using the formula, [(Cout-Cin)Q]/mdry, where Cout and Cin are respectively the outlet and inlet concentrations of the compound of interest (ng·C·l−1), Q is the flow rate of the bag purge air (l m−1) and mdry is the dried mass of leaves enclosed [33] . As the incoming air in our system was filtered and analyses of blank samples showed no detectable isoprenoids and GLVs, inlet concentration was taken as zero.
2.3. Gas Exchange Measurements and Assessment of Visible Leaf Injury
After foliar VOCs collection, seedlings were put back in their treatment chambers for a day before gas exchange measurements. Thus, net photosynthesis and stomatal conductance were measured in the lab at the same temperature as VOCs collection on the 8th and 15th d of exposures. In both periods, measurements were done on the same healthy and full grown leaves of each seedling using a portable photosynthesis measurement device (Model LI-6400; LiCor Biosciences, Lincoln, NE, USA). Leaf chamber temperature and CO2 concentration were 22˚C and 400 ppm, respectively. The air flow through the chamber was at a rate of 500 µmol·s−1. External light source was used to provide PAR at a level of ca. 1500 µmol·m−2·s−1. Number of leaflets was also documented by assessing for the presence/absence of chlorotic and necrotic spots as signs of heat stress damage from all seedlings in each treatment on the 15th d of exposure.
2.4. Foliar Phenolic Analysis
After gas exchange measurement on the 15th d of exposure, equally mature healthy leaves of all plants were sampled for phenolic analysis and dried at room temperature in storage paper bags for about two months. Tissue extractions were made based on the established standard method [34] . Leaf samples (8 mg) were taken and put separately in Percellys vials (vol. 2 ml). Thereafter, plant materials were homogenized in Percellys 24 beadbeating tissue homogenizer (Bertin technologies, Paris, France) with 0.6 ml of ice-cold methanol (MeOH) for 20 s at a rate of 5500 rpm. The mixture was allowed to stand on ice for 15 min, re-homogenized for 20 s and centrifuged using an Eppendorf centrifuge 5415 R for 3 min at a rate of 1300 rpm. Immediately after centrifugation, the supernatant from each sample was collected into another vial. The remaining plant sediments were extracted three more times with 0.6 ml of ice-cold MeOH as before, and the supernatants were pooled. Thereafter, MeOH was evaporated from extracts using nitrogen gas flow to the surface of the solution in a test tube. The dried extracts were then stored in a freezer (−20˚C) until the analysis.
The dried extracts were dissolved in 0.6 ml of MeOH: distilled water (1:1), and analyzed using a liquid chromatograph (Hewlett-Packard, P 1050 Series HPLC, Palo Alto, CA, USA) equipped with binary pump and autosampler (Agilent 1100). A photodiode array detector (Agilent 1100) coupled with an HP data-system personal computer was used for recording chromatograms and ultraviolet-visible (UV-Vis) spectra. The column used was HP Hypersil ODS (3 µm particle size) as a stationary phase. The eluents were an aqueous 1.5% tetrahydrofuran + 0.25% o-phosphoric acid (eluent A) and 100% MeOH (eluent B) and used in a gradient of 0 - 5 min, 100% A; 5 - 10 min, 85% A; 10 - 20 min, 70% A; 20 - 47 min, 50% A; 47 - 65 min, 100% B. The oven temperature was 30˚C and injection volume and flow rate were 15 µl and 2 ml·min−1, respectively. The HPLC runs were processed at 220 and 270 nm. The compounds were identified based on their retention time and UV spectrum. Quantification of the compounds was based on the reference factors of pure standard compounds as follows: gallic acid (Sigma) for gallic acid and gallotannins; (+)-catechin (Aldrich Chemicals Co, Milwaukee, WI, USA) for epigallocatechin; hyperin (Sigma) for hyperin and quercetin-3-glucoside; chlorogenic acid (Sigma) for chlorogenic acid; and salicin (Phytolab) for cordeauxiaquinone and the unknowns.
2.5. Statistical Analysis
Statistical analyses were conducted with the statistical package SPSS for Windows 14.0 (SPSS; Chicago, IL, USA). Data were first checked for normality of distribution and logarithmically transformed as necessary. Physiological and VOCs data were analyzed with General Linear Model for repeated measurements while phenolic data was analyzed by one-way ANOVA. The differences between means were considered to be statistically significant at P < 0.05 or marginally significant at P < 0.1.
3. Results
3.1. Gas Exchange and Visible Leaf Injury Symptoms
Exposure to elevated temperatures, duration of exposure, and the interaction between temperature treatment and duration of exposure had no effects on net photosynthesis (P > 0.1). Values (mean ± SE, in µmol·m−2·s−1) of net photosynthesis measured on 8th d at 27, 32, 37, and 42˚C were 1.87 ± 0.80, 1.72 ± 1.2, 1.5 ± 0.70, and 1.46 ± 0.66, respectively, whereas values measured on 15th d at 27, 32, 37, and 42˚C were 1.58 ± 0.50, 2.50 ± 1.72, 2.90 ± 0.60, and 1.90 ± 1.70, respectively. Stomatal conductance was also not affected by temperature treatment (data not shown). No distinct visible leaf damage symptoms were noticed as a result of exposure of seedlings to elevated temperatures.
3.2. Effect of Temperature on the Emission of Foliar VOCs
In each treatment 43 volatile isoprenoids; isoprene, 22 monoterpenes (non-oxygenated monoterpenes: α-thujene, α-pinene, α-fenchene, camphene, verbenene, sabinene, β-pinene, β-myrcene, p-cymene, limonene, γ-terpinene; and oxygenated monoterpenes: fenchyl alcohol, (E)-pinocarveol, pinocarvone, camphor, borneol, terpinen-4-ol, α-terpineol, myrtenol, myrtenal, verbenone and bornyl acetate), and 20 sesquiterpenes (bicycloelemene, α-cubebene, α-copaene, β-elemene, (E)-bergamotene, α-cedrene, α-gurjunene, β-cubebene, (Z, E)-α-farnesene, germacrene D, aromadendrene, δ-cadinene, ar-curcumene, eremophilene, α-selinene, (Z)-calamenene, 7-epi-α-selinene, α-calacorene, spathulenol and cadina-1,4-diene) were detected in the headspace of C. edulis seedlings. However, GLVs were either not detected in any of the treatment or their quality values (Q.Vs) were much lower (<50) than the detection limit (i.e., Q.V of 90).
Emission of all volatiles in isoprenoid class showed positive response to temperature rise up to a certain level, but negative trend after that point. For example, emission rate of isoprene (Figure 1(a)) was significantly affected by temperature treatment (P = 0.004). The highest isoprene emission peak was observed at 37˚C in both measurement periods with rise to 4-fold on 7th d and 2-fold on 14th d of exposures from that of 27˚C. However, emission began to decline after 37˚C. Isoprene emission was not affected by duration of exposure (P = 0.591) though it appeared to decline at 37 and 42˚C on 14th d compared to 7th d measurement.
Elevation of temperature significantly affected the emission rate of monoterpenes (P = 0.003). Monoterpenes (Figure 1(b)) peaked at 32˚C with emission rate increase to 2- and 3-fold from that of 27˚C on 7th and 14th d of exposures, respectively, but declined at temperatures higher than 32˚C.
Temperature treatment had significant effect on the emission rate of sesquiterpenes (P = 0.002). Like monoterpenes, sesquiterpenes (Figure 1(c)) also peaked at 32˚C with emission rate rise to 4- and 5-fold from that of 27˚C on 7th and 14th d of exposures, respectively. Unlike monoterpenes, duration of exposure had impact (P < 0.049) on the emission of sesquiterpenes.
Emission rate of total isoprenoids was significantly affected by temperature treatment (P < 0.001), and peaked at 32˚C or 37˚C, but declined at 42˚C (Figure 1(d)).
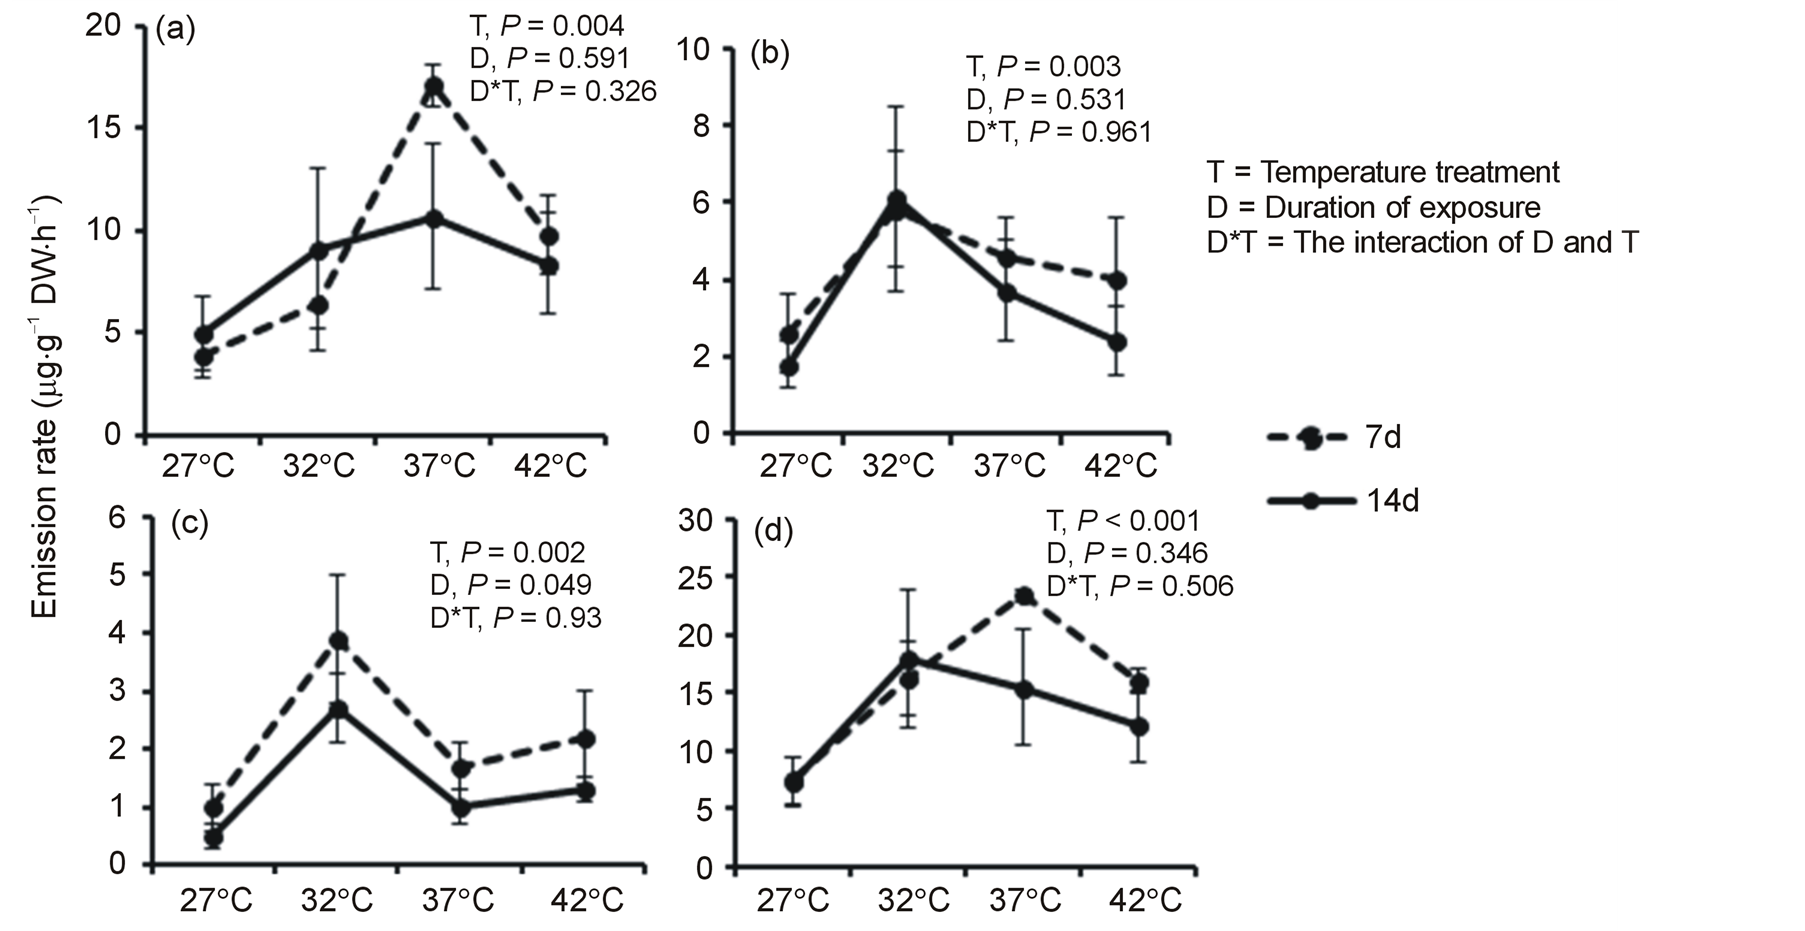
Figure 1. Mean (+ SE, n = 6) emission rates (µg·g−1 DW·h−1) of isoprene (a), total monoterpenes (b), total sesquiterpenes (c), and total isoprenoids (d) measured after 7 and 14 days of exposure to four temperature regimes. Values for total isoprenoids represent isoprene, total monoterpenes and total sesquiterpenes together.
Monoterpene hydrocarbons (MT-hc) and oxygenated monoterpenes (MT-oxy) were in 1:1 ratio. However, all sesquiterpenes except spathulenol were non-oxygenated hydrocarbons. Both MT-hc (Figure 2(a)) and MT-oxy (Figure 2(b)) were significantly affected by temperature treatment (P < 0.01). Emission rates of MT-oxy were also significantly (P < 0.05) affected by duration of exposure (Figure 2(b)).
3.3. Effect of Temperature on Foliar Phenolic Compounds
Eleven phenolics were detected from the leaf extracts of C. edulis (Table 1). The compositions of foliar phenolics were similar in all treatments. The concentrations of most of them did not vary between treatments. However, the concentration of hyperin was significantly lower at control treatment than elevated temperatures (F = 3.726, P = 0.045). Moreover, cordeauxiaquinone and total phenolics showed marginally significant increases at 37˚C compared to other treatment levels (F = 2.63, P = 0.098 and F = 2.709, P = 0.092, respectively).
4. Discussion
4.1. Elevated Temperature Increased Foliar Isoprenoid Emissions
Foliar emission rate of isoprene was quadrupled when temperature was raised by 10˚C from the control (27˚C) for 7 days. The observed increase of isoprene emission rate with elevation of temperature is consistent with previous reports [16] [35] [36] . In general, elevation of the control temperature by 5˚C increased emission rates of monoterpenes, sesquiterpenes, and total isoprenoids by 2 - 5-fold higher than the control. This is in accordance
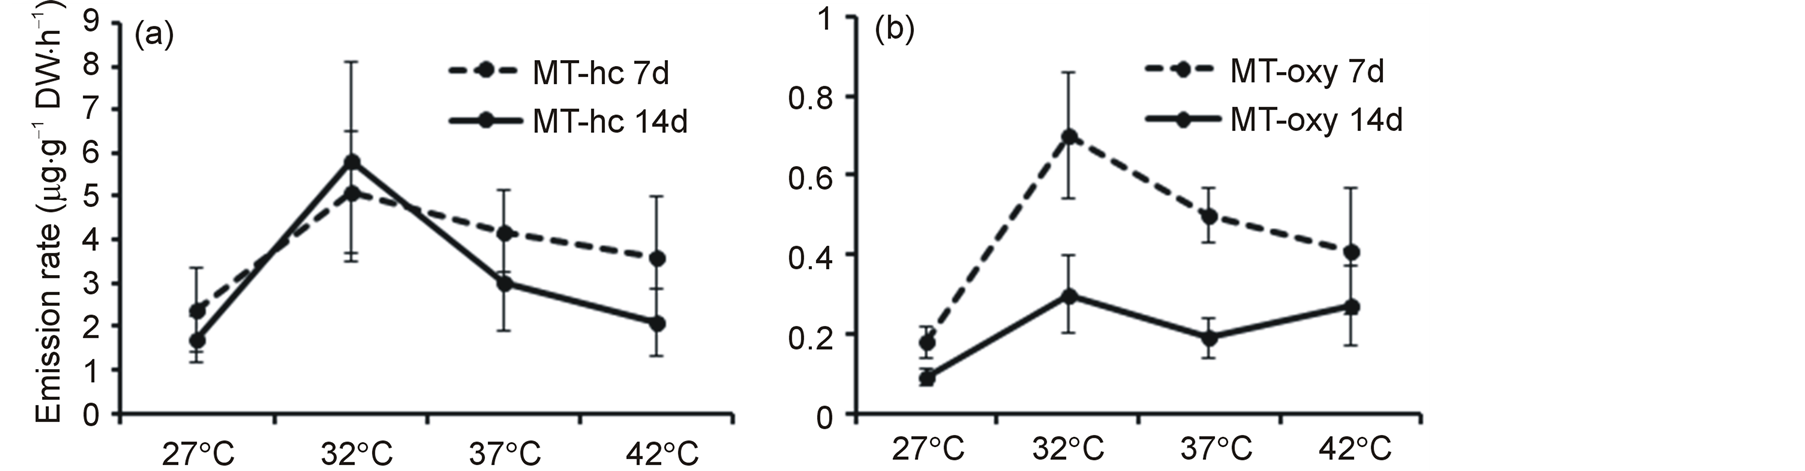
Figure 2. Mean (+ SE, n = 6) emission rates (µg·g−1 DW·h−1) of non-oxygenated monoterpene hydrocarbons (MT-hc) (a) and oxygenated monoterpenes (MTs-oxy) (b) measured after 7 and 14 days of exposure to four temperature regimes.

Table 1. Mean (± SE, n = 4) (mg/g DW) of phenolic compounds from leaves of C. edulis exposed to four temperature regimes for 15 days. Means within a row followed by different letters are significantly different, whereas those followed by the same letters are not significantly different.
Ukn = Unknown compound.
with 3-fold increase of emission rate of α-pinene from Q. ilex when its leaf temperature was raised from 20˚C to 30˚C [14] . These results suggest that a rise by 5˚C from the ambient control (27˚C), which is predicted to happen in arid and semi-arid regions in a few decades time [13] , may cause a substantial increase in the emissions of highly reactive VOCs by plants in arid and semi-arid ecosystems.
Isoprene emission rate is known to reach maximum in 35˚C to 45˚C temperature range [16] [37] . Similar trend was observed in our experiment, though emission began to decline at 42˚C in both measurement periods. On the other hand, monoterpenes and sesquiterpenes peaked at 32˚C and then began to decline at temperature levels above 32˚C. Some previous reports show that the peak emission rate of isoprene will not be sustained for long period [38] -[40] . For example, isoprene emission rate declined after a few minutes of rapid increase at about 45˚C [38] [40] . Though the impact of duration of exposure was not significant, we noticed a down-regulation of the emission rate of isoprene at the two highest used temperature levels on 14th d compared to measurement taken on the 7th d of exposure. There was no significant difference in photosynthesis within treatments with duration of exposure to be accounted for the down-regulation of isoprene emission rate on 14th d of measurement. Therefore, we hypothesize that the observed trend of decline in isoprene emission rate at 37˚C and 42˚C when measured on 14th d of exposure compared to that of 7th d is due to the impact of prolonged exposure on the activity of isoprene synthase, and/or increased cellular respiration rate to drain off more photosynthate. Also, the longer the duration of exposure, the lesser was the emission rate of sesquiterpenes. This may also be explained by the reduction in the activity of enzymes due to prolonged exposure.
Suppression of temperature-dependence of isoprene emission rate can occur under severe drought [41] . Similar condition may also happen in C. edulis under its natural arid environment where high temperature and drought co-occur. However, in this experiment, pronounced moisture variation between treatments was avoided by keeping soils of all treatments always moist. Thus, drought was less likely to influence isoprene and other volatile isoprenoids emission in conjunction with high temperatures.
We separately analyzed non-oxygenated (MT-hc) and oxygenated monoterpenes (MT-oxy) in order to know their difference in responding to temperature treatments with duration of exposure. The result showed that emission of MT-hc was not affected by duration of exposure while that of MT-oxy declined on 14th d compared to 7th d measurement. To our knowledge, this is the first report to show variations between oxygenated and non-oxygenated terpenes in their responses to elevated temperature in the course of time. We did VOCs collection out of the treatment chambers that allowed plants of all treatments to stay at least for an hour in the lab at room temperature. This situation, however, did not stop the increased emission of volatile isoprenoids at elevated temperatures, indicating that the influence of elevated temperature or possibly heat stress in the highest regime seems to last for some time even after the removal of the stress.
4.2. The Effect of Elevated Temperature on Phenolic Compounds was Minor
The compositions of foliar phenolic compounds did not vary between treatments (Figure 3). While the concentrations of most of the identified individual phenolic compounds were unaffected by temperature, hyperin and cordeauxiaquinone, however, increased at one or more of the elevated temperatures compared to the control. Previously, more concentrations of some individual phenolic compounds (e.g. p-coumaroyl glucose, quercetin 3-glucoside, quercetin 3-glucuronide, etc) were observed from fruits of strawberry plants grown in 30/22˚C than those grown in 18/12˚C day/night temperature combinations [17] . Anthocyanin accumulation was also in sugar cane (Saccharum officinarum) with day/night temperature elevated from 28/23˚C to 40/35˚C [18] . Synthesis of individual phenolic compounds depends on optimum light and temperature [42] . Increased concentration of hyperin and cordeauxiaquinone in this experiment could also be attributed to the optimality of the temperature at which they were found increased. Above all, their increase in the leaves at higher temperatures could be related to defense against temperature stress.
4.3. Relations of Gas Exchange and Leaf Volatiles
In this experiment, net photosynthesis was not significantly affected when temperature was elevated by 5˚C - 15˚C above the control under lab conditions. This probably indicates the tolerance of C. edulis to the rise of its ambient temperature up to 42˚C. Thermotolerance to higher used temperatures (37˚C and 42˚C) may generally be explained by the defensive role of increased production of isoprenoids under elevated temperatures [23] -[25] [43] -[45] . In particular, isoprene has been noted for its effective thermoprotection role by several authors at

Figure 3. Typical HPLC chromatogram showing phenolic compounds from leaf of C. edulis.
leaf temperatures above 35˚C under lab conditions [44] [46] [47] . In spite of no difference in photosynthesis between the control and elevated temperatures, isoprene, which is synthesized de novo from carbon precursors from photosynthetic process [48] [49] , increased with elevation of temperature and peaked at 37˚C. Though it happened to decline at 42˚C, it was still higher than the control indicating that isoprene emission was not affected by net photosynthesis rate in this experiment. The activity of isoprene synthase might have increased between 37˚C and 42˚C to result in increased emission of isoprene. Previous reports show that isoprene emission reaches maximum between 35˚C and 45˚C [37] . Here again, it is important to note that isoprene emission rate tends to be down-regulated with prolonged exposure to these high temperature levels, which might suggest reduction in the activity of isoprene synthase with longer duration of high temperatures.
After 14 days of exposure to elevated temperatures, leaves of C. edulis seedlings did not develop noticeable signs of injury. Moreover, GLVs, which may indicate cellular damage by heat stress [40] [50] , were not detected in foliar volatiles of heat stressed seedlings of C. edulis. This suggests that the increased production of constitutive volatile isoprenoids under elevated temperatures may have protected the seedlings from injury.
5. Conclusion
In this experiment, foliar emission of isoprene from C. edulis increased by 4-fold with 10˚C rise of the ambient temperature, while monoterpenes, sesquiterpenes and total iosprenoids increased generally by 2 - 5-fold with 5˚C warming of the ambient temperature for 7 and/or 14 days. The fact that no inhibition of photosynthesis, increased emission of GLVs and visible leaf injury were observed suggests that increased emissions of isoprenoids at high temperatures may have a defensive role. These results also suggest that climatic warming may make plants of arid/semi-arid ecosystems significant contributors to VOCs released into the atmosphere. Cordeauxia edulis, which belongs to these ecosystems, and, is an evergreen shrub emitting a wide range of volatile isoprenoids, can therefore be a candidate model plant to infer the emission patterns of arid and semi-arid tropical plants and the potentials of these ecosystems to respond and contribute to the future climate change.
Acknowledgements
We thank Timo Oksanen for his technical assistance of setting the chamber conditions and the staff at the Research Garden of Kuopio Campus for taking care of our experimental plants. This study was funded by the Academy of Finland (grant 16981) and the Graduate School in Forest Sciences.
References
- Vickers, C.E., Gershenzon, J., Lerdau, M.T. and Loreto, F. (2009) A Unified Mechanism of Action for Volatile Isoprenoids in Plant Abiotic Stress. Nature Chemical Biology, 5, 283-291. http://dx.doi.org/10.1038/nchembio.158
- Fares, S., Oksanen, E., Lännenpää, M., Julkunen-Tiitto, R. and Loreto, F. (2010) Volatile Emissions and Phenolic Compound Concentrations along a Vertical Profile of Populus nigra Leaves Exposed to Realistic Ozone Concentrations. Photosynthesis Research, 104, 61-74. http://dx.doi.org/10.1007/s11120-010-9549-5
- Peñuelas, J. and Llusià, J. (2003) BVOCs: Plant Defense against Climate Warming? Trends in Plant Science, 8, 105- 109. http://dx.doi.org/10.1016/S1360-1385(03)00008-6
- Blanch, J.S., Peñuelas, J., Sardans J. and Llusià, J. (2009) Drought, Warming and Soil Fertilization Effects on Leaf Volatile Terpene Concentrations in Pinus halepensis and Quercus ilex. Acta Physiologia Plantarum, 31, 207-218. http://dx.doi.org/10.1007/s11738-008-0221-z
- Peñuelas, J. and Estiarte, M. (1998) Can Elevated CO2 Affect Secondary Metabolism and Ecosystem Function? Trends in Ecology and Evolution, 13, 20-24. http://dx.doi.org/10.1016/S0169-5347(97)01235-4
- Loreto, F., Fischbach, R.J., Schnitzler, J.P., Ciccioli, P., Brancaleoni, E.N.Z.O. and Calfapietra, C. (2001) Monoterpene Emission and Monoterpene Synthase Activities in the Mediterranean Evergreen Oak Quercus ilex L. Grown at Elevated CO2 Concentrations. Global Change Biology, 7, 709-717. http://dx.doi.org/10.1046/j.1354-1013.2001.00442.x
- Loreto, F. and Schnitzler, J.P. (2010) Abiotic Stresses and Induced BVOCs. Trends in Plant Science, 15, 154-166. http://dx.doi.org/10.1016/j.tplants.2009.12.006
- Peñuelas, J. and Staudt, M. (2010) BVOCs and Global Change, Trends in Plant Science, 15, 133-144. http://dx.doi.org/10.1016/j.tplants.2009.12.005
- Peñuelas, J. and Llusià, J. (2001) The Complexity of Factors Driving Volatile Organic Compound Emissions by Plants. Biologia Plantarum, 44, 481-487. http://dx.doi.org/10.1023/A:1013797129428
- Niinemets, Ü., Loreto, F. and Reichstein, M. (2004) Physiological and Physicochemical Controls on Foliar Volatile Organic Compound Emissions. Trends in Plant Science, 9, 180-186. http://dx.doi.org/10.1023/A:1013797129428
- Holopainen, J.K. and Kainulainen, P. (2004) Reproductive Capacity of the Grey Pine Aphid and Allocation Response of Scots Pine Seedlings across Temperature Gradients: A Test of Hypotheses Predicting Outcomes of Global Warming. Canadian Journal of Forest Research, 34, 94-102. http://dx.doi.org/10.1139/x03-203
- Ibrahim, M.A., Mäenpää, M., Hassinen, V., Kontunen-Soppela, S., Malec, L., Rousi, M., et al. (2010) Elevation of Night-Time Temperature Increases Terpenoid Emissions from Betula pendula and Populus tremula. Journal of Experimental Botany, 61, 1583-1595. http://dx.doi.org/10.1093/jxb/erq034
- IPCC (2007) Climate Change: Technical Summary. In: Solomon S, Qin D, Manning M, Chen C, Marquis M, et al. editors. Climate Change 2007: The Physical Science Basis. Cambridge University Press, Cambridge.
- Loreto, F., Ciccioli, P., Cecinato, A., Brancaleoni, E., Frattoni, M. and Tricoli, D. (1996) Influence of Environmental Factors and Air Composition on the Emission of Alpha-Pinene from Quercus ilex Leaves. Plant Physiology, 110, 267-275.
- Tingey, D.T., Manning, M., Grothaus, L.C. and Burns, W.F. (1979) The Influence of Light and Temperature on Isoprene Emission Rates from Live Oak. Physiologia Plantarum, 47, 112-118. http://dx.doi.org/10.1111/j.1399-3054.1979.tb03200.x
- Monson, R.K., Jaeger, C.H., Adams, W.W., Driggers, E.M., Silver, G.M. and Fall, R. (1992) Relationships among Isoprene Emission Rate, Photosynthesis, and Isoprene Synthase Activity as Influenced by Temperature. Plant Physiology, 98, 1175-1180. http://dx.doi.org/10.1104/pp.98.3.1175
- Wang, S.Y. and Zheng, W. (2001) Effect of Plant Growth Temperature on Antioxidant Capacity in Strawberry. Journal of Agriculture and Food Chemistry, 49, 4977-4982. http://dx.doi.org/10.1021/jf0106244
- Wahid, A. (2007) Physiological Implications of Metabolite Biosynthesis for net Assimilation and Heat-Stress Tolerance of Sugarcane (Saccharum officinarum) Sprouts. Journal of plant Research, 120, 219-228. http://dx.doi.org/10.1007/s10265-006-0040-5
- Wang, W., Vinocur, B., Shoseyov, O. and Altman, A. (2004) Role of Plant Heat-Shock Proteins and Molecular Chaperones in the Abiotic Stress Response. Trends in Plant Science, 9, 244-252. http://dx.doi.org/10.1016/j.tplants.2004.03.006
- Rennenberg, H., Loreto, F., Polle, A., Brilli, F., Fares, S., Beniwal, R.S. and Gessler, A. (2006) Physiological Responses of Forest Trees to Heat and Drought. Plant Biology, 8, 556-571. http://dx.doi.org/10.1055/s-2006-924084
- Appel, H.M. (1993) Phenolics in Ecological Interactions: The Importance of Oxidation. Journal of Chemical Ecology, 19, 1521-1552. http://dx.doi.org/10.1007/BF00984895
- Loreto, F., Pinelli, P., Manes, F. and Kollist, H. (2004) Impact of Ozone on Monoterpene Emissions and Evidences for an Isoprene-Like Antioxidant Action of Monoterpenes Emitted by Quercus ilex (L.) Leaves. Tree Physiology, 24, 361- 367. http://dx.doi.org/10.1093/treephys/24.4.361
- Loreto, F., Förster, A., Dürr, M., Csiky, O. and Seufert, G. (1998) On the Monoterpene Emission under Heat Stress and on the Increased Thermotolerance of Leaves of Quercus ilex L. Fumigated with Selected Monoterpenes. Plant Cell and Environment, 21, 101-107. http://dx.doi.org/10.1046/j.1365-3040.1998.00268.x
- Sharkey, T.D., Chen, X. and Yeh, S. (2001) Isoprene Increases Thermotolerance of Fosmidomycin-Fed Leaves. Plant Physiology, 125, 2001-2006. http://dx.doi.org/10.1104/pp.125.4.2001
- Peñuelas, J. and Llusià, J. (2002) Linking Photorespiration, Monoterpenes and Thermotolerance in Quercus. New Phytologist, 155, 227-237. http://dx.doi.org/10.1046/j.1469-8137.2002.00457.x
- Klinger, L.F., Greenberg, J., Guenther, A., Tyndall, G., Zimmerman, P., M’Bangui, M., Moutsamboté, J.-M. and Kenfack, D. (1998) Patterns in Volatile Organic Compound Emissions along a Savanna-Rainforest Gradient in Central Africa. Journal of Geophysical Research: Atmosphere, 103, 1443-1454.
- Greenberg, J.P., Guenther, A., Harley, P., Otter, L., Veenendaal, E.M., Hewitt, C.N., James, T. and Owens, S. (2003) Eddy Flux and Leaf-Level Measurements of Biogenic VOC Emissions from Mopane Woodland of Botswana. Journal of Geophysical Research: Atmosphere, 108, 8466-8474. http://dx.doi.org/10.1029/2002JD002317
- Saxton, J.E., Lewis, A.C., Kettlewell, J.H., Ozel, M.Z., Gogus, F., Boni, Y., et al. (2007) Isoprene and Monoterpene Measurements in a Secondary Forest in Northern Benin. Atmospheric Chemistry and Physics, 7, 4095-4106.
- Brink, M. (2012) Cordeauxiaedulis Hemsl., Record from Protabase. In: Brink, M. and Belay, G., Eds., PROTA (Plant Resources of Tropical Africa/Resources végétales de l’Afriquetropicale). http://database.prota.org/search.htm
- Ibrahim, M.A., Egigu, M.C., Kasurinen, A., Yahya, A. and Holopainen, J.K. (2010) Diversity of Volatile Organic Compound Emissions from Flowering and Vegetative Branches of Yeheb, Cordeauxia edulis (Caesalpiniaceae), a Threatened Evergreen Desert Shrub. Flavour and Fragrance Journal, 25, 83-92.
- Egigu, M.C., Ibrahim, M.A., Yahya, A. and Holopainen, J.K. (2010) Yeheb (Cordeauxia edulis) Extract Deters Feeding and Oviposition of Plutella xylostella and Attracts Its Natural Enemy. Biological Control, 55, 613-624.
- Himanen, S.J., Nerg, A.M., Nissinen, A., Pinto, D., Stewart, C.N., Poppy, G.M., et al. (2009) The Effects of Elevated CO2 and Ozone on Volatile Terpenoid Emissions and Multitrophic Communication of Transgenic Insecticidal Oilseed Rape (Brassica napus L.). New Phytologist, 181, 174-186.
- Ortega, J. and Helmig, D. (2008) Approaches for Quantifying Reactive and Low-Volatility Biogenic Organic Compound Emissions by Vegetation Enclosure Techniques—Part A. Chemosphere, 72, 343-364.
- Julkunen-Tiitto, R. and Sorsa S. (2001) Testing the Drying Methods for Willow Flavonoids, Tannins and Salicylates. Journal of Chemical Ecology, 27, 779-789. http://dx.doi.org/10.1023/A:1010358120482
- Sharkey, T.D. and Loreto, F. (1993) Water Stress, Temperature, and Light Effects on the Capacity for Isoprene Emission and Photosynthesis of Kudzu Leaves. Oecologia, 95, 328-333. http://dx.doi.org/10.1007/BF00320984
- Tiiva, P., Faubert, P., Michelsen, A., Holopainen, T., Holopainen, J.K. and Rinnan, R. (2008) Climatic Warming Increases Isoprene Emission from a Subarctic Heath. New Phytologist, 180, 853-863. http://dx.doi.org/10.1111/j.1469-8137.2008.02587.x
- Monson, R.K. and Fall, R. (1989) Isoprene Emission from Aspen Leaves. Plant Physiology, 90, 267-274. http://dx.doi.org/10.1104/pp.90.1.267
- Singsaas, E.L. and Sharkey, T.D. (2000) The Effects of High Temperature on Isoprene Synthesis in Oak Leaves. Plant, Cell and Environment, 23, 751-757. http://dx.doi.org/10.1046/j.1365-3040.2000.00582.x
- Sharkey, T.D., Chen, X. and Yeh, S. (2001) Isoprene Increases Thermotolerance of Fosmidomycin-Fed Leaves. Plant Physiology, 125, 2001-2006. http://dx.doi.org/10.1104/pp.125.4.2001
- Loreto, F., Barta, C., Brilli, F. and Nogues, I. (2006) On the Induction of Volatile Organic Compound Emissions by Plants as Consequence of Wounding or Fluctuations of Light and Temperature. Plant, Cell and Environment, 29, 1820- 1828. http://dx.doi.org/10.1111/j.1365-3040.2006.01561.x
- Fortunati, A., Barta, C., Brilli, F., Centritto, M., Zimmer, I., Schnitzler, J.P. and Loreto, F. (2008) Isoprene Emission Is Not Temperature-Dependent during and after Severe Drought-Stress: A Physiological and Biochemical Analysis. Plant Journal, 55, 687-697. http://dx.doi.org/10.1111/j.1365-313X.2008.03538.x
- Bakhshi, D. and Arakawa, O. (2006) Induction of Phenolic Compounds Biosynthesis with Light Irradiation in the Flesh of Red and Yellow Apples. Journal of Applied Horticulture, 8, 101-104.
- Velikova, V., Loreto, F., Tsonev, T., Brilli, F. and Edreva, A. (2006) Isoprene Prevents the Negative Consequences of High Temperature Stress in Platanus orientalis Leaves. Functional Plant Biology, 33, 931-940. http://dx.doi.org/10.1071/FP06058
- Behnke, K., Ehlting, B., Teuber, M., Bauerfeind, M., Louis, S., Hänsch, R., Polle, A., Bohlmann, J. and Schnitzler, J.P. (2007) Transgenic, Non-Isoprene Emitting Poplars don’t Like It Hot. Plant Journal, 51, 485-499.
- Way, D.A., Schnitzler, J.P., Monson, R.K. and Jackson, R.B. (2011) Enhanced Isoprene Related Tolerance of Heatand Light-Stressed Photosynthesis at Low, but not High, CO2 Concentrations. Oecologia, 166, 273-282. http://dx.doi.org/10.1007/s00442-011-1947-7
- Sharkey, T.D. and Singsaas, E.L. (1995) Why Plants Emit Isoprene? Nature, 374, 769. http://dx.doi.org/10.1038/374769a0
- Velikova, V. and Loreto, F. (2005) On the Relationship between Isoprene Emission and Thermotolerance in Phragmitesaustralis Leaves Exposed to High Temperatures and during the Recovery from a Heat Stress. Plant, Cell and Environment, 28, 318-327. http://dx.doi.org/10.1111/j.1365-3040.2004.01314.x
- Ghirardo, A., Koch, K., Taipale, R., Zimmer, I., Schnitzler, J.P. and Rinne, J. (2010) Determination of de Novo and Pool Emissions of Terpenes from Four Common Boreal/Alpine Trees by 13CO2 Labelling and PTR-MS Analysis. Plant, Cell and Environment, 33, 781-792.
- Ghirardo, A., Gutknecht, J., Zimmer, I., Bruggemann, N. and Schnitzler, J.P. (2011) Biogenic Volatile Organic Compound and Respiratory CO2 Emissions after 13C Labeling: Online Tracing of C Translocation Dynamics in Poplar Plants. PLoS ONE, 6, Article ID: e17393. http://dx.doi.org/10.1371/journal.pone.0017393
NOTES

*Corresponding author.