Advances in Computed Tomography
Vol.1 No.2(2012), Article ID:22390,6 pages DOI:10.4236/act.2012.12002
Porosity Analysis Based on CT Images of Coal under Uniaxial Loading
1State Key Laboratory of Coal Resources and Safe Mining, China University of Mining & Technology, Beijing, China
2Department of Mechanics, Beijing Institute of Technology, Beijing, China
3National Engineering Research Center for Coal Gas Control, Huainan, China
Email: mlt@cumtb.edu.cn, shipeng010321@163.com, tuhui521@163.com, alq@cumtb.edu.cn,
juy@cumtb.edu.cn, haonai1986@163.com
Received June 5, 2012; revised July 18, 2012; accepted August 2, 2012
Keywords: Porosity Analysis; Coal Sample; ICT Image; Surface Porosity; Voxel Porosity; Uniaxial Loading
ABSTRACT
According to the character of CT image, surface porosity and voxel porosity are defined from pixel and voxel scale respectively. Digital Terrain Model (DTM) method is applied to calculate the surface porosity, and the method of voxel porosity is also presented based on Industrial CT grey image. With proposed methods, CT images of coal under different uniaxial loading are analyzed, and the relation curves between two kinds of porosity and stress separately are shown. All of these porosities reflect inner damage of coal. The surface porosity shows the pore with pixel scale, and voxel porosity denotes the pore inner pixel. The voxel porosity reflects the character of CT image better.
1. Introduction
Computer tomography (CT) is a new experiment technique of coal mechanics investigation, and it has incomeparable advantages in rock nondestructive detection and real-time detection of crack in rocks under different loading conditions. Frederik [1] present method to quantify characterization of coal by means of micro-focal Xray computed micro-tomography and color image analysis. Karacan [2] investigated and evaluated the adsorption and gas transport in coal microstructure by quantitative X-ray CT imaging. Mazumder [3] analyzed cleat spacing and cleat aperture in coal samples by CT. Yang Gengshe [4] identified coal damage characteristics through CT, given damage variable formula based on CT number. Yin Guangzhi [5] analysed CT number and variance data of coal rock materials, and obtained coal damage evolution law of different stress stages under uniaxial loading condition, providing a basis for the investigating occurrence and development of micro cracks from the meso scale. Yao [6] studied pores’ characteristics in different coals by μCT.
Lemaitre [7] has pointed out that “scale” problems of both material damage and damage identification are two key problems in damage mechanics, Yang Gengshe [8] pointed out that CT recognition can meet the requirement of damage identification scale.
According to CT image characteristics, the damage can be analyzed from the two scales: pixel scale (Pixel) and voxel scale (Voxel, 1 Voxel = 1 Pixel × 1 Pixel × Slice thickness). Though the two kinds of scales have their own characteristics, these is certain relationship between them. There is little literature to tell the difference between the two scales. In this paper, damage variable calculation methods are analyzed based on the two scales, and internal porosity of coal in different stages is analyzed quantitatively under uniaxial loading conditions.
2. Materials and Methods
2.1. Coal Sample
The coal samples from Datong in Shanxi Province, that consisted of 92% non-crystalline, 3.7% clay minerals, 2.7% boehmite, and 1.6% gibbsite, were used in these experiments. These samples were taken at depth of 395 m below the surface.
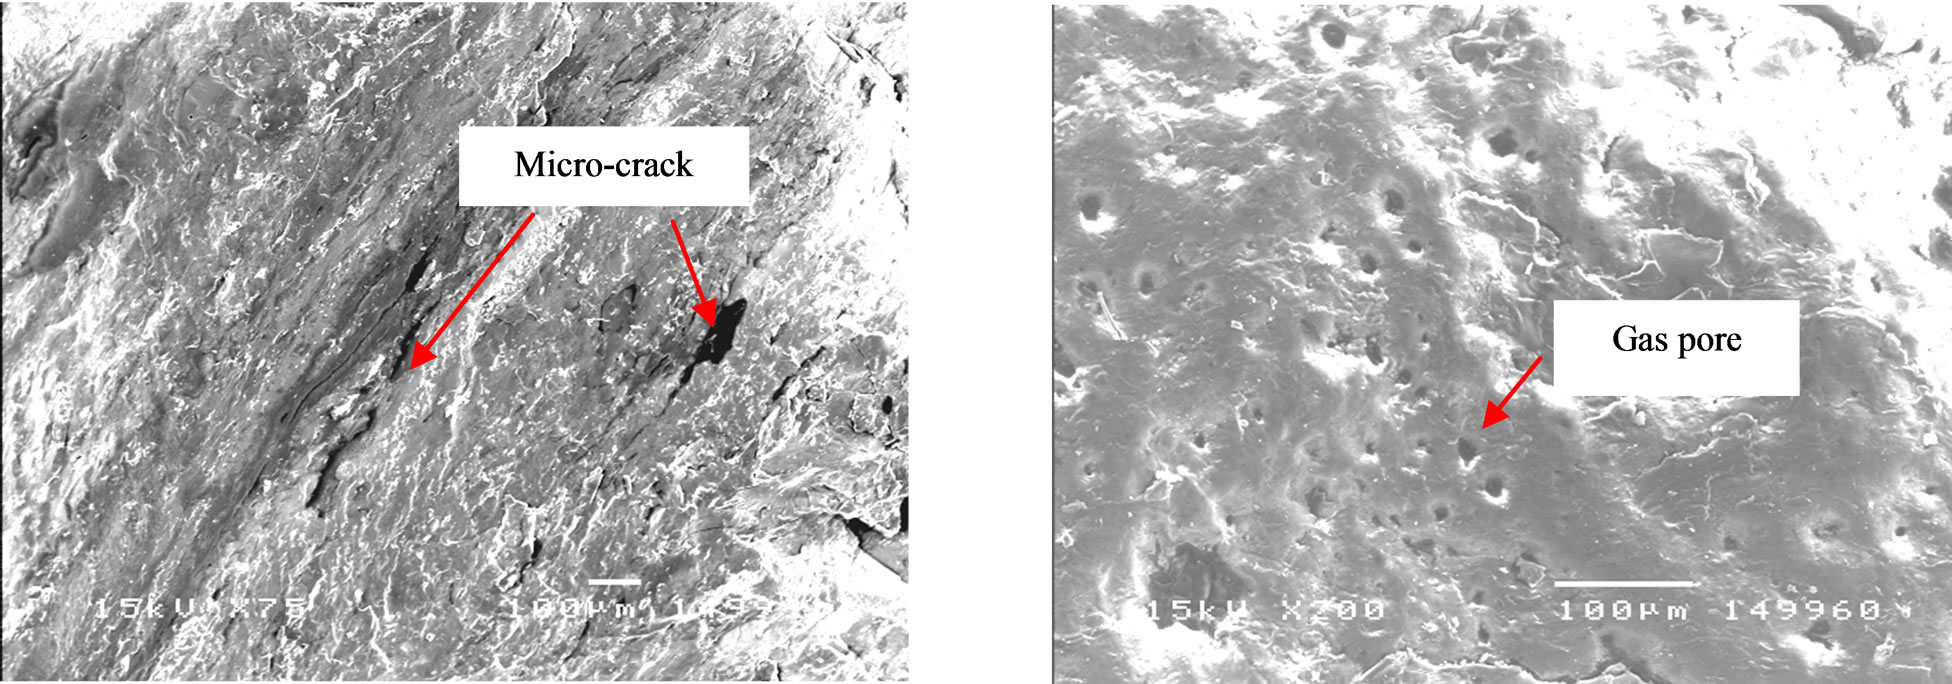
With mercury intrusion method, the porosity and the pore distribution of three coal samples were obtained. The results are shown in Table 1. The average porosity of sample is 13.31%, and the proportion of pore with diameter over 1000 nm is near 70%. These pores includes micro-crack and gas pore, the Figure 1 shows the microstructure images with Scanning Electron Microscopy (SEM).
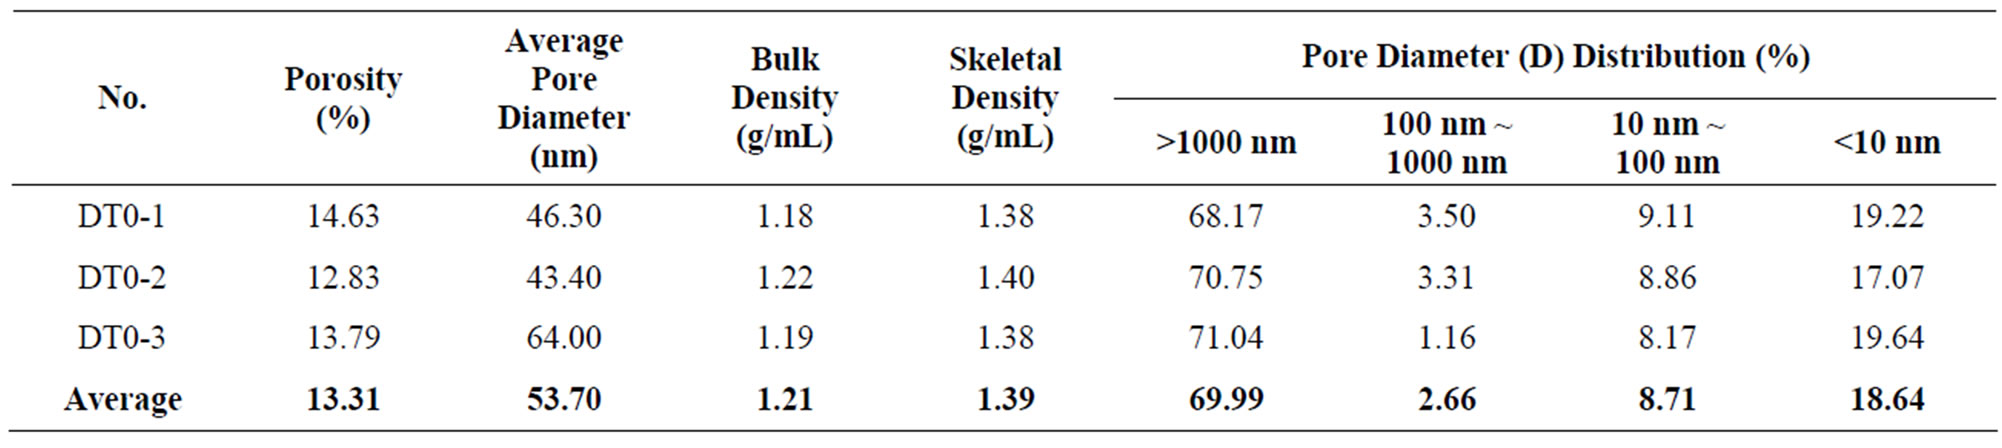
Table 1. Porosity and pore distribution.
 (a) (b)
Figure 1. SEM images of coal. (a) Micro-crack in the sample; (b) Gas pore in the sample
2.2. CT Scanning
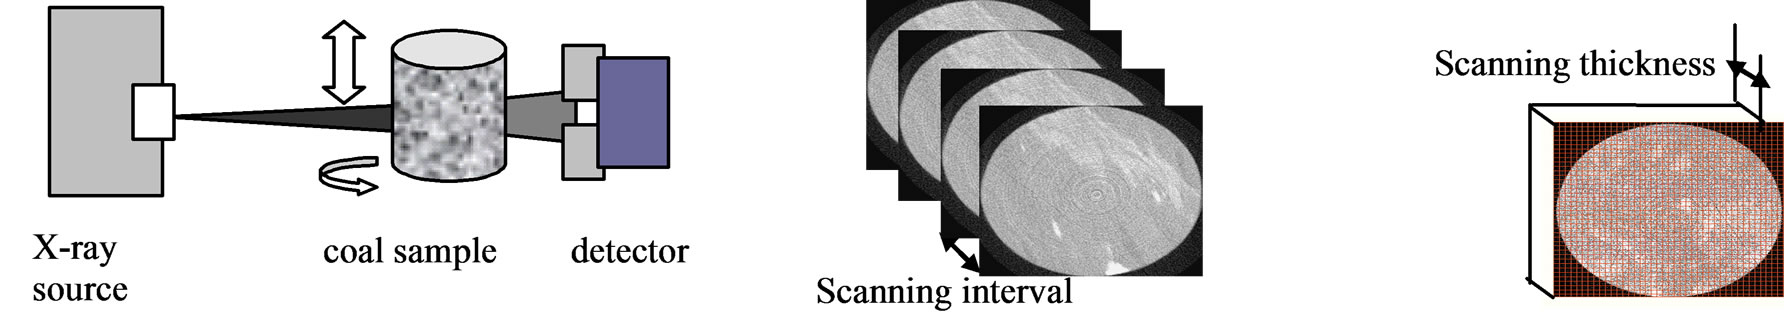
The CT scanning device used in these experiments is ACTIS 300-320/225 Industrial CT which is made by BIR Company. The principle of CT scanning is shown in Figure 2. The X-ray passes through the specimen, and the attenuation of signal is received by the detector. The specimen rotates 360 degrees while scanned, and with each angle the detector obtains corresponding signal, finally, image reconstruction is made by mathematical transformation using all angles’ signal. X-rays is cone beam with a certain width, and the images obtained of every layer have a certain scanning thickness. Therefore, every image reflects average value of linear attenuation coefficient inside the material with a certain thickness. The pixel with certain thickness is called voxel. The linear attenuation coefficient of a sample composed by several materials, regardless of whether it is a compound, mixture or solid solution, has no relationship with material aggregation, and is equal to sum of linear attenuation coefficient of different components contained in the material multiplied by mass percentage of the same ingredient in the sample. Usually, it is difficult to measure the material’s attenuation coefficient directly, and CT number is used to quantitatively describe the attenuation. With reference to a certain proportion, the CT number can be converted into grey value, which is shown as CT image. The material linear attenuation coefficient has approximate linear relationship with the density of the material, so CT image approximately reflects the changes of material density [9] in our experiment, the CT image is 16- bit grey image, and the image size is 1024 × 1024 (Pixels).
2.3. Experiment Procedure
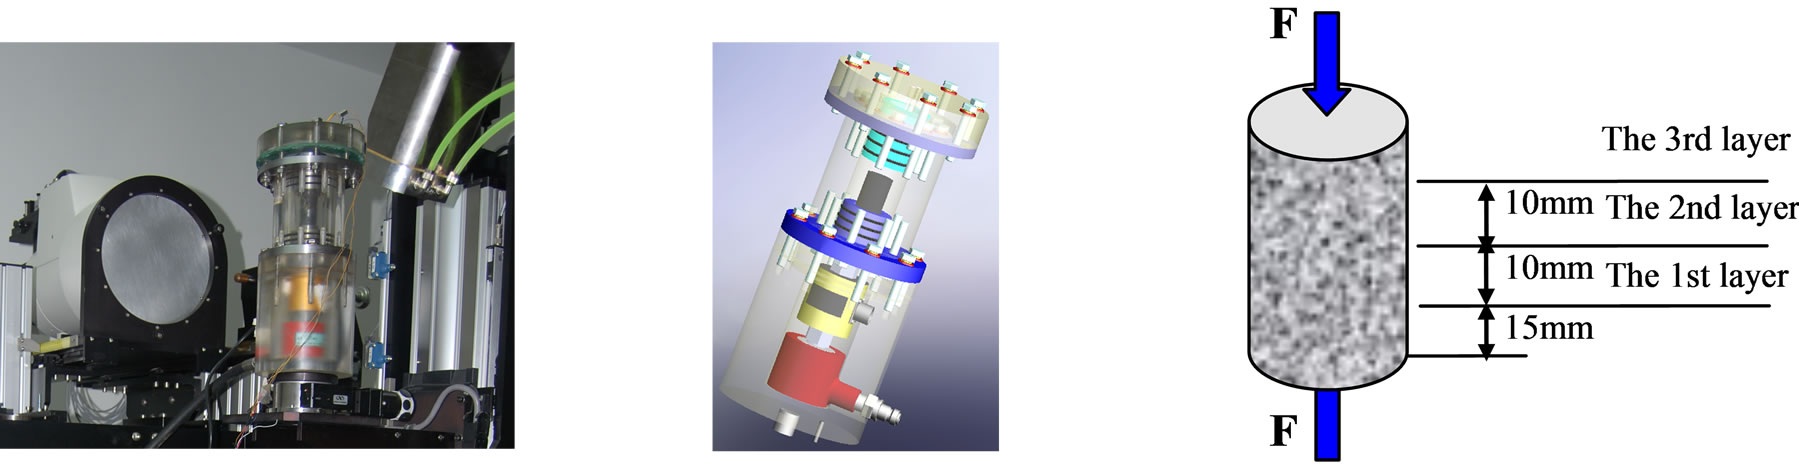
The coal sample was made into the specimens with size of Ф 25 × 50 mm. Strain gauge was stuck on the middle of specimens along the axial direction to measure the strain value during loading. The experiment setup is shown as Figure 3(a). Figure 3(b) is the loading cell into which the sample was put. During scanning, both end faces are compressed by loading along the sample axis, which is shown in Figure 3(c).
When the initial preparation and calibration procedures required by the CT scan equipment had been completed, the loading cell with sample was placed on the vertical turntable, the doors of protection room were closed and the testing commenced. X-rays were generated at 200 kV and 250 μA. During every loading step, three sections were scanned. The scanning positions are shown in the Figure 3(c). The slice thickness was 0.1 mm, and the field of view was 30 mm. The voxel size is approximately 29 μm × 29 μm × 100 μm.
 (a) (b) (c)
Figure 2. Industrial CT imaging theory schematics. (a) Industrial CT schematic diagram; (b) CT serial images; (c) CT image of each layer.
 (a) (b) (c)
Figure 3. Experiment setup. (a) Setup; (b) Loading cell; (c) Scanning position.
3. Results
3.1. CT Image of Coal Sample
A slice grey image of coal sample is presented in Figure 4(a). The zones of low X-ray attenuation (generally low density) are lower in grey value than zones of high X-ray attenuation (generally high density). Hence, the cracks and pores show as darker shades than do zones that contain both coal particles and pore. The white zones are in high grey value, which contain the other minerals with high density.
The Grey histogram of the slice is showed in Figure 4(b). The histogram has only single wave crest, from which it is difficult to distinguish the crack zones from the other zones. On the other hand, there should be a lot of micro-cracks in each voxel according to the mercury intrusion testing. For these micro-cracks or micro-pores, the CT cannot distinguish them with limited resolution. But the quantities of micro-cracks or micro-pores in voxel will influence the grey value of the voxel, we can acquire the porosity of every voxel from grey value. So in CT image, there are two kinds of crack or pore, one is large crack or pore which can be distinguished by CT equipment, and the other is micro-crack or micro-pore which is too small to be observed.
Based on the coal CT image features, we can define two types of porosity. One type of porosity, called surface porosity, is defined to describe the variant of large crack or pore, and the other type of porosity, called voxel porosity, is defined to describe the variant of micro-crack or micro-pore. How to calculate these two types of porosity is presented as following.
3.2. Surface Porosity Calculation Method
To calculate the surface porosity, thresholding techniques to segment the images are often used. Many automatic thresholding techniques are efficient when the grey level histogram is bi or multimodal but not in the case of unimodal. More sophisticated methods have been developed. In porous rock media, the geometry of cracks or pores space is more complex and irregular, therefore the segmentation is more complicated. Taud [10] developed the grey level method based on Digital Terrain Model (DTM) theory. In this method, the CT image is symbolized as a Digital Terrain Model. The grey level in the DTM image is related to the altitude or elevation terrain. The porosity can be calculated as follows:
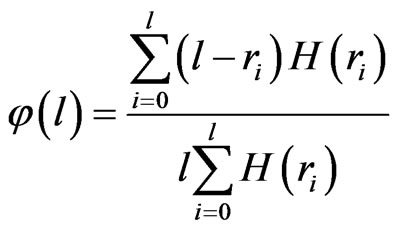 (1)
(1)
where  is the pore distribution function,
  is a grey level related to the altitude,
 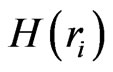 is the histogram of the image with grey levels in the range
 ,
,  is the Minimum grey value,
  is the maximum grey value and l is grey level in the range
 .
.
The Figure 4 shows the  curve with grey level l. The
  curve decreases until the minimum in the
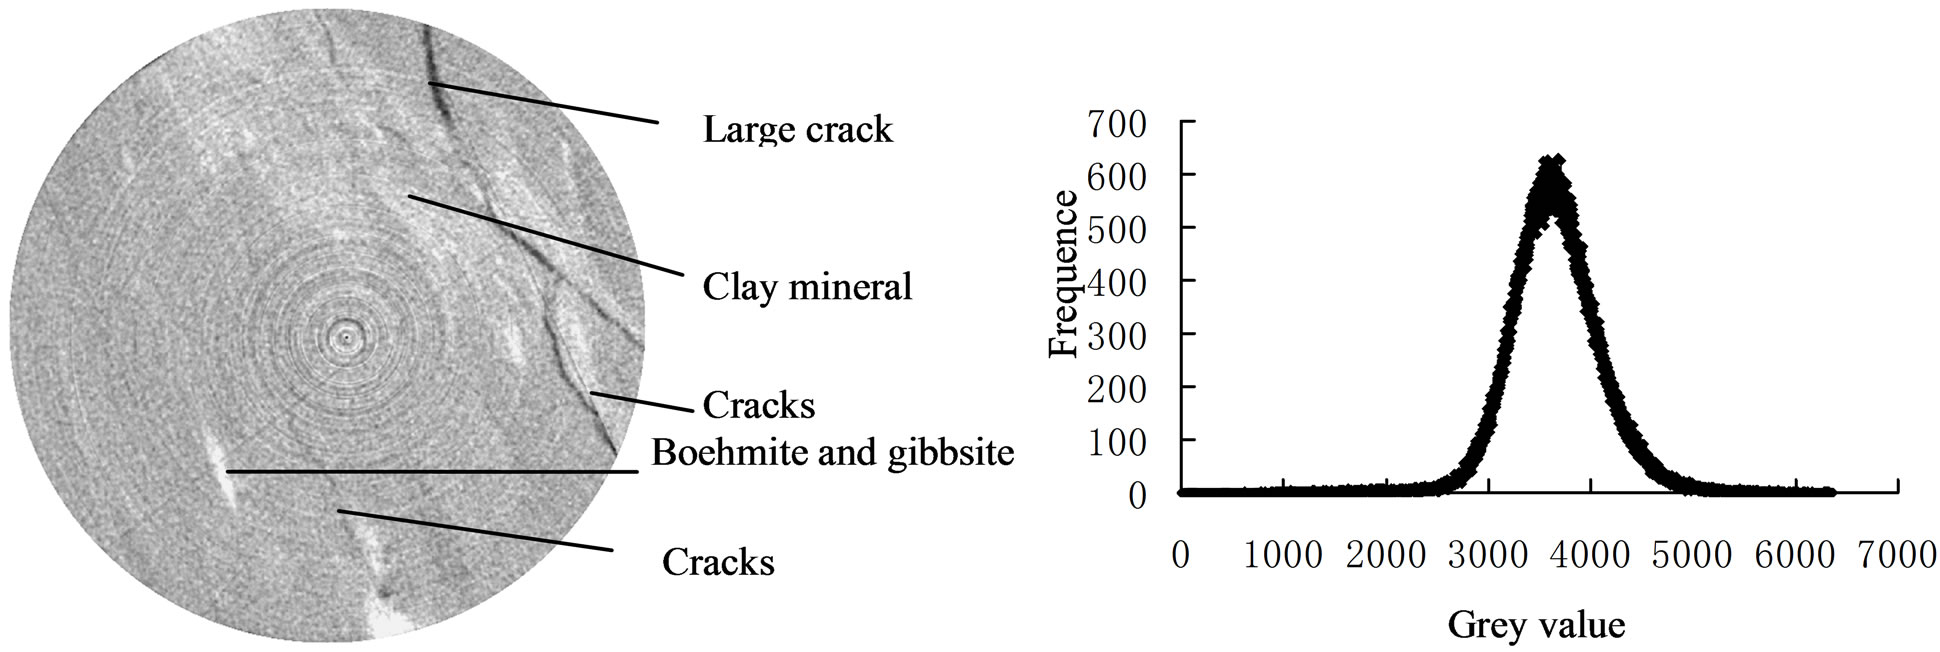
Figure 4. CT image of coal and grey scale histogram. (a) CT image of coal sample; (b) Grey scale histogram.
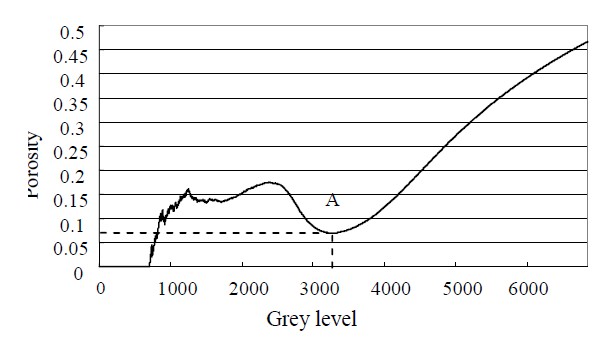
Figure 5. Porosity distribution.
curve, and then,  increases almost equally reflecting the effect of few high isolated points. The porosity estimation corresponds to the minimum of the
  distribution. In the Figure 5, the value of the minimum point A is the porosity.
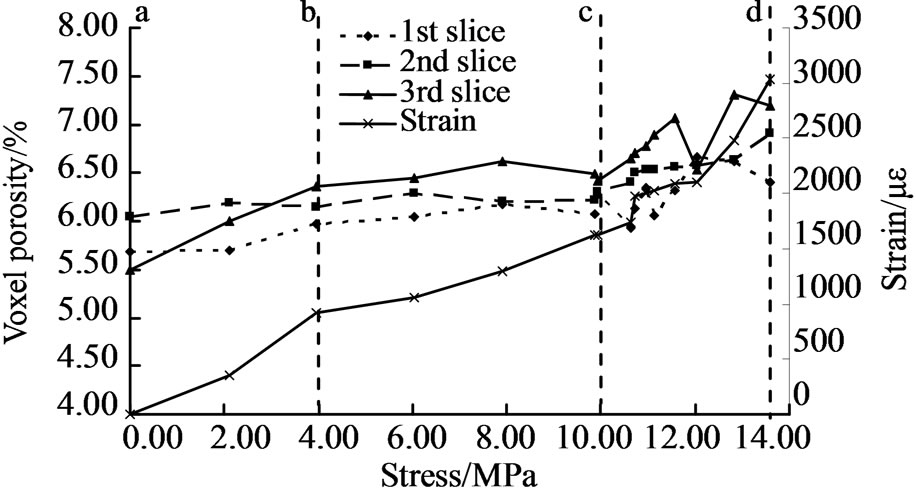
This method was applied to calculate the surface porosity of three scanning position of the specimen under different loading steps, and the relation curve between surface porosity and stress is shown in Figure 6. The Stress-strain curve is also shown. The curve clearly reflects three stages of internal damage in the sample, the first stage (a-b, compression phase), in which the specimen was compressed with surface porosity decreasing; the second stage (b-c, elastic phase), in which the strain increased approximately in linear, and the specimen produced elastic deformation with little change of surface porosity; the third stage (c-d, damage phase ), in which the strain grew fast, many tiny crack were produced, expanded rapidly, and the porosity dramatically increased.
There are four images in Figure 7 which respectively correspond to stress states of four points a, b, c, d in Figure 6. Figure 7(c) shows that tiny cracks have appeared in the coal sample. From b to c, with tiny cracks appearing, the average change of surface porosity in three layers is 0.64%. From point c to point d, the average porosity change is 2.00%.
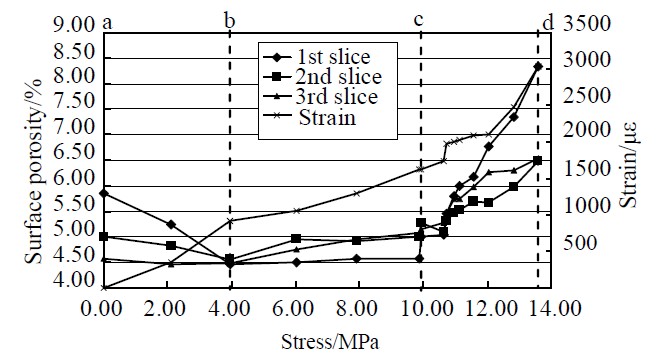
Figure 6. Porosity under different loading.
3.3. Damage Quantitative Calculation in Voxel Scale
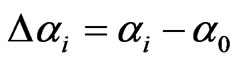
Coal sample is composed of coal matrix, micro pore (filled with air) and impurity (mineral). A voxel of CT image is taken as the research object, in which there are coal matrix, pore and mineral. α0 is defined as pore percentage of each voxel at the initial state. For sake of discriminating from surface porosity, the porosity inside a voxel is called voxel porosity. H is average CT number of the coal matrix, αi, Hi are respectively average CT numbers of voxel porosity and matrix at i scanning state, the following relation is obtained [11]:
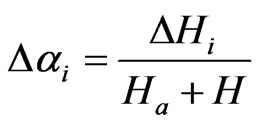 (2)
(2)
where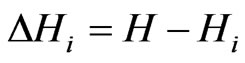 ,
,  ,
,  is the CT number of air.
By the formula (2), the evolution chart of micro-pore change within every voxel can be obtained. In industrial CT, grey image is obtained directly, and grey value has a linear relationship with CT number. If G and Gi are respectively used for denoting grey values of CT image for coal matrix and hybrid at i moment, Ga denotes the grey value of air, the formula (2) can be rewritten as:
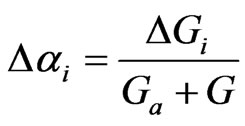 (3)
(3)
where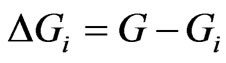 .
.
In order to calculate ΔGi, image subtraction operation is needed. But due to the specimen deformation under loading, the position of the same voxel is constantly changing at different stage [12]. If coal matrix without pore is taken as the initial state, the voxel porosity can be obtained directly by the results of (2) or (3). Practically non-porous coal is difficult to obtain. In order to determine grey value of coal matrix, we use water, ethanol, olive oil and glycerin, whose density are known, as the reference samples. The grey values of those samples are obtained in the same conditions with coal sample scanning. The relationship between density and grey value is obtained, and the density of coal matrix is measured by mercury injection method. The coal matrix grey value is acquired by interpolation.
According to the above method, voxel porosities of CT images of three different scanning positions are calculated. Reference to coal sample composition and grey curve of image, voxel porosity is divided into three intervals, namely  (only air in the voxel, corresponding to pore larger than a pixel scale), 43.00 ≥
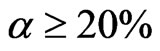 (coal matrix and air in the voxel) and α < 20% (coal matrix, minerals and air in the voxel). In Figure 7, the voxel porosity change in three position are given in different stages. As it can be seen, voxel porosity is clearly divided into three phases with increase of stress. On the compression phase, the number of voxels at the range of
  and
and  reduces, while the number of voxels with voxel porosity less than 20% increases slightly, which means that coal sample was compressed. In elastic stage, the number of voxels of each range changes in the small scope, with little change. In damage phase, the number of voxels with volume porosity greater than 43% increases rapidly, the number of voxels at the range
 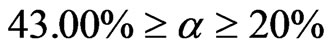 reduces, and the number of voxels with α < 20% increases slightly, which indicates that some pores in the range of 43.00 ≥ α≥ 20% develop to larger pores than a pixel scale, while some pores are filled, leading to the increase of voxel number with α < 20%.
4. Discussion
According to the mercury intrusion testing, there are different size pores in the coal. The CT equipment resolution is limited. The pore size should be more than one pixel which could be distinguished by CT equipment. In our experiments, the pores whose size are more than  can be distinguished.
The Surface porosity reflects the number of pore whose size is bigger than one pixel. During compression,
 (a)
(a)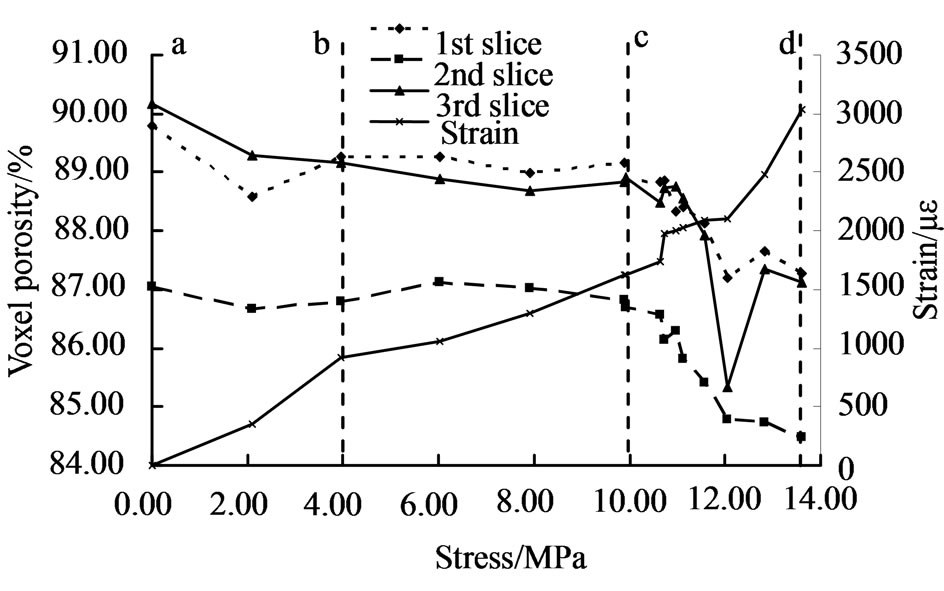 (b)
(b)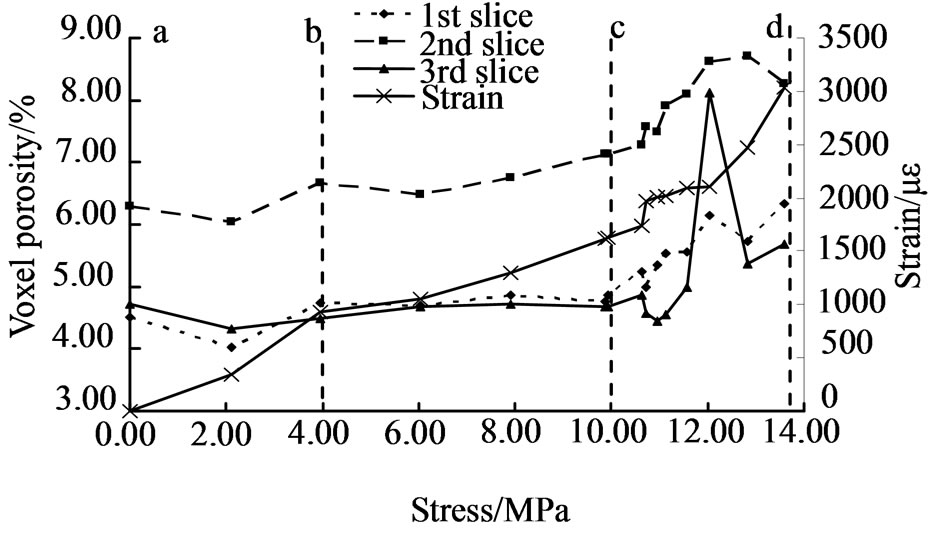 (c)
(c)
Figure 7. Variation of voxel porosity. (a) α < 20%; (b) 20% ≤ α < 43%; (c) α ≥ 43%.
the surface porosity increased dramatically until the coal samples were damaged. The pore development cannot be indicated. From the voxel porosity, the porosity in each voxel is calculated, which display porosity development of every voxel. These two porosity calculation methods can be combined to explain the damage process.
In this paper, the intervals of voxel porosity are defined according to the composition and grey value. Analysis of porosity of voxel scale will change with scanning thickness, in theory, when the scanning thickness tends to zero, the voxel is pixel, then both the porosities are consistent. But in fact, the CT scan always has a certain thickness, by reducing thickness, voxel scale analysis precision can be improved.
5. Conclusions
1) In the coal samples, there are different scale pores. The resolution of CT is limited, which can distinguish the pore bigger than one pixel. The CT image reflects density variation of a slice with thickness, and the grey value can indicate the porosity variance within one voxel. The surface porosity is defined for analyzing damage which is larger than a pixel, while voxel porosity can be used for analyzing pore variance inner scanning layer thickness, which can better reflect the characteristics of CT image.
2) The damage in the coal samples under uniaxial loading can be evaluated by surface porosity in pixel scale, and also be calculated by voxel porosity. With the load growing, the variance of two kinds porosity can be divided into 3 phases: compression phase, elastic phase and damage phase. These porosities indicate the damage development from different scale. In this paper quantitative calculation method of porosity for coal sample under different scales is given only, how to combine the two scales reasonably to describe damage propagation of coal rock will be future researched.
6. Acknowledgements
This work was financially supported by National Basic Research Program of China (973 Program) (2010CB- 732002, 2010CB226804), Central High Education Basic Research Project (2009QM02).
REFERENCES
- J. S. Frederik, V. Frederic and S. Rudy, “Quantitative Characterization of Coal by Means of Microfocal X-Ray Computed Microtomography (CMT) and Color Image Analysis (CIA),” International Journal of Coal Geology, Vol. 34, No. 1-2, 1997, pp. 69-88. doi:10.1016/S0166-5162(97)00011-6
- C. O. Karacan and E. Okandan, “Adsorption and Gas Transport in Coal Microstructure: Investigation and Evaluation by Quantitative X-Ray CT Imaging,” Fuel, Vol. 80, No. 4, 2001, pp. 509-520. doi:10.1016/S0016-2361(00)00112-5
- S. Mazumder, K.-H. A. A. Wolf, K. Elewaut and R. Ephraim, “Application of X-Ray Computed Tomography for Analyzing Cleat Spacing and Cleat Aperture in Coal Samples,” International Journal of Coal Geology, Vol. 68, No. 3-4, 2006, pp. 205-222. doi:10.1016/j.coal.2006.02.005
- G. S. Yang, D. Y. Xie and C. Q. Zhang, “The Quantitative Analysis of Distribution Regulation of CT Values of Rock Damage,” Chinese Journal of Rock Mechanics and Engineering, Vol. 17, No. 3, 1998, pp. 279-285.
- G.-Z. Yin, G. Huang and G.-F. Dai, “Bifurcation and Chaos Analysis of Coal and Rock Damage under Uniaxial Compression Based on CT Values,” Chinese Journal of Rock Mechanics and Engineering, Vol. 27, No. 9, 2006, pp. 1465-1470.
- Y. B. Yao, D. M. Liu, Y. Che and D. Z. Tang, “NonDestructive Characterization of Coal Samples from China Using Microfocus X-Ray Computed Tomography,” International Journal of Coal Geology, Vol. 80, No. 2, 2009, pp. 113-123.
- J. Lemaitre, “Damage Measurement,” Engineering Fractures Mechanics, Vol. 28, No. 5-6, 1987, pp. 643-660. doi:10.1016/0013-7944(87)90059-2
- G. S. Yang, D. Y. Xie, C. Q. Zhang, et al., “Analysis of the Relation between the Damage Variable and CT Value of Rock Material,” Mechanics in Engineering, Vol. 20, No. 4, 1998, pp. 47-49.
- C. Z. Zhang, Z. P. Guo, P. Zhang, et al., “Industrial Computer Tomography Technique & Theory,” Science Press House, Beijing, 2009.
- H. Taud, R. Martinez-Angeles, J. F. Parrot and L. Hernandez-Escobedo, “Porosity Estimation Method by X-Ray Computed Tomography,” Journal of Petroleum Science and Engineering, Vol. 47, No. 3-4, 2005, pp. 209-217. doi:10.1016/j.petrol.2005.03.009
- B. Ao, X.-B. Zhao and D.-H. Zhang, “Relation Analysis between Volume Percent of Crack Defect and CT Number,” CT Theory Applications, Vol. 15, No. 2, 2006, pp. 64-68.
- L. M. Fan, L. M. Mao and W. H. Ding, “Formulation Mechanism of Half-White Black Circle Images of Rock Density Damage Increment with CT and Its Registration and Correction,” Chinese Journal of Rock Mechanics and Engineering, Vol. 26, No. 3, 2007, pp. 567-572.