Computational Water, Energy, and Environmental Engineering
Vol.06 No.03(2017), Article ID:76752,24 pages
10.4236/cweee.2017.63015
Solar Radiation Data for the State of Jalisco and Guadalajara Metropolitan Zone, Mexico
H. Héctor Ulloa-Godinez1, E. Mario García-Guadalupe1, U. Hermes Ramírez-Sánchez1, C. Jorge Regla-Carrillo1, L. Aida Fajardo-Montiel2
1Institute of Astronomy and Meteorology of the University Center of Exact Sciences and Engineering, University of Guadalajara, Jalisco, Mexico
2University Center of Tonalá, University of Guadalajara, Jalisco, Mexico
![]()
Copyright © 2017 by authors and Scientific Research Publishing Inc.
This work is licensed under the Creative Commons Attribution International License (CC BY 4.0).
http://creativecommons.org/licenses/by/4.0/


Received: March 3, 2017; Accepted: June 4, 2017; Published: June 7, 2017
ABSTRACT
Energy development plans involving the use of solar energy are very beneficial from an environmental perspective. Its impacts are specific to geographic location; taking advantage of the solar energy potential basically depends on reliable estimates of the climatological amount of solar radiation received at the surface, which is a complex function of meteorological and environmental factors. Obtaining solar radiation data is essential for local development, to characterize them, there are several cutting-edge methods and technologies. One of them is the use of satellite images with high resolution. The aim of this paper is to assess the climatological aspects of incoming solar radiation in clear sky conditions in the State of Jalisco, Mexico and Guadalajara Metropolitan Zone. The results are intended to stimulate the use of solar radiation as an alternative energy source in an area where heavily relying on fossil fuel combustion.
Keywords:
Solar Radiation, State of Jalisco and Guadalajara Metropolitan Zone

1. Introduction
The planet Earth is going through a critical moment in environmental matters; the constant emission of Greenhouse Gases to the atmosphere, global and local climate change, the vulnerability and climatic variability coupled with sprawl of cities, appear to be out of control. The industrial development of the 19th century, the dependence on fossil fuels of the past century and today, they have caused society to leave the benefits that nature has provided. In this sense, one of the main concerns of governments around the world is the search for energy resources that allow its population an integral development [1] .
In this context, urban growth, technological development and the socio-eco- nomic structure are demanding greater consumption of energy. If this trend continues, reducing planetary fossil fuel reserves estimated at only 40 to 60 years; so, in a short time, these energy sources will come in stage of exhaustion and increase in prices [2] .
According to the above, the current energy model based on excessive consumption of fossil fuels requires a radical change. While it is true that the concern of the governments of the countries is to provide energy to the society, so must the environment. Given the situation, in recent years, it has been observed that large cities begin to experience changes in the way of using conventional technologies based on fossil fuels with renewable energy; including the use of solar heaters and/or photovoltaic cells.
In fact, within the principles of sustainability (economic, social and ecological) nature, it is based primarily on renewable solar energy, in other words, getting energy directly from Sun or indirectly via biomass, the movement of water and wind, as well as other forms of renewable energy such as geothermal in the interior of the planet. Referring to this, studies show that with continued government support, solar energy can provide 20% of the world’s electricity by 2020 and 50% by 2050 [3] .
Different countries of the world are making efforts to promote its use so much, so that those who are not oil producers have significant experience regarding the use of solar potential based technologies. Use of them is a strategy that most developed countries demands from local and international aspects; this provides the opportunity to guide activities in modern projects of governmental and social participation, business and the exploitation of the natural resources of the territory.
Some cities are advancing in the production of renewable energies, like solar. An example to meet the required demand and achieve sustainable development for its people is Los Angeles city, California; this is the most important potential market of renewable energies (solar) in United States and one of the most promising in the world. This city is located to the Southwest and receives a fairly significant irradiation average of between 1 kW/m2. These conditions have resulted in that both the State authorities and the private sector continue to create a prospect of certainty for their promotion and development [4] .
Likewise, Spain has the right conditions for the provision and use of solar energy; indeed, it is one of the European countries that have one of the highest radiation surfaces [5] . Their situation with regard to other countries of the geographical area is comparatively favorable. Just to cite one case, the city of Madrid receives a daily average radiation between 4.6 and 5.0 kW/m2; same that it is used usually for domestic water heating (solar heating) and for electricity generation (photovoltaic).
Precisely, recent studies show that solar energy is the greater natural resource of utilization since it provides more energy in one hour to our planet that the entire world’s population consumes in a year. In this context, if Sun is the main energy source, this can be stored and available for the user’s demand, i.e., requiring his capture, conversion and storage, compared to fossil energy, the savings can be significant [6] .
However, the substitution of conventional energy production to renewable solar not can be popularize and imitate in any time and space under the same conditions and characteristics. Nor it occurs spontaneously, by itself or by decree. On the contrary, it is a process that has occurred (since the first oil crisis) on concern countries in obtaining energy resources that enable people to an integral, endogenous and specific development for each territory. For this purpose, it requires the active participation of different stakeholders, agreements and common interests in energy projects.
In terms of obtaining accurate data of solar radiation, this information becomes important for local development; however, worldwide data are scarce, due to the high costs of the instruments of measurement, accuracy and maintenance. Therefore, characterize it reliably without terrestrial information required to have or use other current technologies based on satellite images that allow high resolution to estimate its amount, considering its terrain and climatic characteristics.
In relation to the above issues raised, the objective of this study is to obtain, through the management of data from satellite images, the main results on the amount of solar radiation in the State of Jalisco, Mexico and Guadalajara Metropolitan Zone (ZMG). The results of this analysis can be motivation to the development and use of solar energy as the primary energy source in the region.
2. Antecedents
The models for the estimation of solar radiation are needed as references to understand the geometric and environmental factors that affect the flow of solar radiation energy and make estimates where there is global irradiation data and its components. The first models developed determined the global solar radiation starting to meteorological variables; including humidity, precipitation, cloud cover and effective sun hours. To become more common measurement models were developed to determine the direct and diffuse components. Currently they stand the methods for estimating the solar radiation and its components from the data provided by satellite imagery.
In this case, geostationary satellites carry out the monitoring of the atmosphere and cover of clouds continuously at different time scales (e.g., hourly and monthly), covering large regions. Regarding the Geostationary Operational Environmental Satellite (GOES) has the advantage of providing insolation data on a continental scale with high spatial and temporal resolution; generates solar radiation maps with a detailed resolution on specific regions. Such maps provide an excellent opportunity to study the climate and surface energy [7] . Therefore, this makes them a suitable source of information for integration into Geographic Information Systems (GIS).
The estimating from models based on satellite data, as any other technique has a margin of error conventionally considered, a mean square error between 20% and 25%, when compared with measurements carried out by stations located at specific sites. It is for this reason that should be noted the importance of terrestrial networks (stations distributed in the observed territory) as an essential source of information [8] . In addition, knowledge of the solar radiation is crucial for obtaining and implementing different models; among them, evaporation of water and efficiency in irrigation systems, crop growing and energy efficiency, among others.
Several studies have shown that countries located within the so-called Global Solar Belt (CSG) represent about 75% of the world population and 40% of the global electricity demand (Figure 1) [9] . However, high levels of solar radiation, the installed capacity in these countries only makes up only 9% globally [10] . A study published in 2010 reported that the countries located in this belt (between the latitudes of ±35˚ with respect to the Equator) have solar potential which still not been effectively exploited. A study published in 2010 reported that the countries located in this belt (between the latitudes of ±35˚ with respect to the Equator) have solar potential which still not been effectively exploited [11] .
At the national level, Mexico is geographically located within this CGS; potentially suitable surface for utilization. Through the elaboration of documents such as the Atlas of Solar potential (Figure 2) [12] and wind of the Mexican Republic, the Secretary of Energy (SENER) encourages the use of renewable energies. These instruments are for public use and provide information related to the amount of received solar radiation and wind potential in the territory; In addition, they can be the beginning of regional and local studies [13] .
In this context, its location on the American continent, geography, latitude
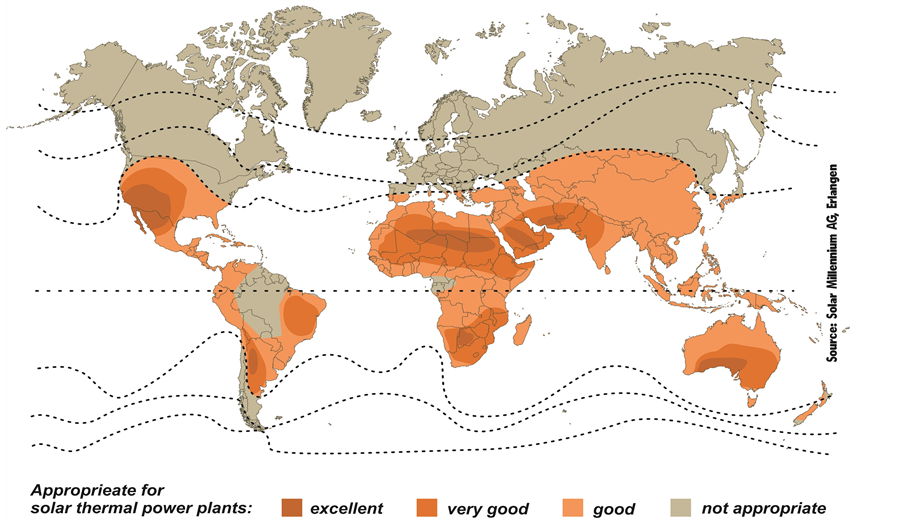
Figure 1. Global solar belt [9] .

Figure 2. Annual average solar global radiation for Mexico [12] .
and altitude, the influence of the tropical, dry and temperate climates, particularly the predominance of dry weather in approximately 50% of the country, make conducive the uptake of this natural source of energy. Its tropical climate with around 30% and the warm climate with 20%, complete 100% of the analysis of the Mexican territory [14] . In this respect, the Federal Government has developed a rural electrification project in the country with two main objectives; 1) integrate in rural areas sustainable and efficient energy services, i.e., using solar thermal and photovoltaic, and 2) improve the quality of life of the inhabitants of those areas. Based on the geographical location and mentioned by Thoma, et al. [14] in solar energy, Mexico is located within the first three places in potential worldwide. Still, Mexico was evaluated in 18th place according to the index of investment attractiveness of renewable energies [15] . However, the conditions for the exploitation of solar energy are suitable with a higher national average 5 kWh/m2.
In this sense, a study by Diaz [16] on direct normal solar radiation in the State of Baja California, Mexico, during the year 2012 shows that this area of the North of the country has great potential for energy capture, being the months of March to September the most significant with values above 5 kWh/m2-day (Figure 3).
Meanwhile, Colotlán (town close to the ZMG) shows an annual average of 5.9, Lagos de Moreno (located northeast of the state) 5.5 and Puerto Vallarta (western Jalisco) 5.5 kWh/m2-day, respectively. Figure 4 shows its behavior during the course of the year in the above regions, highlighting the months of March, April and May as the most relevant [17] .
Moreover, in relation to the registered studies using information from the

Figure 3. Monthly average solar radiation for Baja California [16] .
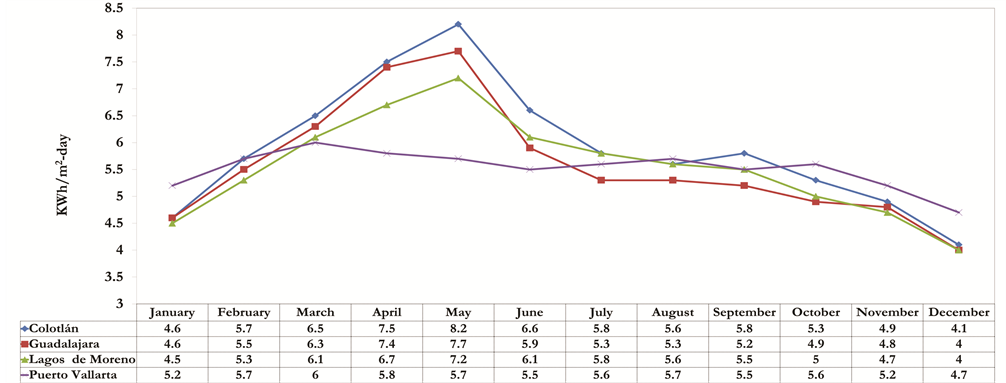
Figure 4. Monthly average solar radiation for some municipalities in Jalisco [17] .
network of stations, González et al. [18] shows relevant results regarding the amount of incident solar radiation on surface and day length in the ZMG (Figure 5).
It should be noted that in surface observations are scarce in rural areas and when they have, are just specific examples which provide little information on the spatial variability of the solar radiation. Measurements of clouds using Earth satellites have the potential to complement surface observations, providing information on incoming solar radiation at large spatial and temporal scales [19] .
3. Study Area
The State of Jalisco (Figure 6) is located in west-central Mexico. Its extension is 80.137 km2, corresponding to 4.1% of the national territory. To the north, Jalisco is bordered by the states of Nayarit, Zacatecas and Aguascalientes, to the east by San Luis Potosi, Guanajuato and Michoacán de Ocampo, to the south by Michoacán de Ocampo, Colima and the Pacific Ocean, and to the west by the Pacific Ocean and Nayarit. Its geographical bounding coordinates being 22˚45'N -

Figure 5. Average monthly solar radiation and average monthly duration of day in the ZMG [18] .

Figure 6. Geographical location of the State of Jalisco and Guadalajara Metropolitan Zone.
18˚55'N and 101˚28'W to 105˚42'W [20] .
Jalisco is the fourth most populous federal entity in Mexico and one of the most developed States in the country in terms of its economic, commercial and cultural activities. Its climatic features show great diversity ranging from sub- humid warm to the semidry temperate, stressing the warm sub humid with rains in summer. It presents great contrasts due to the formation of reliefs and the influence of water bodies, both marine and lacustrine. All these conditions influence in particular in the development of the entity.
Added to this, the State of Jalisco occupies one of the surfaces of the country with the greatest beauty and abundance of natural resources, a situation that makes it conducive to the development of ecotourism projects. Its outline goes from swathes of coastline, areas with high mountains and tropical jungles. Its climatic conditions make it a highly conducive to the development of commercial aquaculture of tropical and subtropical zone.
In reference to the Guadalajara Metropolitan Zone, this is at the center of the State of Jalisco; its extreme coordinates are: between 20˚46'00'' and 20˚32'08'' of North latitude, 103˚12'30'' and 103˚29'00'' of West Longitude about and an altitude of 1.540 meters above average sea level. It comprises the municipalities of Guadalajara, Tlaquepaque, Tonalá, Zapopan, Tlajomulco de Zuniga, El Salto, Ixtlahuacán de los Membrillos and Juanacatlán.
In terms of its orography, the ZMG is located in the basin of the Valley of the Grande River of Santiago, in the valleys of Atemajac and the plain of Tonalá, between the mountains of the Sierra Madre Occidental and the Neovolcanic axis. The surrounding mountainous reliefs are: Northwest, La Sierra de San Esteban; to the Southeast, La Serranía de San Nicolas and mountain sets Cerro Escondido-San Martin and El Tapatio-La Reyna; to the South, Cerro del Cuatro-Santa Maria-Gachupin-Tesoro; and to the West, the forest “La Primavera”. It should be emphasized that the profile of its relief and the atmospheric basin lead to stable weather conditions [1] [21] .
The municipality of Guadalajara is the most populous metropolitan area with about 1.5 million inhabitants; Zapopan is followed with little more than 1.2 million, Tlaquepaque with more than 600 thousand, Tonala with more than 470 thousand, Tlajomulco de Zuniga, with more than 400 thousand and jump with a little more than 137,000 inhabitants (Table 1). In contrast, Ixtlahuacan de los Membrillos and Juanacatlan are municipalities with the lowest population; with around 41 thousand, and with more than 13,000 inhabitants, respectively [22] .
Climate
The Guadalajara Metropolitan Zone is characterized by the influence of a temperate climate subhumid with rains in summer. The interval between March and May corresponds to the dry and hot season; then, just in the transition period May-June when rainy season starts, same may be extended until October (summer rains). This range of rainfall is characterized by the presence of storms with intense electrical activity and significant winds that at times be accompanied by hail (severe local storms).

Table 1. Demographic information and surface of the guadalajara metropolitan zone.
In relation to climatic variables, the period from March to May observed the warmest days with maximum temperatures above 31˚C; even these can also register in February. An outstanding fact is the extreme maximum temperature recorded on May 9, 2003 (39˚C). Towards the seasonal period of autumn-winter rains are reduced and experience a transition the passage to sunny days and cold north winds. In winter cycle occasional frosts may occur, particularly in peripheral locations from ZMG, with temperatures up to −1.5˚C during the coldest nights.
In months of December, January and February is when present influence the lower temperatures. Another significant fact is the extreme minimum temperature observed on December 14, 1997 (−7.0˚C). A particular experience was the snowfall for the month of December 1997 in the city of Guadalajara; a fact abnormal, whereas the previous one took place on February 8 of 1881; that is, after 116 years. In resume, climate two typical characteristics are obtained, 1) the northern climate is warmer, colder and less rainy, and 2) the southern climate is less warm, less cold and wettest (Table 2) [23] . In addition to the regional climate in case study, data from ground stations to be considered in the analysis of
Table 2. Average climatic parameters for Guadalajara (1951-2015).
The nomenclature of 01 - 12 indicates the months of the year from January to December. Temperature: in ˚C [23] .
the solar potential is that in 365 days of the year, 270 days have an average of 9 hours of sunshine [24] .
4. Data and Methods
A widely methodology used in obtaining information solar radiation was developed by Stewart et al. [25] , who estimated solar radiation from visible band data obtained by the GOES satellite over northwestern Mexico; the results obtained allow comparisons against ground measurements showing positive correlation, especially in the months of low cloud cover. In the present study, satellite imagery is the primary tool used. The information for the State of Jalisco was obtained through remote sensing satellite; among them, the digital elevation model (DEM) Aster Global Digital Elevation Model (ASTER GDEM v2.0) [26] .
It was delimited the area of work towards the four cardinal points by strips of up to 1.5 degrees of arc. In doing so, they set data from sources whose territory was spatial resolution of a degree of arc. Interpolations were calculated and the projections of shadows were integrated from Nearest Neighbor method. The parallelogram work was limited to between 17˚ - 24˚ north latitude and 100˚ - 107˚ west longitude. Each cell on the ground is 290 m (east to west) and 310 m (north to south) approximately. The calculation of annual averages was obtained by monthly averages and weighted by the number of days in each month.
The elaboration of maps of insolation and hours of sunshine for cloudless sky used the MDE; the sections of the ASTER GDEM joined v2.0 and completed the values corresponding to the surface of the Pacific Ocean (elevation 0 masl) that have null values in the original data. The resulting raster was added using the arithmetic mean at a resolution of 10 arc seconds. Information global insolation incident on a horizontal surface corresponded to the periods 1983 to 2005 and 2006 to 2011 [26] .
5. Results and Discussion
The monthly maps for Sun hours for cloudless sky and the annual average, both for the State of Jalisco and its Metropolitan Zone (Figure 7 and Figure 8) were obtained. The results highlight the need to use the solar potential as a sustainable alternative energy. In this context, the months of November, December, January and February show values of 9 to 10 average hours daily of sunshine; that the geographical location of the study area corresponds to the dry and cold season (autumn-winter).
Similarly, the months of March, April, May and June, reported about 11 hours of sunshine per day, with a gradual advance of up to 14 hours, being most significant month June of this interval. Considering the astronomical seasons, this period corresponds to the cycle of spring and part of the summer.
Likewise, during the month of July is observed a slight decline in the number of hours of sunshine (13) in relation to the previous month, not reflecting big difference with August month (between 12 and 12.5 hours). For its part, the months of September and October experience a reduction of not less than 10

Figure 7. Average monthly and annual hours Maps Sol for Jalisco state.

![]()
![]()
![]()
![]()
Figure 8. Monthly and annual maps of average Sun hours for the Guadalajara metropolitan area.
Sun hours. These results show a viable option for harnessing inexhaustible energy. In this case, the period is located in the season of summer and early autumn. The regions of the Centre-East, and coast of the State, are the areas that logged more hours of sunshine.
The topography of the place has a transcendent role, since in some areas these periods may vary by a domain of shadows from the mountainous surfaces. Finally, in the analysis of his annual average, reported up to 12 hours of Sun, highlighting the East and Central regions and coast of Jalisco; while the ZMG shows a domain between 11 and 12 hours. These results are related to those reported by González et al. [18] .
Similarly, monthly and annual average global maps for insolation in clear sky, both for the state of Jalisco and his metropolis (Figure 9 and Figure 10) were obtained. Precisely, the results obtained reported values of 6 kWh/m2-Day for the month of November, 5 in December, a slight increase in January (6) and between 6.5 and 7 for the month of February, respectively; months that correspond to half the stations autumn and winter.
Likewise, in the month of March (transition winter-spring) begins to be observed an increase in the values of solar radiation in the range of 7.5 to 8 kWh/ m2-Day. In this order, during the months of April, May, June, July and August are reported ranges from 8 to 9.5 kWh/m2-day. These results are for the period of spring and early summer. The months of May, June and part of July can be identified as the most significant in the study area.
![]()
Figure 9. Average monthly and annual global insolation maps for Jalisco.
![]()
![]()
![]()
![]()
![]()
Figure 10. Monthly and annual maps of average global insolationfor Guadalajara Metropolitan Area.
In this context, during the month of September the results show a period of decline ranging from 7.5 kWh/m2-day and 6.5 in October in some areas of Jalisco. These months correspond to the period of summer-autumn. The regions of the middle-east and the coast of the State are those that present higher levels of solar radiation; it should be noted that the relief of the territory intervenes with the domain of shadows that the mountainous systems favor.
Finally, considering the comprehensive analysis by the average annual insolation for clear sky throughout the state, values between 7 and 8 kWh/m2-day are reported. Similarly, the GMA has a similar trend. These results are above those obtained by Gonzalez et al. [18] and Almanza et al. [17] .
The results obtained in this research can be contrasted with those reported by other authors and in different countries. An example of this are the Atlas of Solar Radiation obtained for Galicia, Spain [2] , Iberian Peninsula [27] , Peru [28] and Colombia [29] . In the case of Jalisco, the information generated is based on knowing and demonstrate the importance that the use of solar resource.
The above-mentioned countries receive a smaller amount of hours of sun and a solar potential between 4 and 5 kWh/m2-Day and, however, have already begun their development effectively.
In counterpart, Mexico and particularly in Jalisco that presents adequate conditions for its utilization, has not yet been promoted and developed as it should. Although it is known that the provision of solar energy is subject to geographical features, weather, climate, technological progress and, in the case of Mexico, to their public policies in the field of energy, the present study shows that the region is ideal for its rise and progress.
For this reason, it is necessary to know the amount and distribution of solar radiation incident on a territory, as well as daily, monthly and yearly variation. Precisely, Morton [30] notes that the Earth-Atmosphere system receives in an hour more solar energy of what human activities consume in a year.
The importance of the solar radiation, its measurement is scarce due to the high costs of the precision instruments required and its maintenance, so that the measurement network in the state of Jalisco and in other places of the world is limited. In this regard, the great topographical and climatic variability in Jalisco, oblige consider better-distributed monitoring networks that allow a more accurate and detailed assessment of this resource. It is necessary to use tools for data generation of solar irradiation in areas that do not have them; an example of this is the solar radiation characteristic of a particular region that is represented through monthly and annual maps with interpolation and extrapolation techniques made from measures on surfaces of other stations [28] .
In addition, detailed knowledge of the spatial and temporal distribution of the incoming solar radiation on the earth’s surface has the potential utility for a wide range of hydrological applications and agronomic characteristics, including the estimation of evapotranspiration and flows of regional carbon, the management of the water supply, and the application of precision farming practices [7] . Also, through weather satellites it is possible to estimate the surface irradiation in a number of sites, higher than the available ground sensors. The resolution on the regions of great geographical coverage is approximately 1 km2 when it comes to images in the visible spectrum. The cloud cover is the parameter with the largest influence on the solar radiation, so this capability of the satellites implies an important potential for assessing the solar resource [8] .
Finally, as for public policies it is necessary to indicate that while in eight axes of action in the National Strategy against the Climate change 2013-2018 one refers to the acceleration of the energetic transition towards sources of clean energy, to the reduction of the intensity of the energetic consumption, to the decrease of the pollution, between others, the National Strategy of Energy 2013- 2027 has an approach based on hydrocarbons, stimulating projects related to the extraction of the oil in deep waters of the Gulf of Mexico and the gas-shale. With this, the actions of the Government manifest certain uncertainty in the course to following in environmental matter and energetic sustainability [31] .
A study reported in DESERTEC [32] , states that Sun offers an important starting point because only in six hours, deserts receive more energy in relation that humanity consumes in a year. Faced with this remark, the question arises why the use of this resource has not been developed and consolidated, as it should? Today’s society is faced with the opportunity to reverse the damage to the environment. On the other hand, big international corporations dedicated to the utilization of the solar power have put his look in Mexico, doing studies on surface insolation levels and they are obtaining positive information for the exploitation of this resource. In addition, it enters the plans of the Federal Government for the development of networks that allow implementing renewable energies, particularly solar and wind [10] . It is also relevant to note that in Latin America, Mexico compared with Brazil, Chile and Argentina, is the one with the highest potential for converting Sun’s energy into electricity.
6. Conclusions
Solar energy development plans may be the most beneficial from the environmental point of view. The impacts are specific for each type of region. Taking advantage of the solar potential in the territory depends on various aspects, such as weather and climatic conditions in the area, the intensity of solar radiation received at the surface, as well as the hours of Sun that they register every day. If the geographical position of the zone is favorable and the climatic information enters the permissible range, there can be carried out tasks of utilization of the solar power.
According to the results achieved, the territory of Jalisco receives generous amount of solar radiation (7 and 8 kWh/m2-day by an average of 11 to 12 hours of daily sun), enough reason to boost its development.
The information derived from this research allows catching the investors’ attention and society in general on the use of renewable sources of energy, especially solar. Likewise, it stimulates the innovation and development of necessary technologies to obtain heat and electricity in diverse applications such as electrification projects, water heating, dehydration of food, in agriculture, in ranching, bioclimatic design of buildings, among others.
The use of the solar potential is a viable and credible alternative for the generation of clean energy; therefore, this one must be in use and his cost must be reasonable. Though the renewable resources are generally difficult and far from their increased demand, the problems of transfer and energetic storage must be approached from his accessibility, his cost, guarantees and the application of the framework of law. The latter is manifesting as the biggest obstacle to their progress [33] .
Sun has a unique role in sustainable energy production and far exceeds other sources of renewable energy. This solar energy can be converted, captured and stored steadily for use for the benefit of societies and environmental protection; in addition to do the energy in self-sufficient regions as mentioned [6] .
Finally, one of the advantages that offer the solar power is to generate electricity in isolated places, without needing to implement electrical traditional infrastructure. This allows the opportunity of the population to obtain the benefits of the electricity without causing environmental damage and significant savings. In addition, in conformity with Thoma, et al. [13] , Sun is not subject to the international markets, for what, the installation in any remote regions and a good training to the population can be the opportunity to generate employments, to diminish the migration and the urban conglomerates.
Cite this paper
Ulloa-Godinez, H.H., García-Guadalupe, E.M., Ramírez- Sánchez, U.H., Regla-Carrillo, C.J. and Fajardo-Montiel, L.A. (2017) Solar Radiation Data for the State of Jalisco and Guadalajara Metropolitan Zone, Mexico. Computational Water, Energy, and Environmental Engineering, 6, 205-228. https://doi.org/10.4236/cweee.2017.63015
References
- 1. Ulloa, H., García, M., Pérez, A., Meulenert, A. and ávila, D. (2011) Clima y radiación solar en las grandes ciudades: zona metropolitana de Guadalajara (estado de Jalisco, México). Investigaciones Geográficas, 56, 165-175.
- 2. Petazzi, A. and Salzón, S. (2011) Atlas de Radiación Solar de Galicia. Xunta de Galicia. Consellería de Medio Ambiente, Territorio e Infraestructuras. Meteo Galicia, España.
- 3. Fernández, S. and José, M. (2009) Tecnología de las energías renovables. Ediciones Mundi-Prensa. Madrid, España.
- 4. Labiano, G. (2008) El mercado de Energía Solar en California. Oficina económica y comercial de la embajada de España en Los ángeles. Estudios de mercado. Instituto español de comercio exterior. 144.
- 5. Plan de energía renovable en España 2005-2010 (2005) Resumen del PER para el consejo de ministros. Ministerio de industria, turismo y comercio. Instituto para la diversificación y ahorro de energía. 80.
- 6. Lewis, N. and Nocera, D. (2006) Powering the Planet: Chemical Challenges in Solar Energy Utilization. PNAS, 103, 15729-15735.
https://doi.org/10.1073/pnas.0603395103 - 7. Otkin, J. and Anderson, M. (2005) Validation of GOES-Based Insolation Estimates Using Data from the U.S. Climate Reference Network. Journal of Hydrometeorology, 6, 460-475.
https://doi.org/10.1175/JHM440.1 - 8. Vega de Kuyper, J.C. and Ramírez, M.S. (2014) Fuentes de energía, renovables y no renovables. Aplicaciones. Alfaomega grupo editor. México. 668.
- 9. Desertec Foundation (2015) Mapa del Cinturón Global Solar.
http://www.desertec.org - 10. Amelio, M.R. (2011) Energía fotovoltaica: Presente y futuro. Revista de Energías Renovables. 9, 28.
- 11. Solar Power Europe (2015) European Photovoltaic Industry Association. Estudio de los países con gran potencial solar ubicados dentro del cinturón global solar en el año 2010.
http://www.solarpowereurope.org - 12. De Energía, S. (2015) Atlas de Potencial Solar y Eólico de la República Mexicana. Energías Renovables.
http://www.gob.mx - 13. Gómez, J. (2011) Atlas Agroclimático de la República Mexicana. Departamento de Geografía, División de estudios de posgrado, Facultad de filosofía y letras. UNAM, México.
http://observatoriogeograficoamericalatina.org.mx - 14. Thoma, U., Dominguez, G. and Bolaños, J.L. (2013) De lo Insostenible a lo Sustentable. Propuestas básicas, indicadores y casos de éxito para tomar decisiones sustentables en México. Editorial IEXE.
- 15. Ernest and Young Organization (2012) Renewable Energy Country Attractiveness Indices—May 2012 Issue 33. EYGM, DE0331, Reino Unido.
- 16. Díaz, R. (2015) Energía eléctrica sostenible a través de la energía solar térmica. Instituto Politécnico Nacional-Escuela Superior de Ingeniería Mecánica y Eléctrica. México, D.F. Tesis Profesional. 74.
- 17. Almanza, R., Cajigal, E. and Barrientos, J. (1997) Actualización de los Mapas de Irradiación Global solar en la República Mexicana. Reportes de insolación de México. Southwest Technology Development Institute, NMSU, 1999.
http://solar.nmsu.edu/wp_guide/Apen_A.htm - 18. González, A., Loza, L. and Gómez, J. (2010) Características climáticas generales en la Zona Metropolitana de Guadalajara. 16.
http://sincronia.cucsh.udg.mx/gonzalezsalazarspring2010.htm - 19. Garatuza-Payan, J., Pinker, R.T., Shuttleworth, W.J. and Watts, C.J. (2001) Solar Ratiation and Evapotranspiration in Northern Mexico Estimated from Remotely Sensed Measurements of Cloudiness. Hydrological Sciences Journal, 46, 465-478.
https://doi.org/10.1080/02626660109492839 - 20. Gobierno del Estado de Jalisco (2015) Ubicación geográfica de Jalisco.
http://www.Jalisco.gob.mx - 21. García, M., Ulloa, H., Ramírez, H., Fuentes, M., Arias, S. and Espinoza, M. (2014) Comportamiento de los vientos dominantes y su influencia en la contaminación atmosférica en la zona metropolitana de Guadalajara, Jalisco, México. Revista Iberoamericana de Ciencias, 1, 97-116.
http://www.reibci.org - 22. PROAIRE 2011-2020 (2011) Programa para Mejorar la Calidad del Aire Jalisco 2011-2020. Inventario de emisiones. 231 p.
http://www.semades.jalisco.gob.mx - 23. Servicio Meteorológico Nacional (2015) Comisión Nacional del Agua. smn. conagua. gob. mx. Secretaría del Medio Ambiente y Recursos Naturales.
- 24. Instituto de Astronomía y Meteorología (2010) Estación meteorológica y base de datos climatológicos. Centro Universitario de Ciencias Exactas e Ingenierías. Universidad de Guadalajara, Jalisco, México.
- 25. Stewart, J.B., Watts, C.J., Rodríguez, J.C., De Bruin, H.A., Van den Berg, A.R. and Garatuza-Payan, J. (1999) Use of Satellite Data to Estimate Radiation and Evaporation for North-West Mexico. Agricultural Water Management, 38, 181-193.
- 26. Ministry of Economy, Trade, and Industry of Japan METI and National Aeronautic and Space Administration NASA (2011) Información global incidente en superficie horizontal período 1983-2005. >http://eosweb.larc.nasa.gov Período 2006-2011.
http://neo.sci.gsfc.nasa.gov - 27. Vera Mella, N. (2005) Atlas climático de irradiación solar a partir de imágenes del satélite NOAA. Aplicación a la península ibérica. Tesis doctoral. Universidad Politécnica de Cataluña, España.
- 28. Trebejo, I. (2003) Atlas de energía solar del Perú. Proyecto PER/98/G31. Electrificación Rural a Base de Energía Fotovoltaica En El Perú. Servicio Nacional de Meteorología e Hidrología. Dirección general de Investigación y Asuntos Ambientales. Ministerio de Energía y Minas. Dirección Ejecutiva de Proyectos. 31. República del Perú.
- 29. Unidad de Planeación Minero Energética (2015) Atlas de radiación solar de Colombia. Ministerio de Minas y Energía. Ministerio de Ambiente, Vivienda y Desarrollo Territorial.
http://www.upme.gov.co - 30. Morton, O. (2006) Solar Energy: A New Day Dawning? Silicon Valley Sunrise. Nature, 443, 19-22.
https://doi.org/10.1038/443019a - 31. Secretaría de Energía (2013) Estrategía Nacional de Energía 2013-2027. México, D.F.
- 32. Desertec Foundation (2010).
http://www.desertec.org - 33. Cavallo Alfred, J. (2001) Energy Storage Technologies for Utility Scale Intermittent Renewable Energy Systems. Journal of Solar Energy Engineering, 123, 387-389.
https://doi.org/10.1115/1.1409556