Crystal Structure Theory and Applications
Vol. 2 No. 3 (2013) , Article ID: 37248 , 7 pages DOI:10.4236/csta.2013.23013
Ce-SAD Phasing of Glucose Isomerase and Thermolysin Using Cu Kα Radiation
Centre of Advanced Study in Crystallography and Biophysics, University of Madras, Maraimalai (Guindy) Campus, Chennai, India
Email: *shirai2011@gmail.com
Copyright © 2013 Sibi Narayanan, Devadasan Velmurugan. This is an open access article distributed under the Creative Commons Attribution License, which permits unrestricted use, distribution, and reproduction in any medium, provided the original work is properly cited.
Received May 21, 2013; revised June 23, 2013; accepted July 19, 2013
Keywords: Anomalous scattering; SAD phasing; Ce; Glucose Isomerase; Thermolysin
ABSTRACT
Current structural genomics projects aim to solve a large number of selected protein structures as fast as possible. High degree of automation and standardization is required at every step of the whole process to speed up protein structure determination. Phase problem is a bottleneck in macromolecular structure determination and also in model building which is a time-consuming task. The simplest approach to phasing macromolecular crystal structures is the use of a SAD signal. SAD data can be collected using the in-house copper (1.54 Å) wavelength source. Data collected using copper wavelength with the incorporation of anomalously scattering heavy metal atoms may serve as a powerful tool for structural biologists to solve novel protein structures as well where synchrotron beam line is not available. A short soak of protein crystals in heavy metal solution or by incorporating heavy atoms into the protein drop while crystallizing the protein (co-crystallization) leads to incorporation of these heavy metal ions into the ordered solvent shell around the protein surface. The present work aims to determine whether cerium ion can be successfully incorporated into the protein crystal through quick-soaking method while maintaining the isomorphism. The study also aims in understanding whether this metal ion can be used for phasing purpose. The intensity data are collected and analyzed for anomalous signal, substructure solution and the binding sites.
1. Introduction
More than 85% of the structures in the Protein Data Bank [1] have been solved by using the versatile tool, X-ray crystallography. Automation in X-ray crystallography is necessary to speed up the structure determination process. Phase problem is rate limiting and a bottleneck in macromolecular crystallography [2]. Phases can be derived using Molecular Replacement (MR) method using the atomic coordinates of a structurally similar protein. MR is widely used, when appropriate models are available [3]. Phase problem can also be solved by Multiple Isomorphous Replacement (MIR) method for novel proteins. But in this approach, protein crystals are derivatized by soaking in solutions of organometallic compounds or metal salts and the choice of proper derivatives is very much dependent on the nature of the protein under study and therefore not easy to generalize. Non-isomorphism that exists between the derivative and native crystals also creates problems [4]. MIR has largely been replaced with the Multi-wavelength Anomalous Diffraction (MAD) and Single-wavelength Anomalous Diffraction (SAD) methods fuelled by progress in the technology of X-ray sources, detectors as well as in the methodology of diffraction data-acquisition and phasing algorithms [5,6]. Anomalous scattering methods are widely used to solve the phase problem in macromolecular crystallography where molecular replacement fails [7,8]. For MAD data, selenomethionine has to be introduced during expression itself instead of methionine present in the protein and the data has to be collected at varied wavelengths at a synchrotron data source near the Selenium absorbtion edge. Sometimes MAD may fail due to disorder in methionine residues [9], and producing selenomethionine labeled proteins is not amenable for all expression systems. The simplest approach to phasing macromolecular crystal structures is the use of a SAD signal. SAD data can be collected using the in-house copper (1.54 Å) and chromium (2.29 Å) wavelength sources [10]. A single wavelength is sufficient for the collection of a SAD data [11]. The first step in solving macromolecular crystal structures by SAD is the location of anomalous scatterers. Currently sophisticated algorithms are very much available for data processing, substructure determination, phasing, density modification and model building. Recent studies show the great success of in-house SAD data even at low redundancy and low anomalous signal to noise ratio case [12].
Success in the location of the substructures and subsequent phasing depend critically on the quality of data and on the extent of the anomalous signal [13]. Exploiting the anomalous signal already present in the native protein or in the solvent would eliminate the extra experimental work in derivatization [14]. In the absence of such anomalous scatterers, the classic derivatization approach involves prolonged soaking of the native crystals in diluted solutions of various heavy metal salts [15].
A short soak of protein crystals in heavy metal solution or by incorporating heavy atoms into the protein drop while crystallizing the protein (co-crystallization) leads to incorporation of these heavy metal ions into the ordered solvent shell around the protein surface. In addition, incorporation of the heavy atoms also improves the nucleation process in the crystallization of proteins. Recently many novel protein structures have been solved using cobalt and cadmium incorporated as anomalous markers [16]. The use of heavy metal ion concentration and the soaking time vary from the different experiments carried out so far. It also depends on various factors such as protein crystal stability, molecular weight, pH, cryoprotectant etc. Heavy atoms can exist as individual ions when they are used in solution. Heavy atoms can constitute of a small molecule (a metal complex) or a small peptide such that, the isomorphism of the protein crystal does not get disturbed [17]. Heavy atoms have a property of dissolving into charged ions when they are used as their salt solution, which may later bind with the oppositely charged amino acid residues present in the proteins. There are also cases, where the heavy metal ion used may replace the similarly charged metal ions that are naturally present in the proteins [18].
Cerium ion is a heavy metal ion that has not been explored much. It exists as a trivalent ion in solution and has its L1 absorption edge at 1.8932 Å. The anomalous scattering coefficients are f′ = −1.88 and f″ = 9.74 ē, at copper wavelength (1.54 Å). Cerium has higher anomalous signal at copper wavelength than chromium source [19]. Cerium exists as a trivalent ion in CeCl3 solution. The van der Waals radius of cerium ion is 1.81 Å. Cerium has been derivatized using quick-soaking method into proteins viz., Glucose Isomerase (GI) and Thermolysin (TL). Sufficient occupation of sites and successful phasing has been achieved with the solution concentration of the metal ion concentration ranging from 0.1 M to 0.3 M. The present work aims to determine whether cerium ion can be successfully incorporated into the protein crystal through quick-soaking method while maintaining the isomorphism. The study also aims in understanding whether this metal ion can be used for phasing purpose. The intensity data were collected and analyzed for anomalous signal, substructure solution and the binding sites.
2. Methods
2.1. Crystallization
GI and TL were purchased from Sigma-Aldrich, USA [20] and used without further purification. The GI protein solution containing 33 mg/ml was mixed with the well solution consisting of 200 mM Magnesium chloride and 100 mM Tris, pH 4.7 at 2:1 ratio (2 µl protein solution + 1 µl well solution). TL protein solution containing 25 mg/ml was mixed with the well solution consisting of 1.4 mM Calcium Acetate, 10 mM Zinc Acetate, 1 mM Sodium Nitrate and 50 mM Tris; pH 7.3 at 1:1 ratio (1 µl protein solution + 1 µl well solution).
Cerium chloride used was of analytical grade (SigmaAldrich, USA). Cerium derivatives were obtained by cocrystallizing or soaking cerium chloride in the range of 100 mM to 300 mM. Well diffracting crystals were obtained in the above mentioned ranges. The crystal was transferred for a short period (120 seconds) to mother liquor supplemented with 25 % MPD and 25 % ethylene glycol for cryo-protection for GI and TL, respectively and then flash-freezed in nitrogen gas stream at 100 K. Protein crystals were obtained using hanging-drop vapour-diffusion method. Crystallization, cryoprotectant and soaking conditions are shown in Table 1.
2.2. Data Collection and Processing
Data sets were collected using mar 345 dtb Image Plate Detector equipped with in-house Microstar Cu Kα rotating-anode X-ray generator [21] operated at 40 kV and
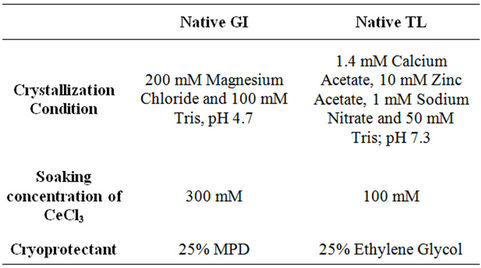
Table 1. Crystallization, soaking concentration and cryoprotectant details.
60 mA with Helios focusing mirrors. The slit size was set to 0.5/0.6, the crystal was mounted arbitrarily and no inverse beam technique was used to collect Bijvoet pairs. The detector was placed at a distance of 200 mm (GI) and 180 mm (TL), respectively for data collection. The diffraction images were collected over a total angular range of 360˚ with an oscillation angle of 1˚. The time per frame varied from 120 sec to 180 sec. Data sets were integrated and scaled using automar [22]. The anomalous signals of the data sets were analyzed using Phenix. xtriage [23].
Anomalous scatterers were found using the dual-space recycling algorithm enabled in SHELXD [24]. The density modified phases obtained from SHELXE were used for model building using the ARP/wARP program web server [25] and refined using REFMAC5.0 [26] of CCP4i software [27]. Clearly interpretable maps were obtained after automated model building. Totally, two datasets were collected (300 mM Ce for GI; 100 mM Ce for TL). The crystallographic data are summarized in Table 2.
3. Results and Discussion
3.1. Data Analysis
The data was processed with automar by separately merging the anomalous pairs as I+ and I−. The first five frames of 360 intensity images collected were used for peaksearch by the same program. The Rmerge value was found to be 5.3% and 6.8% for GI and TL data sets, respectively. Mosaicity for both the datasets was 0.49 and 0.52. The overall redundancy of the data collected to 2 Å at 100 K for the complete dataset were 14.7 and 40.40 for GI and TL datasets, respectively at high resolution bin.
The full resolution range of the data had anomalous signal measurability greater than 10%. The mean signal to noise ratio for all the datasets were found between 16.5 and 19.5. Both the datasets consist of significant anomalous signal measurability. Solvent contents of both the datasets were 56% and 46%, respectively.
Completeness for GI dataset was 100% and TL dataset was above 98%. Both the redundancy and completeness play a major role in model building after substructure determination. The B-factor (thermal factor) in both the datasets were 14.8 and 34.5, respectively. The final model of all the datasets were refined to reasonable Rwork and Rfree values. The substructure solution, phasing and refinement statistics are shown in Table 2.
3.1.1. Ce Soaked GI Data
Ce soaked GI crystallized in orthorhombic space group, P21212. GI crystallized as two molecules in the asymmetric unit. The structure is that of a homo-dimer. For Cesoaked GI dataset during the substructure solution, ten anomalous scatterer peaks were located. f″ for manga-
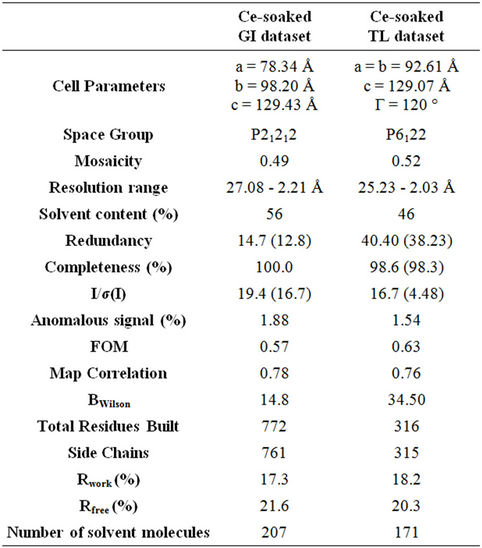
Table 2. Crystal Data Statistics, phasing and model building details.
nese ion and magnesium ion at copper wavelength is 2.8 ē and 1.75 ē as estimated from program CROSSEC [28]. The resolution cutoff for finding heavy atom site was left to SHELXC [29]. Peaks for eight cerium ions, one manganese ion and one magnesium ion were picked or determined using SHELXD. The resolution cutoff used for the substructure determination was 3.0 Å. The electron density map correlation was above 75% for the dataset. The best solution obtained from SHELXD run was used directly for phase calculation and further improvement was done by density modification with program SHELXE. The mean Figure of Merit (FOM) was found to be 0.57, indicating good phasing.
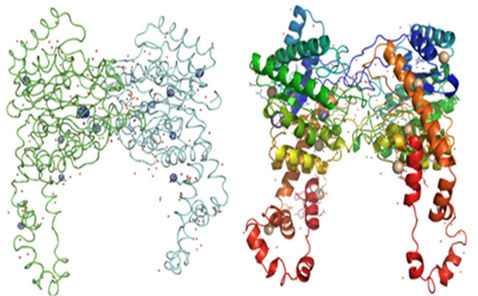
The poly ala or preliminary model building was carried out using SHELXE beta version and the output model was fed as input to ARP/wARP for automated building. 772 residues (dimer) were built out of a total of 776 amino acids (388 amino acids in each molecule) using ARP/wARP for GI data, which clearly shows the good phasing and model building. Clearly interpretable electron density maps were obtained after the automated model building. More than 98% of the residues were able to be built using ARP/wARP program. The redundancy of data around 14 collected with three minute exposure time was sufficient to solve the structure at 2.21 Å resolution data by in-house Ce-SAD. Manual rebuilding was carried out using COOT [30] and the model was finally refined to Rwork and Rfree of 17.3% and 21.6%, respectively. Anomalous map of monomeric GI with eight cerium ions, one manganese ion and one magnesium ion at 5σ with water molecules is shown in Figure 1.
3.1.2. Cerium Soaked TL Data
Ce soaked TL crystallized in hexagonal space group, P6122. TL was crystallized as a monomer in the asymmetric unit. At the copper wavelength of 1.54 Å, f″ for S, Ca and Zn are 0.56 ē, 1.28 ē and 0.68 ē, respectively as estimated from program CROSSEC. The resolution cutoff for finding heavy atom site was left to SHELXC. For the cerium soaked TL dataset, SHELXD located eight peaks as anomalous scatterers. The peaks corresponded to three cerium ions, three calcium ions, one zinc ion and one sulfur atom. Beta-test version of SHELXE was used for phasing, density modification and main-chain autotracing.
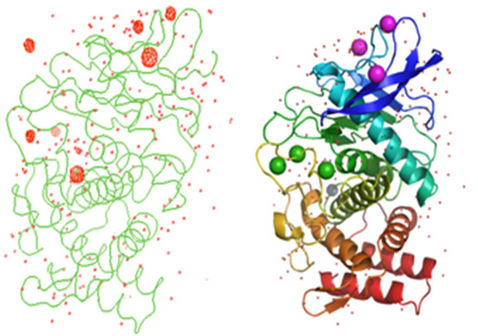
The poly ala residues obtained as output from SHELXE were given to ARP/wARP as input for model building. The automated solution and the model building by ARP/wARP built 316 amino acid residues totally. ARP/wARP built 99% of the residues for the dataset. Clearly interpretable maps were obtained after automated model building. The electron density map correlation was above 75% for the dataset. The mean Figure of Merit (FOM) was found to be 0.63, indicating good phasing. The model obtained was manually corrected using COOT and refined using REFMAC5.0. The final atomic model has crystallographic Rwork and Rfree values of 18.2% and 20.3%, respectively. Anomalous difference Fourier map of monomeric TL with three cerium ions, three calcium ions, one zinc ion and one sulfur atom at 5σ with water molecules is shown in Figure 2.
3.2. Cerium Ion Binding Sites
f″ for cerium at copper wavelength is 9.76 ē. For Cesoaked GI dataset, substructure solution resulted in eight high peaks corresponding to cerium (III) ions with data limited up to 3.0 Å. The molecular structure remains the same after the binding of cerium ion to the protein. All the cerium peaks showed good spherical density. The occupancies of the cerium ions in GI were (0.42, 0.46, 0.45, 0.53, 0.56, 0.61, 0.62, 0.64). Metal ions have the nature of coordinating with the atoms of amino acid residues. This knowledge allowed us in assigning the peaks as cerium ions. The positions of the cerium ions were validated by the anomalous map shown in Figure 1. Manganese and Manganese ion peaks also had spherical density in the anomalous map. The positions of the manganese ion and magnesium ion peaks were identified by comparing the manganese and magnesium ion positions or occupied sites in the earlier reported GI structure [31]. This structure is a dimer with 776 amino acids.
Coordination distances for cerium ions w.r.t protein atoms and water molecules varied from 2.6 Å to 4.3 Å. The amine group present in the Arginine residue (ARG 266) interacts with the cerium ion (CE1) present in the first molecule of the GI. Occupancy of the CE1 is 0.42. Similar interaction between ARG 266 and cerium ion (CE2) was also observed in the second molecule of the same protein GI. Occupancy of CE2 is 0.46. Nitrogen atom present in the amine group of Arginine residue (ARG 387) interacts with another cerium ion (CE3) present in the first molecule of the protein GI. Occupancy of CE3 is 0.45. Interactions or co-ordinations are also found between water molecules and cerium ions in both the molecules. Out of the eight cerium sites, three cerium ions did not exhibit any coordination with any of the amino acid residues or water molecules. Cerium sites having hydrogen bonding contacts with hydrogen-donor groups of protein or water molecules are shown in Figures 3(a)-(e).
 (a) (b)
Figure 1. (a) Anomalous difference fourier map and (b) Cartoon representation of homo-dimer GI with eight cerium ions, one manganese ion and one magnesium ion at 5σ with water molecules.
 (a) (b)
Figure 2. (a) Anomalous difference Fourier map and (b) Cartoon representations of monomeric TL with three cerium ions, three calcium ions, one zinc ion and one sulfur atom at 5σ with water molecules.
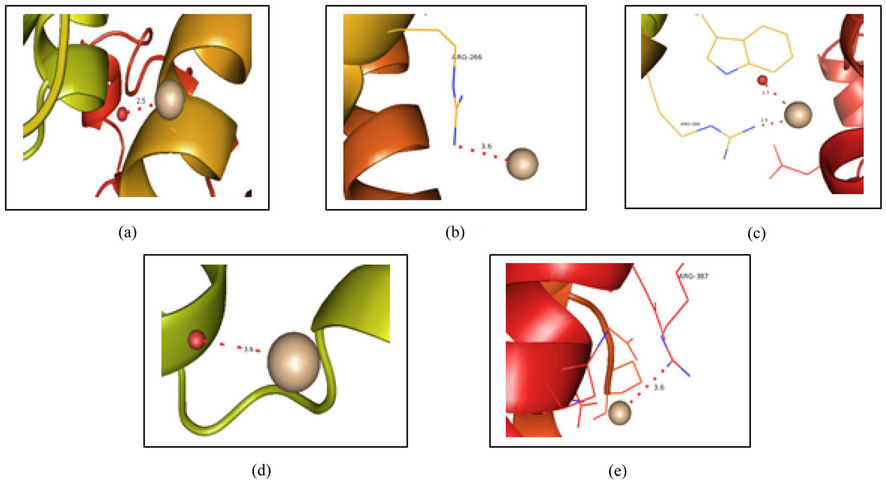
Figure 3. Picture showing (a) The coordination of First cerium ion with the water molecule in first molecule of GI, (b) The coordination of another cerium ion with the Arg 266 present in the first molecule of GI, (c) The coordination of another cerium ion with the Arg 263 and the water molecule present in the second molecule of GI, (d) The coordination of Fifth cerium ion with the water molecule present in the second molecule of GI, and (e) The coordination of another cerium ion with the Arg 387 present in the first molecule of GI.

Figure 4. Picture showing the coordination binding of cerium ion with the Lys 45 and water molecule present in the TL.
For Ce-soaked TL data set, substructure solution determined anomalous scatterers for three cerium ions, three calcium ions, one zinc ion and two sulfur atoms. The cerium peaks showed spherical density with occupancies of 0.52, 0.58 and 0.63. The sulfur atom of methionine also showed spherical density. The positions of the three calcium ion peaks and one zinc ion peak were identified or validated by comparing their respective positions in the earlier reported TL structures [32]. The molecular structure remains the same after cerium ion binds to the protein. Coordination distances for cerium ions with respect to protein atoms and water molecules varied from 3.0Å to 3.2Å. Inspection of cerium ions in the structure of the protein reveals that they have occupied sites replacing the water molecules in the crystal lattice. Cerium ion (CE1) has coordination with Lysine residue (LYS 46) present in the protein TL. Occupancy of CE1 is 0.58. Cerium ion also shows a water mediated interaction. Cerium soaked data of Hen Egg White Lysozyme (HEWL) have already been solved using lab source method [33].
In the data, three bound cerium ions in the HEWL provided sufficient anomalous signal for phasing of 129 amino acid residues with the redundancy of 5.03. Cerium sites having hydrogen bonding contacts with hydrogen-donor groups of protein or water molecules are shown in Figure 4. The heavy metal ions (cerium) diffuse into protein crystals very quickly. A high salt concentration of the same increases the number of sites and their occupancy.
4. Conclusion
Cerium ions were incorporated separately using quicksoaking method in order to understand the binding of heavy atoms to the protein crystals and their interactions with the functional groups of amino acids. The concentration of salt in the soaking solution plays a vital role than a prolonged soaking time. Owing to high anomalous scattering coefficient of the heavy metal ions used with respect to copper wavelength (1.54Å), (f″ = 9.74 ē), they prove to be excellent heavy atom markers for automated phasing. The well bound cerium ions in both the datasets provide sufficient anomalous signal for phasing of 772 (GI) and 316 (TL) amino acid residues, with the redundancy values of 14.7 and 40.40, respectively. The high solubility of cerium chloride in water and binding of the Ce (III) ions on the enzymes surface provide an added advantage for phasing. Present study also reveals that the dataset with prolonged soaking time has higher anomalous signal even at high resolution range. Metal ions present in the soaking solution in molar concentrations are well enough to rapidly diffuse or enter into protein crystals. This method fulfills the requirements of being first choice for high-throughput structural genomics projects and can be proposed as an alternative to prepare derivatives when a protein does not bind heavy metal atoms or ions. Data collected using copper wavelength with the incorporation of anomalously scattering heavy metal atoms may hence serve as a powerful tool for structural biologists to solve novel protein structures as well as in places where synchrotron beam line is not available.
5. Acknowledgements
SN and DV thank UGC (SAP), Government of India for the financial support for this research. DV thanks DSTFIST and UGC-SAP for funding facilities to the Centre for Advanced Study in Crystallography and Biophysics. SN and DV thank Department of Biotechnology, Govt. of India for the financial support for the in-house macromolecular data collection facility.
REFERENCES
- C. Lee and H. M. Berman et al., “The Protein Data Bank and the Challenge of Structural Genomics,” Nature Structure Biology, Vol. 7, No. 1, 2000, pp. 957-959. doi:10.1038%2F80734
- W. A. Hendrickson and C. M. Ogata, “Phase Determination from Multiwavelength Anomalous Diffraction Measurements,” Methods in Enzymology, Macromolecular Crystallography, Part A, Vol. 276, 1997, pp. 494-523. doi:10.1016/S0076-6879(97)76074-9
- D. Blow, “Outline of Crystallography for Biologists,” Oxford University Press, Oxford, 2002
- W. Yang, W. A. Hendrickson, R. J. Crouch and Y. Satow, “Structure of Ribonuclease H Phased at 2 A Resolution by MAD Analysis of the Selenomethionyl Protein,” Science, Vol. 249, No. 4975, 1990, pp. 1398-1405. doi:10.1126/science.2169648
- J. E. Debreczeni, G. Bunkóczi, B. Girmann and G. M. Sheldrick, “In-House Phase Determination of the Lima Bean Trypsin Inhibitor: A Low-Resolution Sulfur-SAD Case,” Acta Crystallographica, Vol. D59, No. 2, 2003, pp. 393-395. doi:10.1107/S0907444902020917
- Z. Dauter, “Estimation of Anomalous Signal in Diffraction Data,” Acta Crystallographica, Vol. D62, No. 8, 2006, 867-876. doi:10.1107%2FS0907444906023481
- W. A. Hendrickson, “Determination of Macromolecular Structures from Anomalous Diffraction of Synchrotron Radiation,” Science, Vol. 254, No. 5028, 1991, pp. 51-58. doi:10.1107%2FS0907444906023481
- J. L. Smith, “Determination of Three-Dimensional Structure by Multiwavelength Anomalous Diffraction,” Current Opinion in Structure Biology, Vol. 1, No. 6, 1991, pp. 1002-1011. doi:10.1016%2F0959-440X%2891%2990098-E
- M. Yogavel, J. Gill and A. Sharma, “Iodide-SAD, SIR and SIRAS Phasing for Structure Solution of a Nucleosome Assembly Protein,” Acta Crystallographica, Vol. D65, No. 6, 2009, pp. 618-622. doi:10.1107%2FS0907444909013171
- D. K. Carugo, J. R. Helliwell, H. Stuhrmann and M. S. Weiss, “Softer and Soft X-Rays in Macromolecular Crystallography,” Journal of Synchrotron Radiation, Vol. 12, No. 4, 2005, pp. 410-419. doi:10.1107/S0909049504025762
- L. M. Rice, T. N. Earnest and A. T. Brunger, “SingleWavelength Anomalous Diffraction Phasing Revisited,” Acta Crystallographica, Vol. D56, No. 11, 2000, pp. 1413-1420. doi:10.1107%2FS0907444900010039
- M. Yogavel, J. Gill, P. C. Mishra and A. Sharma, “SAD Phasing of a Structure Based on Cocrystallized Iodides Using an in-House Cu Kalpha X-Ray Source: Effects of Data Redundancy and Completeness on Structure Solution,” Acta Crystallographica, D63, No. 8, 2007, pp. 931- 934. doi:10.1107%2FS0907444907029174
- T. L. Blundell, H. Jhoti, and C. Abell, “High-Throughput Crystallography for Lead Discovery in Drug Design,” Nature Reviews Drug Discovery, Vol. 1, No. 1, 2002, pp. 45-54. doi:10.1038%2Fnrd706
- B.-C. Wang, “Resolution of Phase Ambiguity in Macromolecular Crystallography,” Methods in Enzymology, Vol. 115, Diffraction Methods for Biological Macromolecules, Part B, Academic Press, New York, 1985, pp. 90-111. doi:10.1016/0076-6879(85)15009-3
- J. E. Debreczeni, G. Bunkoczi, Q. Ma, H. Blaser and G. M. Sheldrick, “In-House Measurement of the Sulfur Anomalous Signal and Its Use for Phasing,” Acta Crystallographica, D59, No. 4, 2003, pp. 688-696. doi:10.1107/S0907444903002646
- G. Guncar, C.-I. A. Wang, J. K. Forwood, T. Teh, A.-M. Catanzariti, J.G. Ellis, P.N. Dodds and B. Kobe, “The use of Co2+ for Crystallization and Structure Determination, Using a Conventional Monochromatic X-Ray Source, of Flax Rust Avirulence Protein,” Acta Crystallographica, Vol. F63, No. 3, 2007, pp. 209-213. doi:10.1107/S1744309107004599
- M. Yogavel, N. Nithya, A. Suzuki, Y. Sugiyama, T. Yamane, D. Velmurugan and A. Sharma, “Structural Analysis of Actinidin and a Comparison of Cadmium and Sulfur Anomalous Signals from Actinidin Crystals Measured Using In-House Copperand Chromium-Anode X-ray Sources,” Acta Crystallographica, Vol. D66, No. 12, 2010, pp. 1323-1333. doi:10.1107/S0907444910040394
- C. P. Hill, Z. Dauter, E. J. Dodson, G. G. Dodson and M. F. Dunn, “X-Ray Structure of an Unusual Calcium Site and the Roles of Zinc and calciUm in the Assembly, Stability, and Storage of the Insulin Hexamer,” Biochemistry, Vol. 30, No. 4, 1991, pp. 917-924. doi:10.1021/bi00218a006
- L.-J. Baker, J. A. Dorocke, R. A. Harris and D. E. Timm, “The Crystal Structure of Yeast Thiamin Pyrophosphokinase,” Structure, Vol. 9, No. 6, 2001, pp. 539-546. doi:10.1016/S0969-2126(01)00615-3
- Sigma-Aldrich Corp., St. Louis, MO, USA.
- Bruker AXS GmbH, Ostliche Rheinbruckenstr, 49, 76187, Karlsruhe, Germany.
- Marresearch, GmbH, Hans-Böckler-Ring 17, D-22851, Norderstedt, Germany.
- P. D. Adams, et al., “PHENIX: A Comprehensive Python-Based System for Macromolecular Structure Solution,” Acta Crystallographica, Vol. D66, No. 2, 2010, pp. 213-221. doi:10.1107/S0907444909052925
- G. M. Sheldrick, H. A. Hauptman, C. M. Weeks, M. Miller and I. Uson, “Ab Initio Phasing,” In: E. Arnold and M. Rossman, Eds., International Tables for Crystallography, Vol. F, Chapter 16.1, IUCr and Kluwer Academic Publishers, Dordrecht, 2001, pp. 333-345.
- A. Perrakis, R. J. Morris and V. S. Lamzin, “Automated Protein Model Building Combined with Iterative Structure Refinement,” Nature Structural & Molecular Biology, Vol. 6, No. 1, 1999, pp. 458-463. doi:10.1038/8263
- G. N. Murshudov, A. A. Vagin and E. J. Dodson, “Refinement of Macromolecular Structures by the Maximum-Likelihood Method,” Acta Crystallographica, Vol. D53, No. 3, 1997, pp. 240-255. doi:10.1107/S0907444996012255
- CCP4 (Collaborative Computational Project, Number 4), “The CCP4 Suite: Programs for Protein Crystallography,” Acta Crystallographica, Vol. D50, No. 5, 1994, pp. 760- 763. doi:10.1107/S0907444994003112
- T. C. Don, “Calculation of Anomalous Scattering Factors at Arbitrary Wavelengths,” Journal of Applied Crystallography, Vol. 16, No. 4, 1983, pp. 437-438. doi:10.1107%2FS0021889883010791
- G. M. Sheldrick, “Experimental phasing with SHELXC/ D/E: Combining Chain Tracing with Density Modification,” Acta Crystallographica, Vol. D66, No. 4, 2010, pp. 479-485. doi:10.1107%2FS0907444909038360
- P. Emsley and K. Cowtan, “Coot: Model-Building Tools for Molecular Graphics,” Acta Crystallographica, Vol. D60, No. 12, 2004, pp. 2126-2132. doi:10.1107%2FS0907444904019158
- H. L. Carrell, H. Hoier and J. P. Glusker, “Modes of Binding Substrates and Their Analogues to the Enzyme D-Xylose Isomerase,” Acta Crystallographica, Vol. D50, No. 2, 1994, 113-123. doi:10.1107%2FS0907444993009345
- C. Mueller-Dieckmann et al., “On the routine use of soft X-rays in Macromolecular Crystallography. Part IV. Efficient Determination of Anomalous Substructures in Biomacromolecules Using Longer X-ray Wavelengths,” Acta Crystallographica, Vol. D63, 2007, 366-380. doi:10.1107%2FS0907444906055624
- K. N. Vennila and D. Velmurugan, “In-House SAD Phasing with Surface-Bound Cerium Ions,” Acta Crystallographica, Vol. F67, No. 12, 2011, pp. 1662-1665. doi:10.1107/S1744309111035718
NOTES
*Corresponding author.